Agent Logs is the central place in Aesthetix CRM to see how your AI agents behaved, measure their activity and track goals. Open it at AI Agents > Agent Logs. It applies to supported AI products, not only Agent Studio: currently Agent Studio and Voice AI are live, with Conversational AI and Managed Agents shown in its filters, layouts and headers, and more products being added. This guide also explains the AI Usage page for your account.
Protected health information (PHI): AI features in Aesthetix CRM are not approved for processing PHI. Logs store the conversations an agent had, so do not let agents handle PHI, and do not put patient health details into test messages, instructions, files, memory or knowledge. If a log contains something that should not be there, treat it as a privacy incident under your own HIPAA procedures.
Agent Logs gives you a three-level view: a high-level activity list, a conversation with an execution timeline for one interaction, and a granular step view for debugging. It needs no installation. It is different from the Message Execution Timeline in the Agent Studio test panel, which belongs to testing and debugging.
Benefits: one place to review agent activity, faster troubleshooting (list, then conversation, then step), better debugging context, step-level timing to spot slow areas, and more confidence when inspecting prompts, logic, variables and tool behavior.
Use this list to monitor recent activity and find the interaction to inspect.
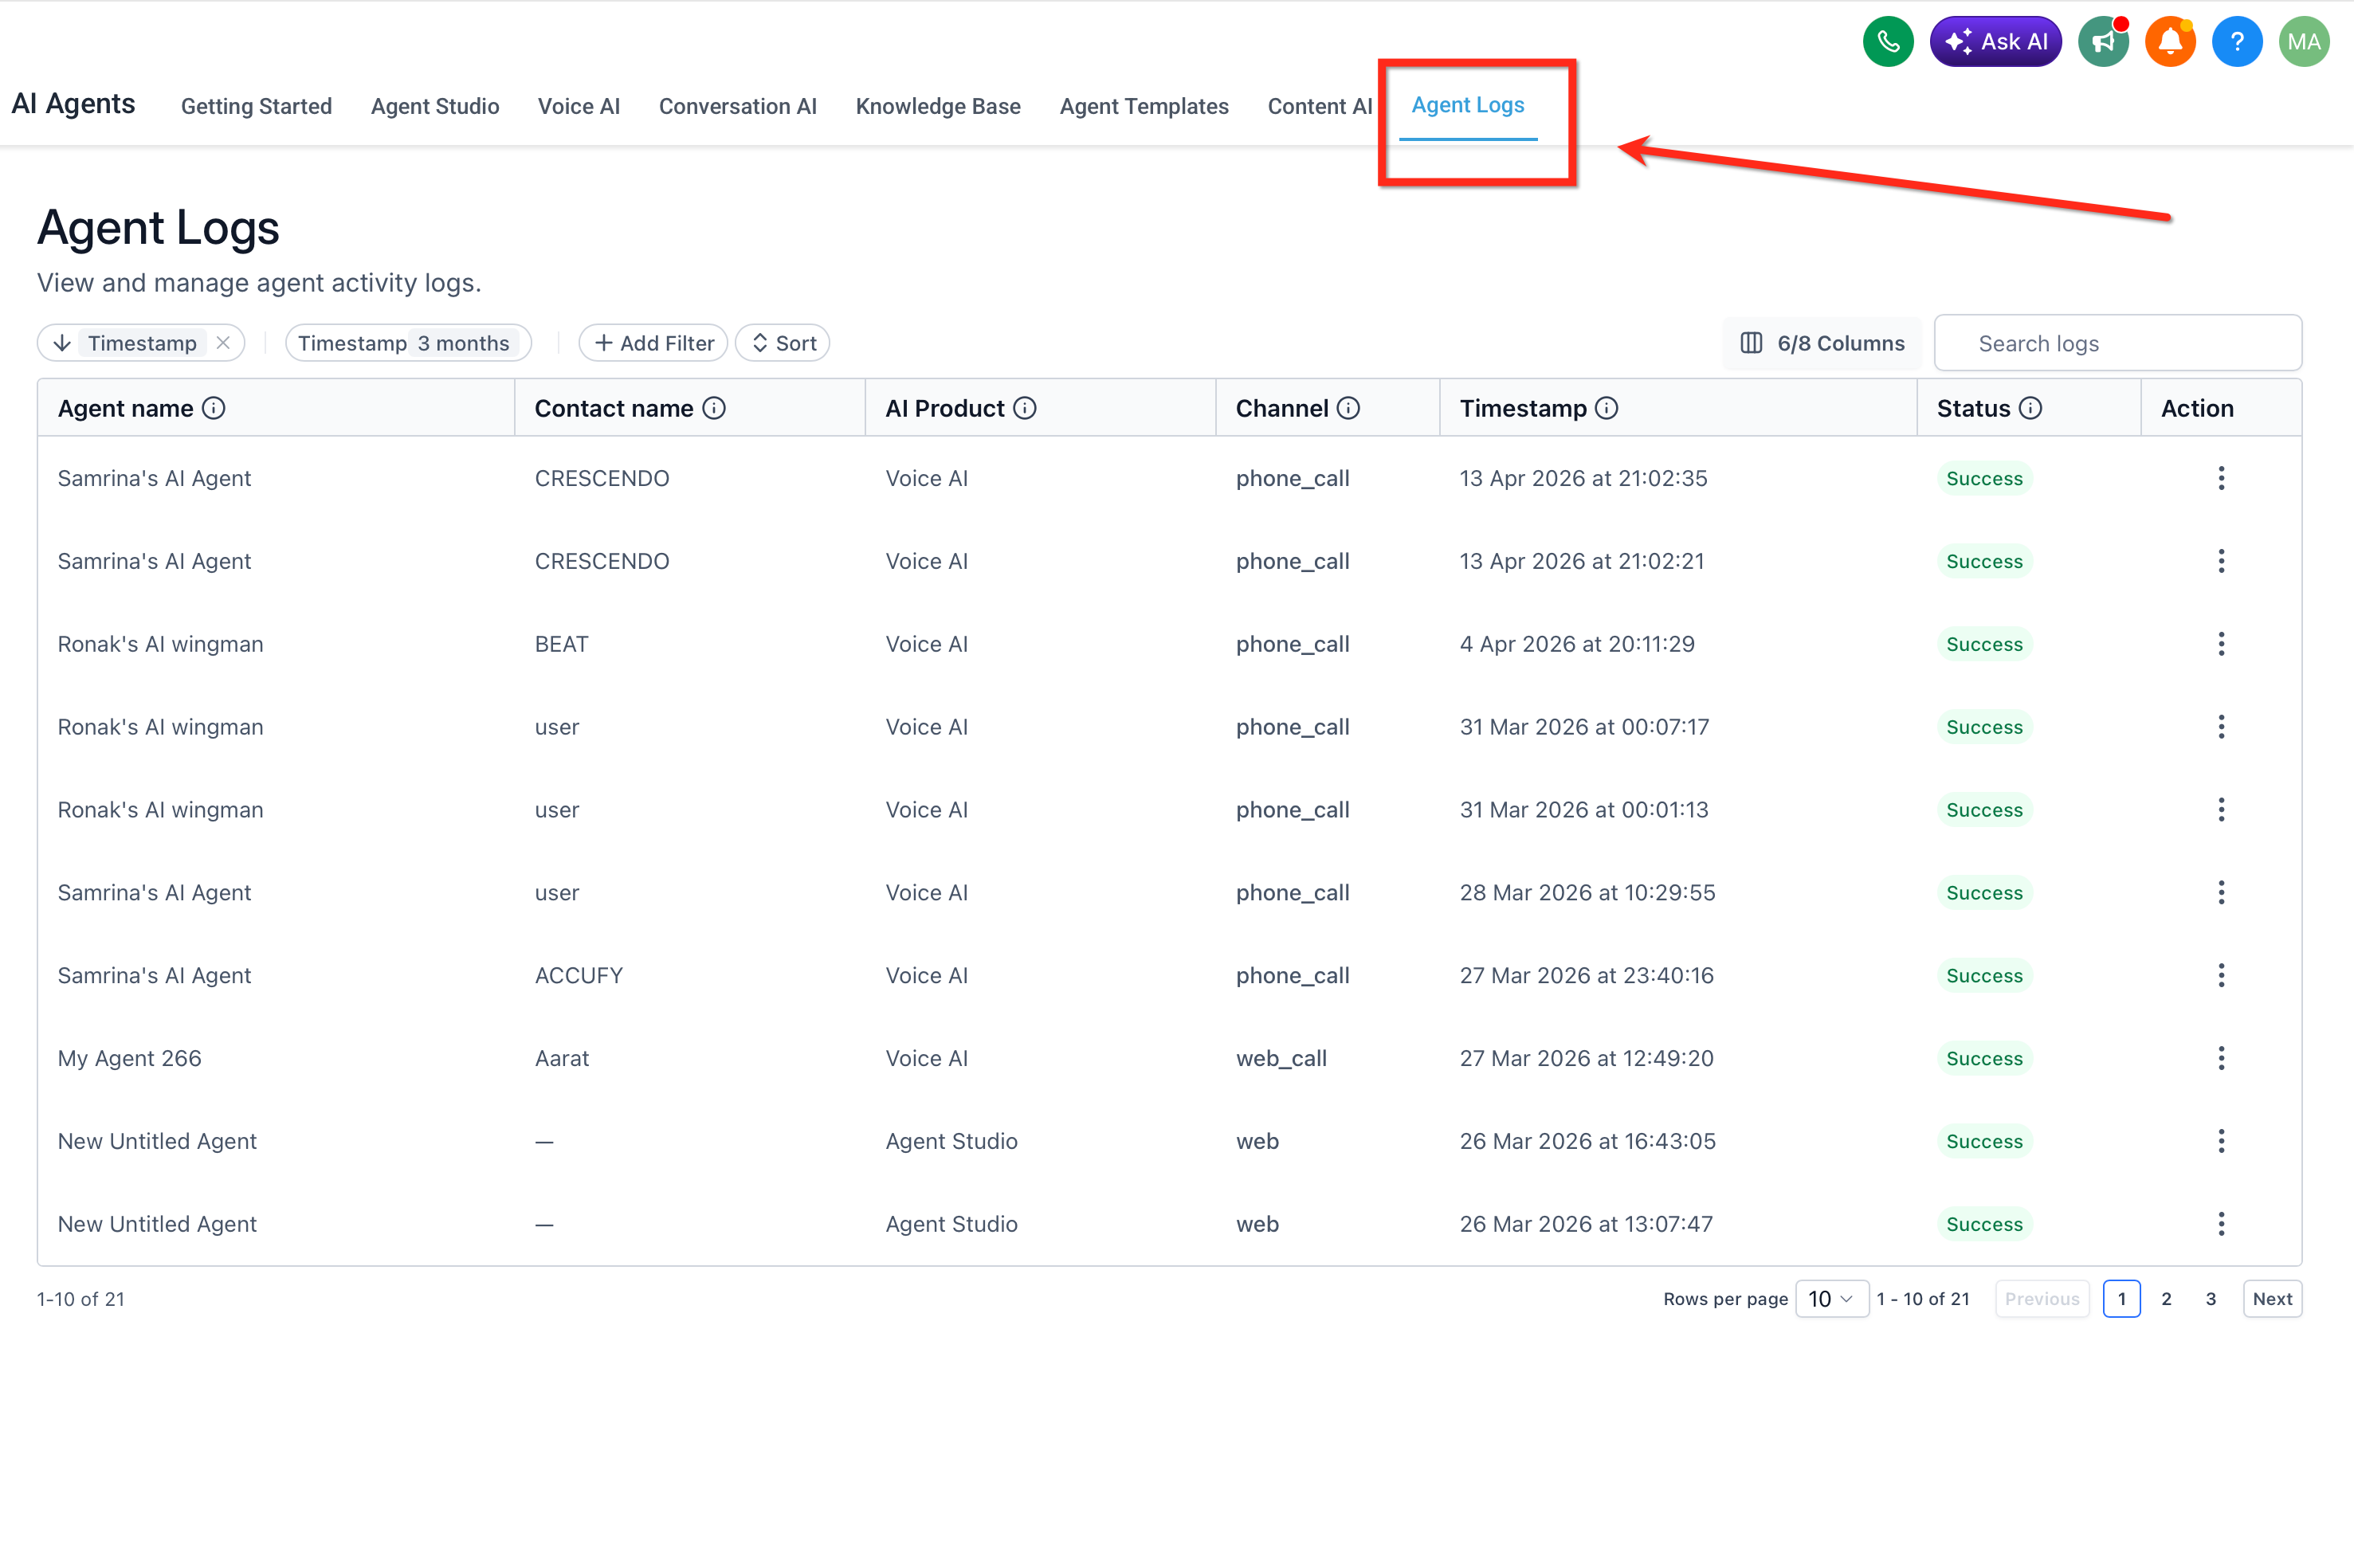
Item or action | Description |
|---|---|
Timestamp | When the interaction took place |
Agent name | Which agent handled it |
Agent ID | The agent's unique ID |
AI product | Which AI product the activity belongs to |
Channel | Where the interaction happened |
Status | The result or state of the interaction |
Filter by product | Narrow to one AI product |
Filter by agent name | Focus on one agent |
Search by contact | Find interactions tied to a contact |
Sort results | Reorder to find the most relevant interactions |
You can also filter by Channel and Status.
Select an interaction to read the conversation next to its execution timeline. This shows why the agent replied as it did, where a decision changed, and when a tool was used. The timeline shows the ordered path from the first message to the final response. In some Agent Studio runs the timeline includes a task checklist for multi-step work: tasks have descriptive labels instead of numbers, and the display shows which task is active and which are done, which makes progress clearer when the agent adds tasks or changes its plan mid-run.
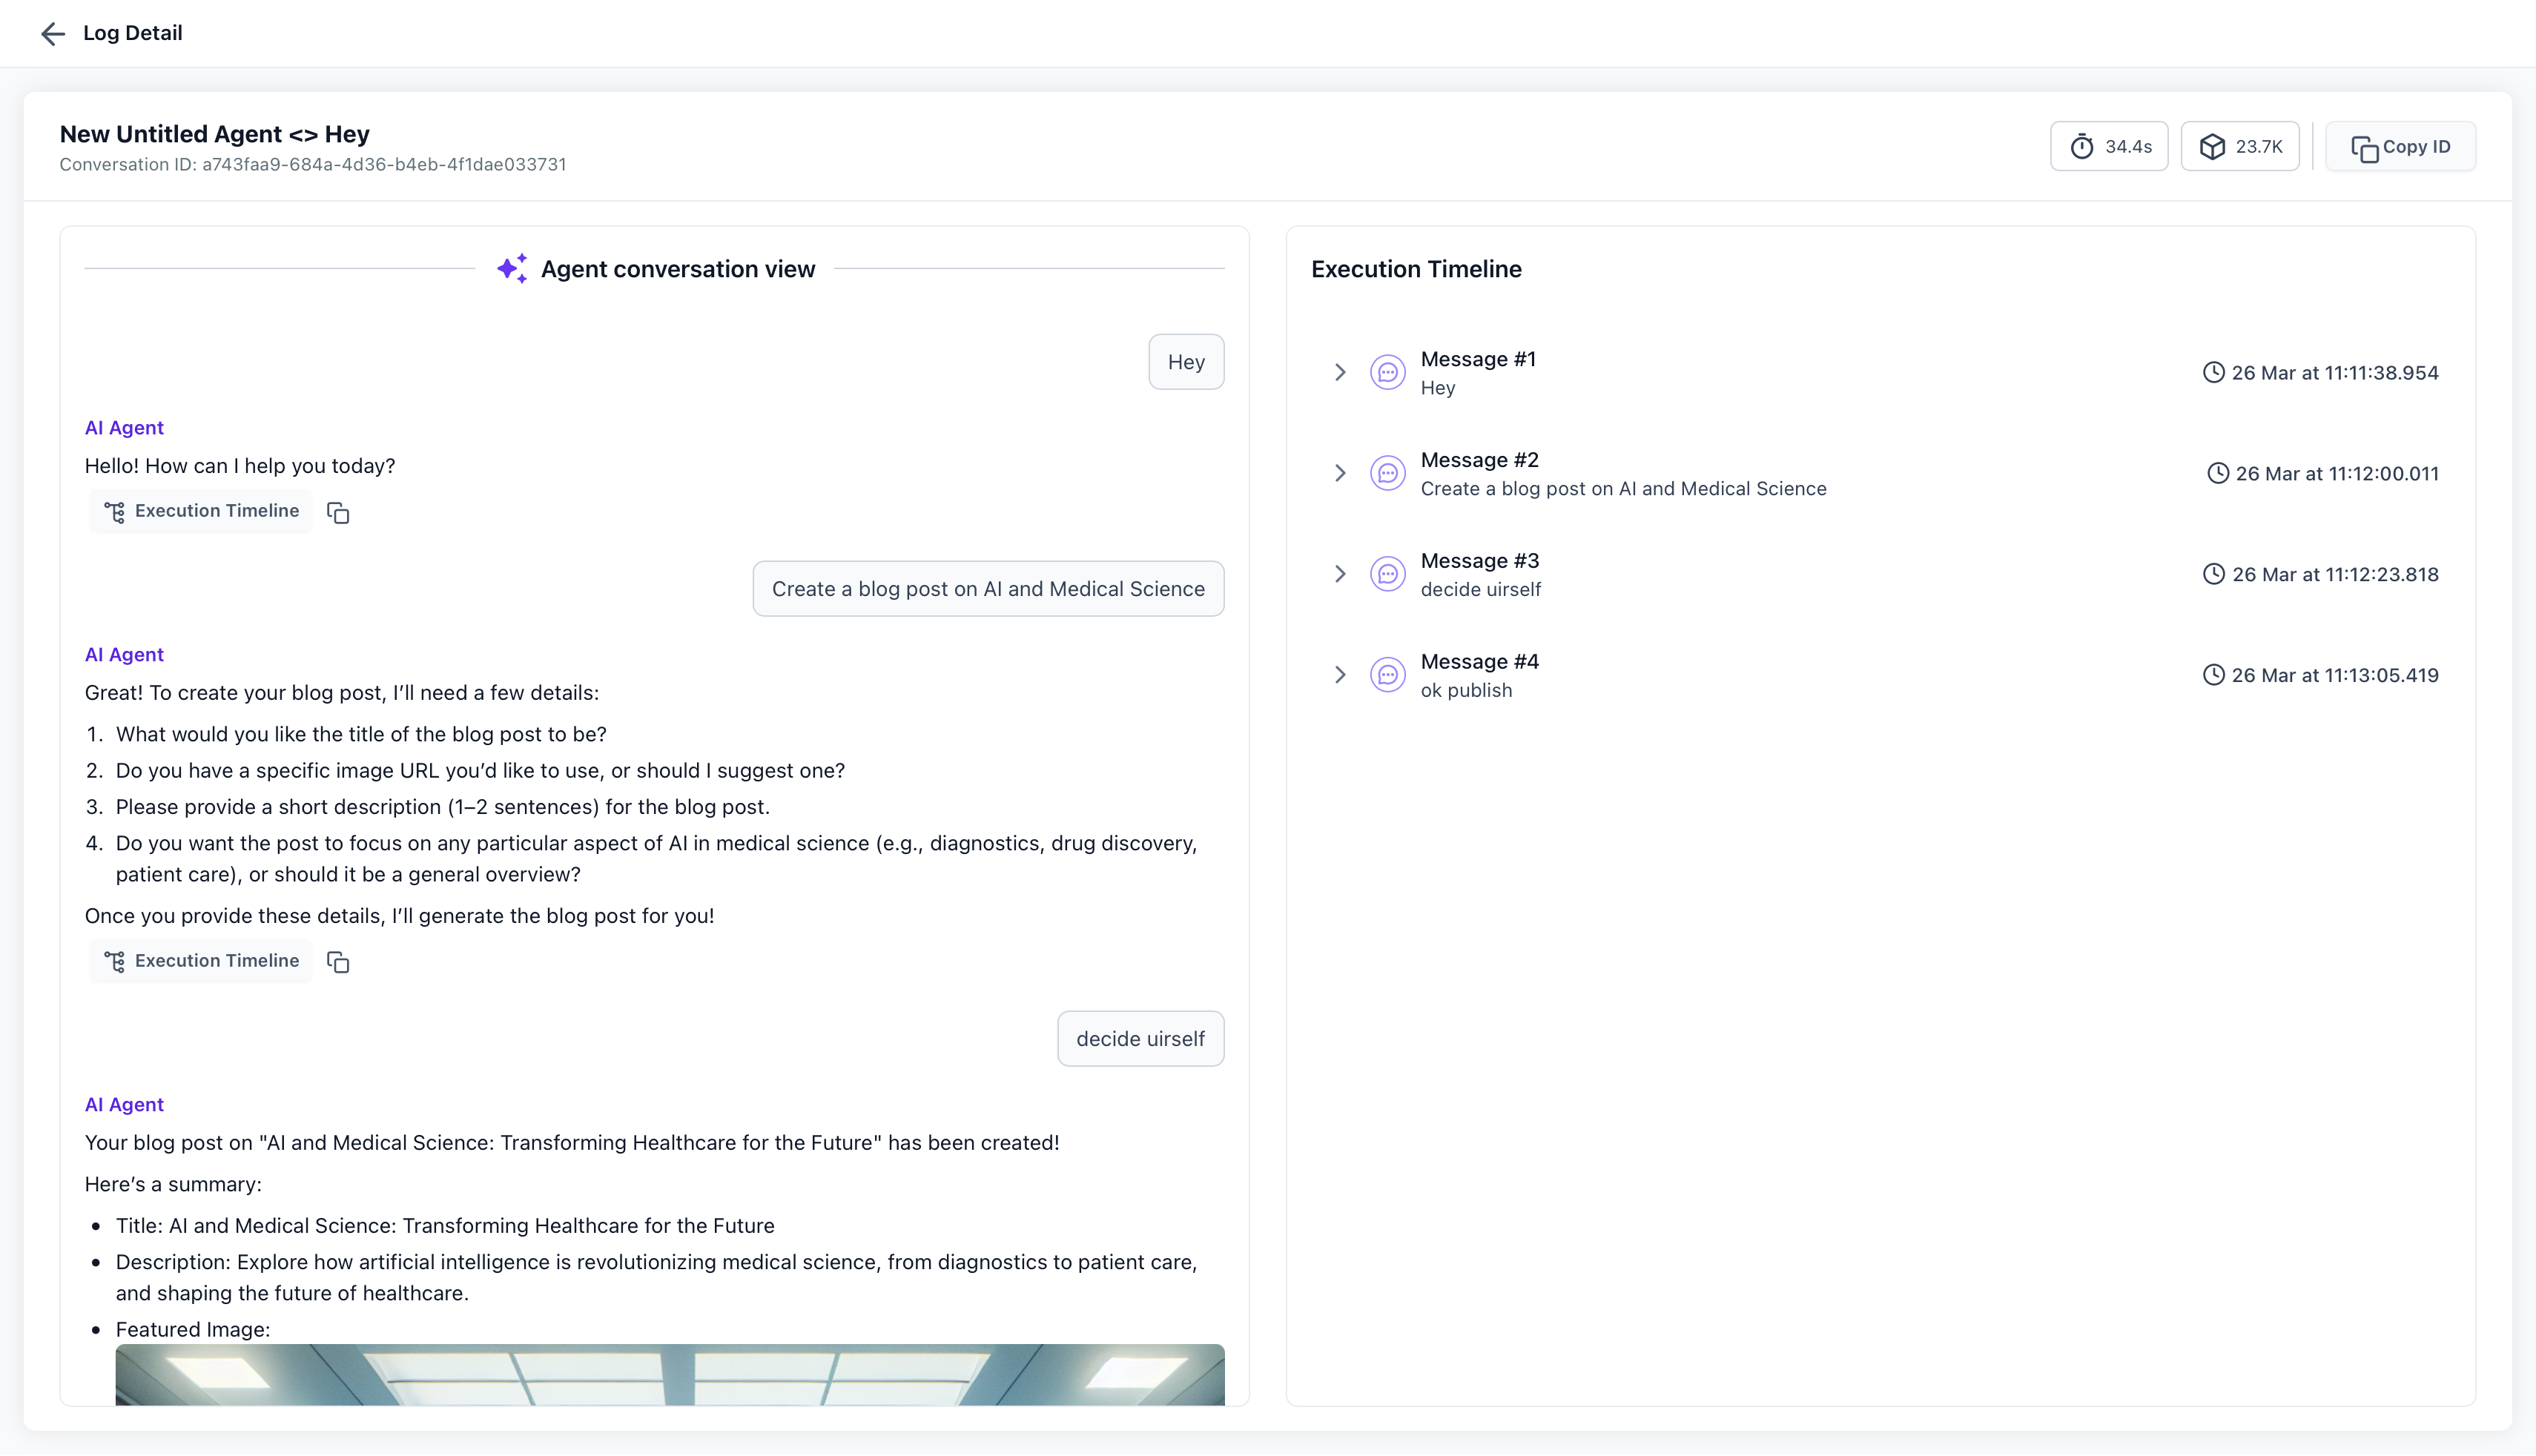
Header controls on the log detail page:
Identify the AI product. The header names the product, such as Conversational AI or Voice AI.
Jump to a business action. Completed actions, such as appointment bookings, SMS messages and contact updates, appear in the header. Open a log from AI Agents > Agent Logs, select the action, and the page jumps to that part of the conversation and opens the matching execution step.
Switch sessions. Select the session navigation control, pick another session in the side panel, and its log opens without returning to the list.
Search within a log. Select the search icon, enter a keyword, tool name or other term, review results and select one to jump to it. Search covers conversation messages, execution timeline steps, and Inspect details (input, output and metadata). A match in the timeline or Inspect view opens that step.
Select a step in the timeline to see the model used, latency and timing, timestamps, input and output for that step, prompt details where applicable, and other technical metadata. Output can be shown as raw JSON-style or as a more readable parsed view, and can be copied as JSON for troubleshooting or sharing. Multi-step runs can show structured task details with labeled tasks and explicit transitions so you can confirm task order, completion state and where progress changed.
Open AI Agents > Agent Logs.
Review the activity list and narrow it with Agent Name, AI Product, Channel or Status.
Open the interaction to see the conversation and timeline.
Select a message or step to inspect its input, output, timing and other details.
To investigate a completed action, select it in the header.
To find specific information, use the header search.
To review another session, open the session panel from the header.
After reviewing, change your agent, test again and check the updated activity.
The Metrics tab in Agent Logs turns log data into a dashboard of widgets, filters and saved layouts, so you can watch volume, performance and trends across agents instead of reviewing one session at a time. Use it to spot trends and then open Sessions for the detail behind a number.
Three default layouts are in the layout dropdown. They carry a Default label and cannot be edited or deleted.
Conversational AI: chat volume, human handovers, follow-ups and busiest hours.
Voice AI: call volume, call outcomes, sentiment and reasons calls end.
Managed Agents: conversations handled, contacts reached and agent response times.
To customize, create your own layout. You can rename, rearrange, edit and delete layouts you create.
When you add a layout, choose Start with a template (a predefined set of widgets you can remove, rearrange and add to before saving) or Start from scratch (an empty canvas).
Use Add Widget on a custom layout. You can browse categories, search, and filter by widget type (numbers, charts and tables).
Pre-built widgets: existing metrics and visualizations.
Custom metrics: choose Create new metric, give it a title, choose a line, bar, pie, donut, heatmap or table visualization, select the metric, filter by agent, channel, AI product or tool, configure supported breakdowns and time intervals, and preview before adding it.
In Edit Layout you can add or remove widgets, drag to rearrange, resize, and save changes. You can keep several layouts and switch between them.
Metric | Description |
|---|---|
Conversations Handled | Total AI conversations processed in the selected time range |
AI Messages | Total messages generated by AI agents |
Average Messages per Conversation | Average number of messages exchanged per conversation |
Avg Response Time | Average time an AI agent takes to respond |
Top Agents | Agents with the highest activity in the range |
Top Actions | Most frequently used actions and their average execution latency |
Busiest Hours | Times of day with the most conversation activity |
Channel Activity | How activity changes across supported channels over time |
Open AI Agents > Agent Logs and select the Metrics tab.
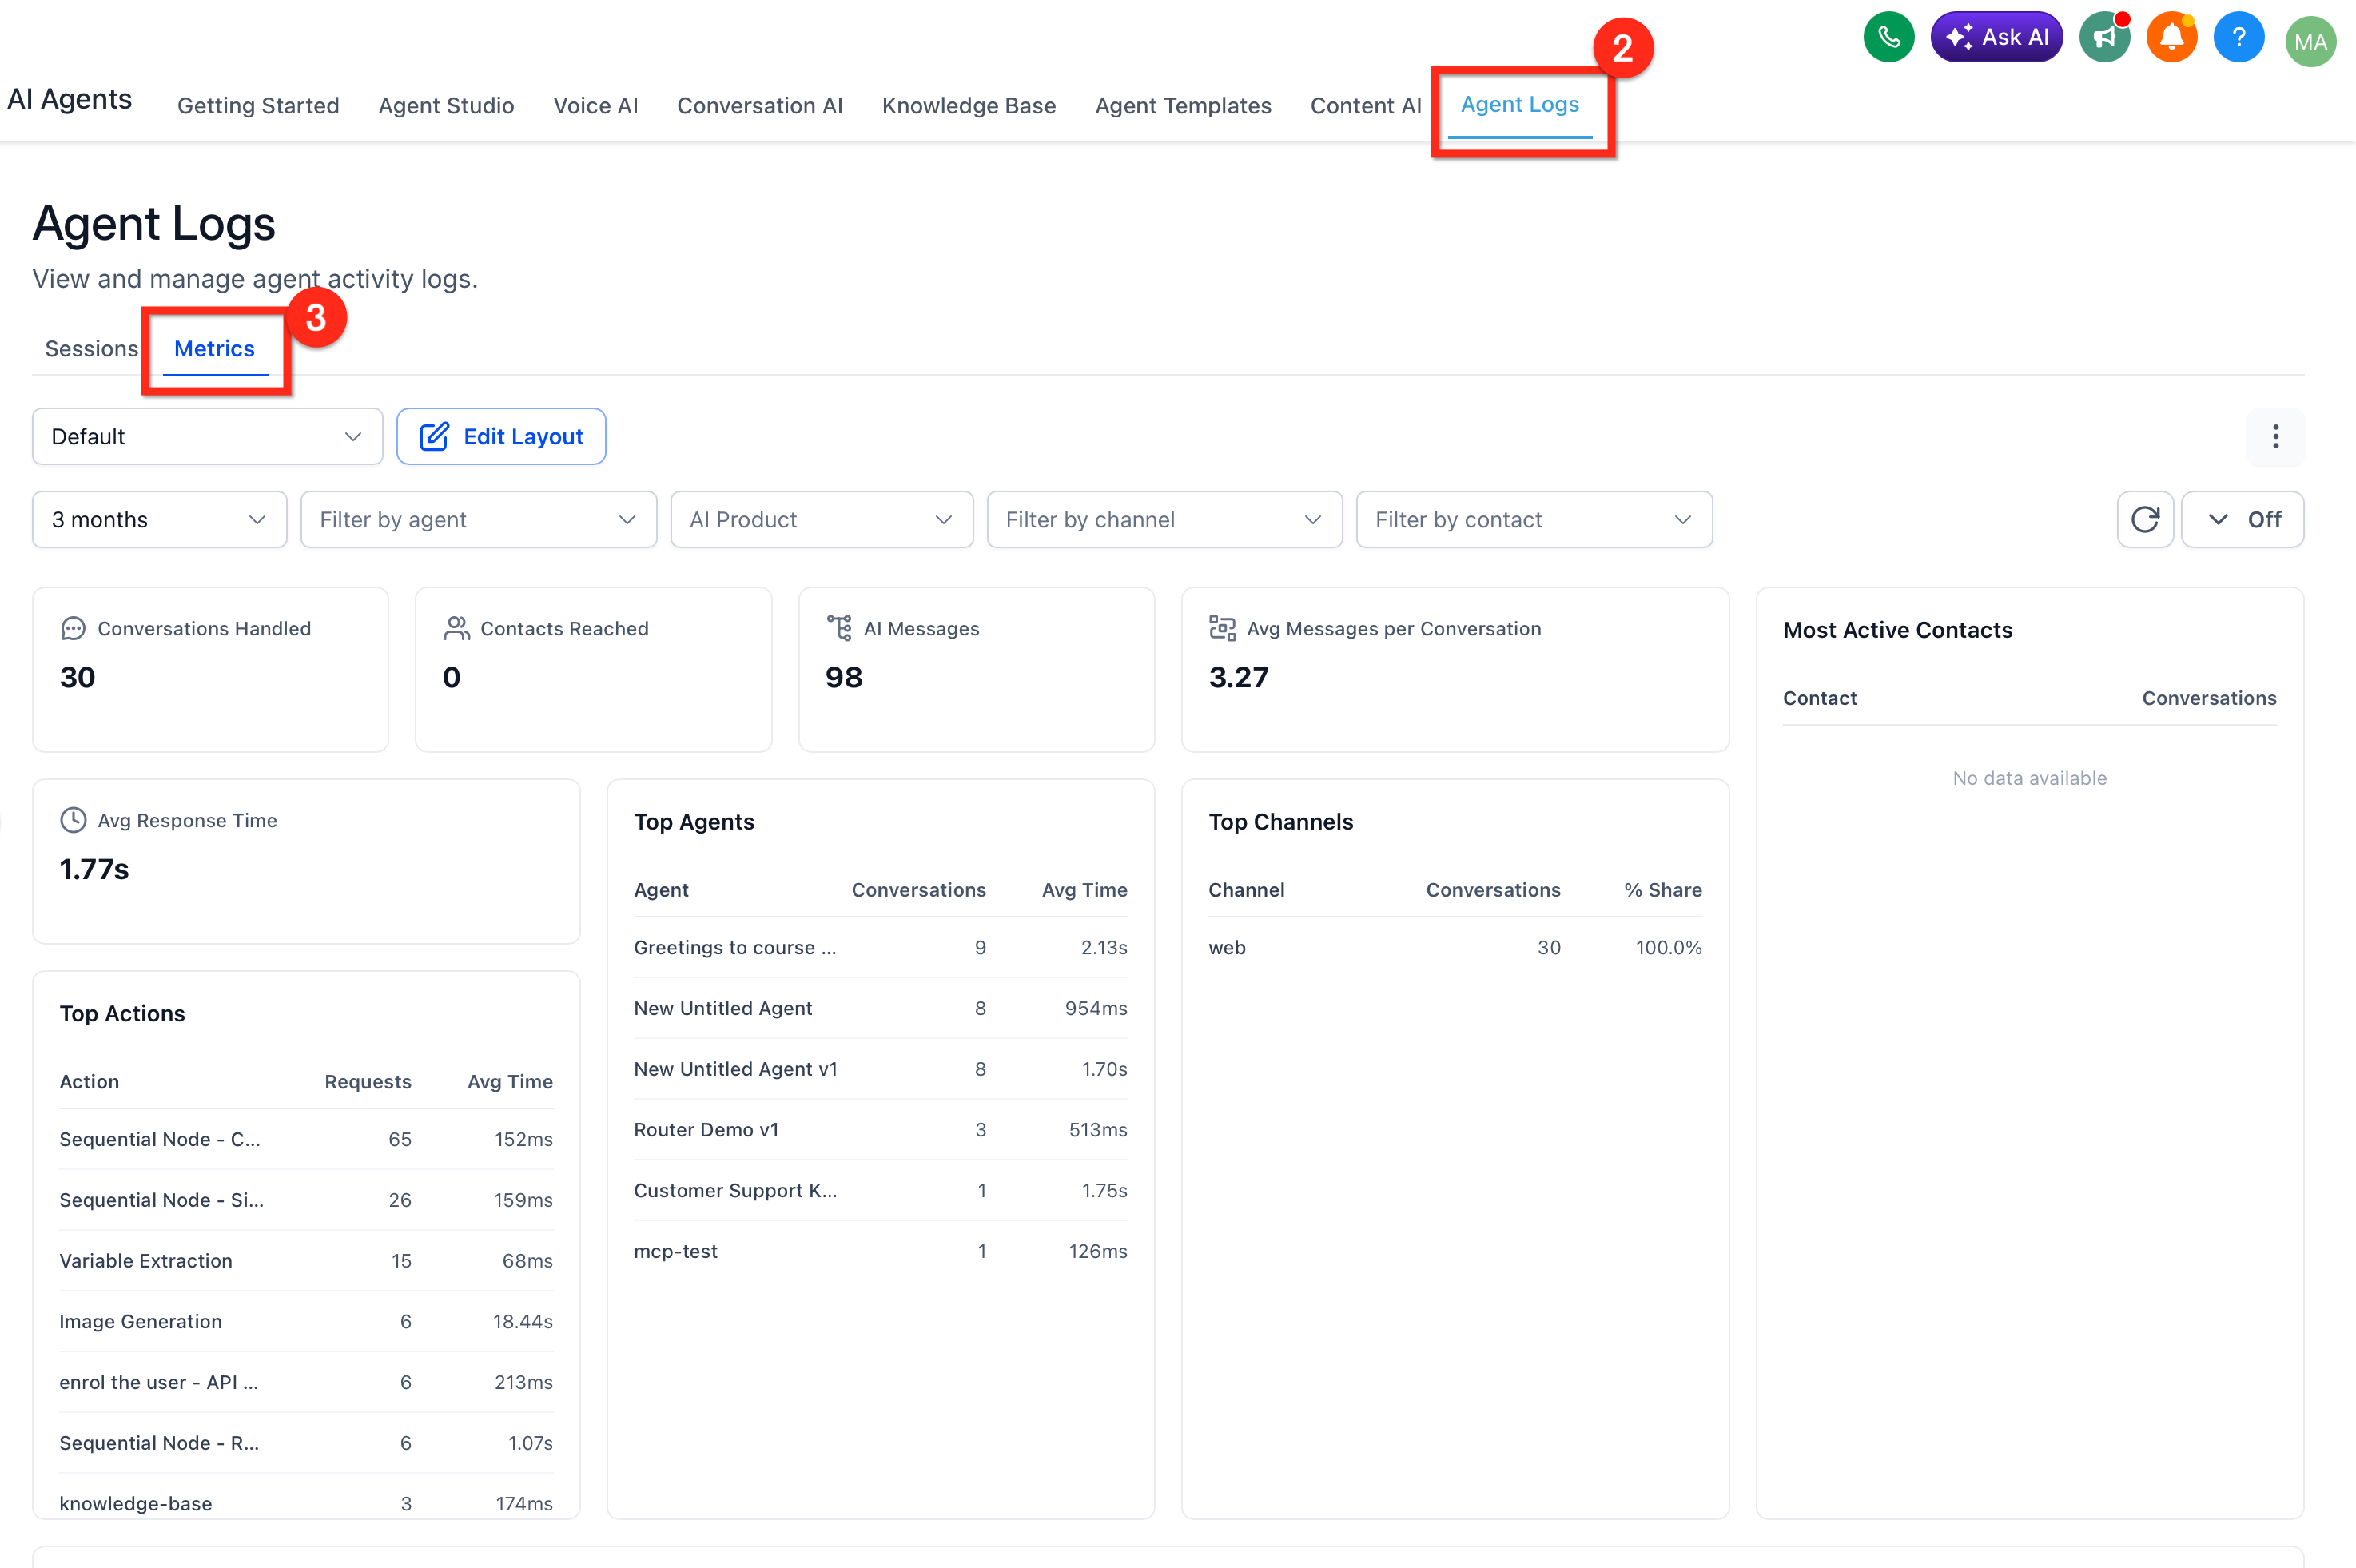
Set filters: Time Range, Agents, AI Products, Channels and Contacts.
Open the layout dropdown and select Add Layout (template or from scratch), or pick an existing layout.
Use Edit Layout to add widgets, remove widgets, drag and resize, then save changes.
For live monitoring, set auto-refresh to 30 seconds, 1 minute, 5 minutes or 15 minutes, or click the refresh icon.
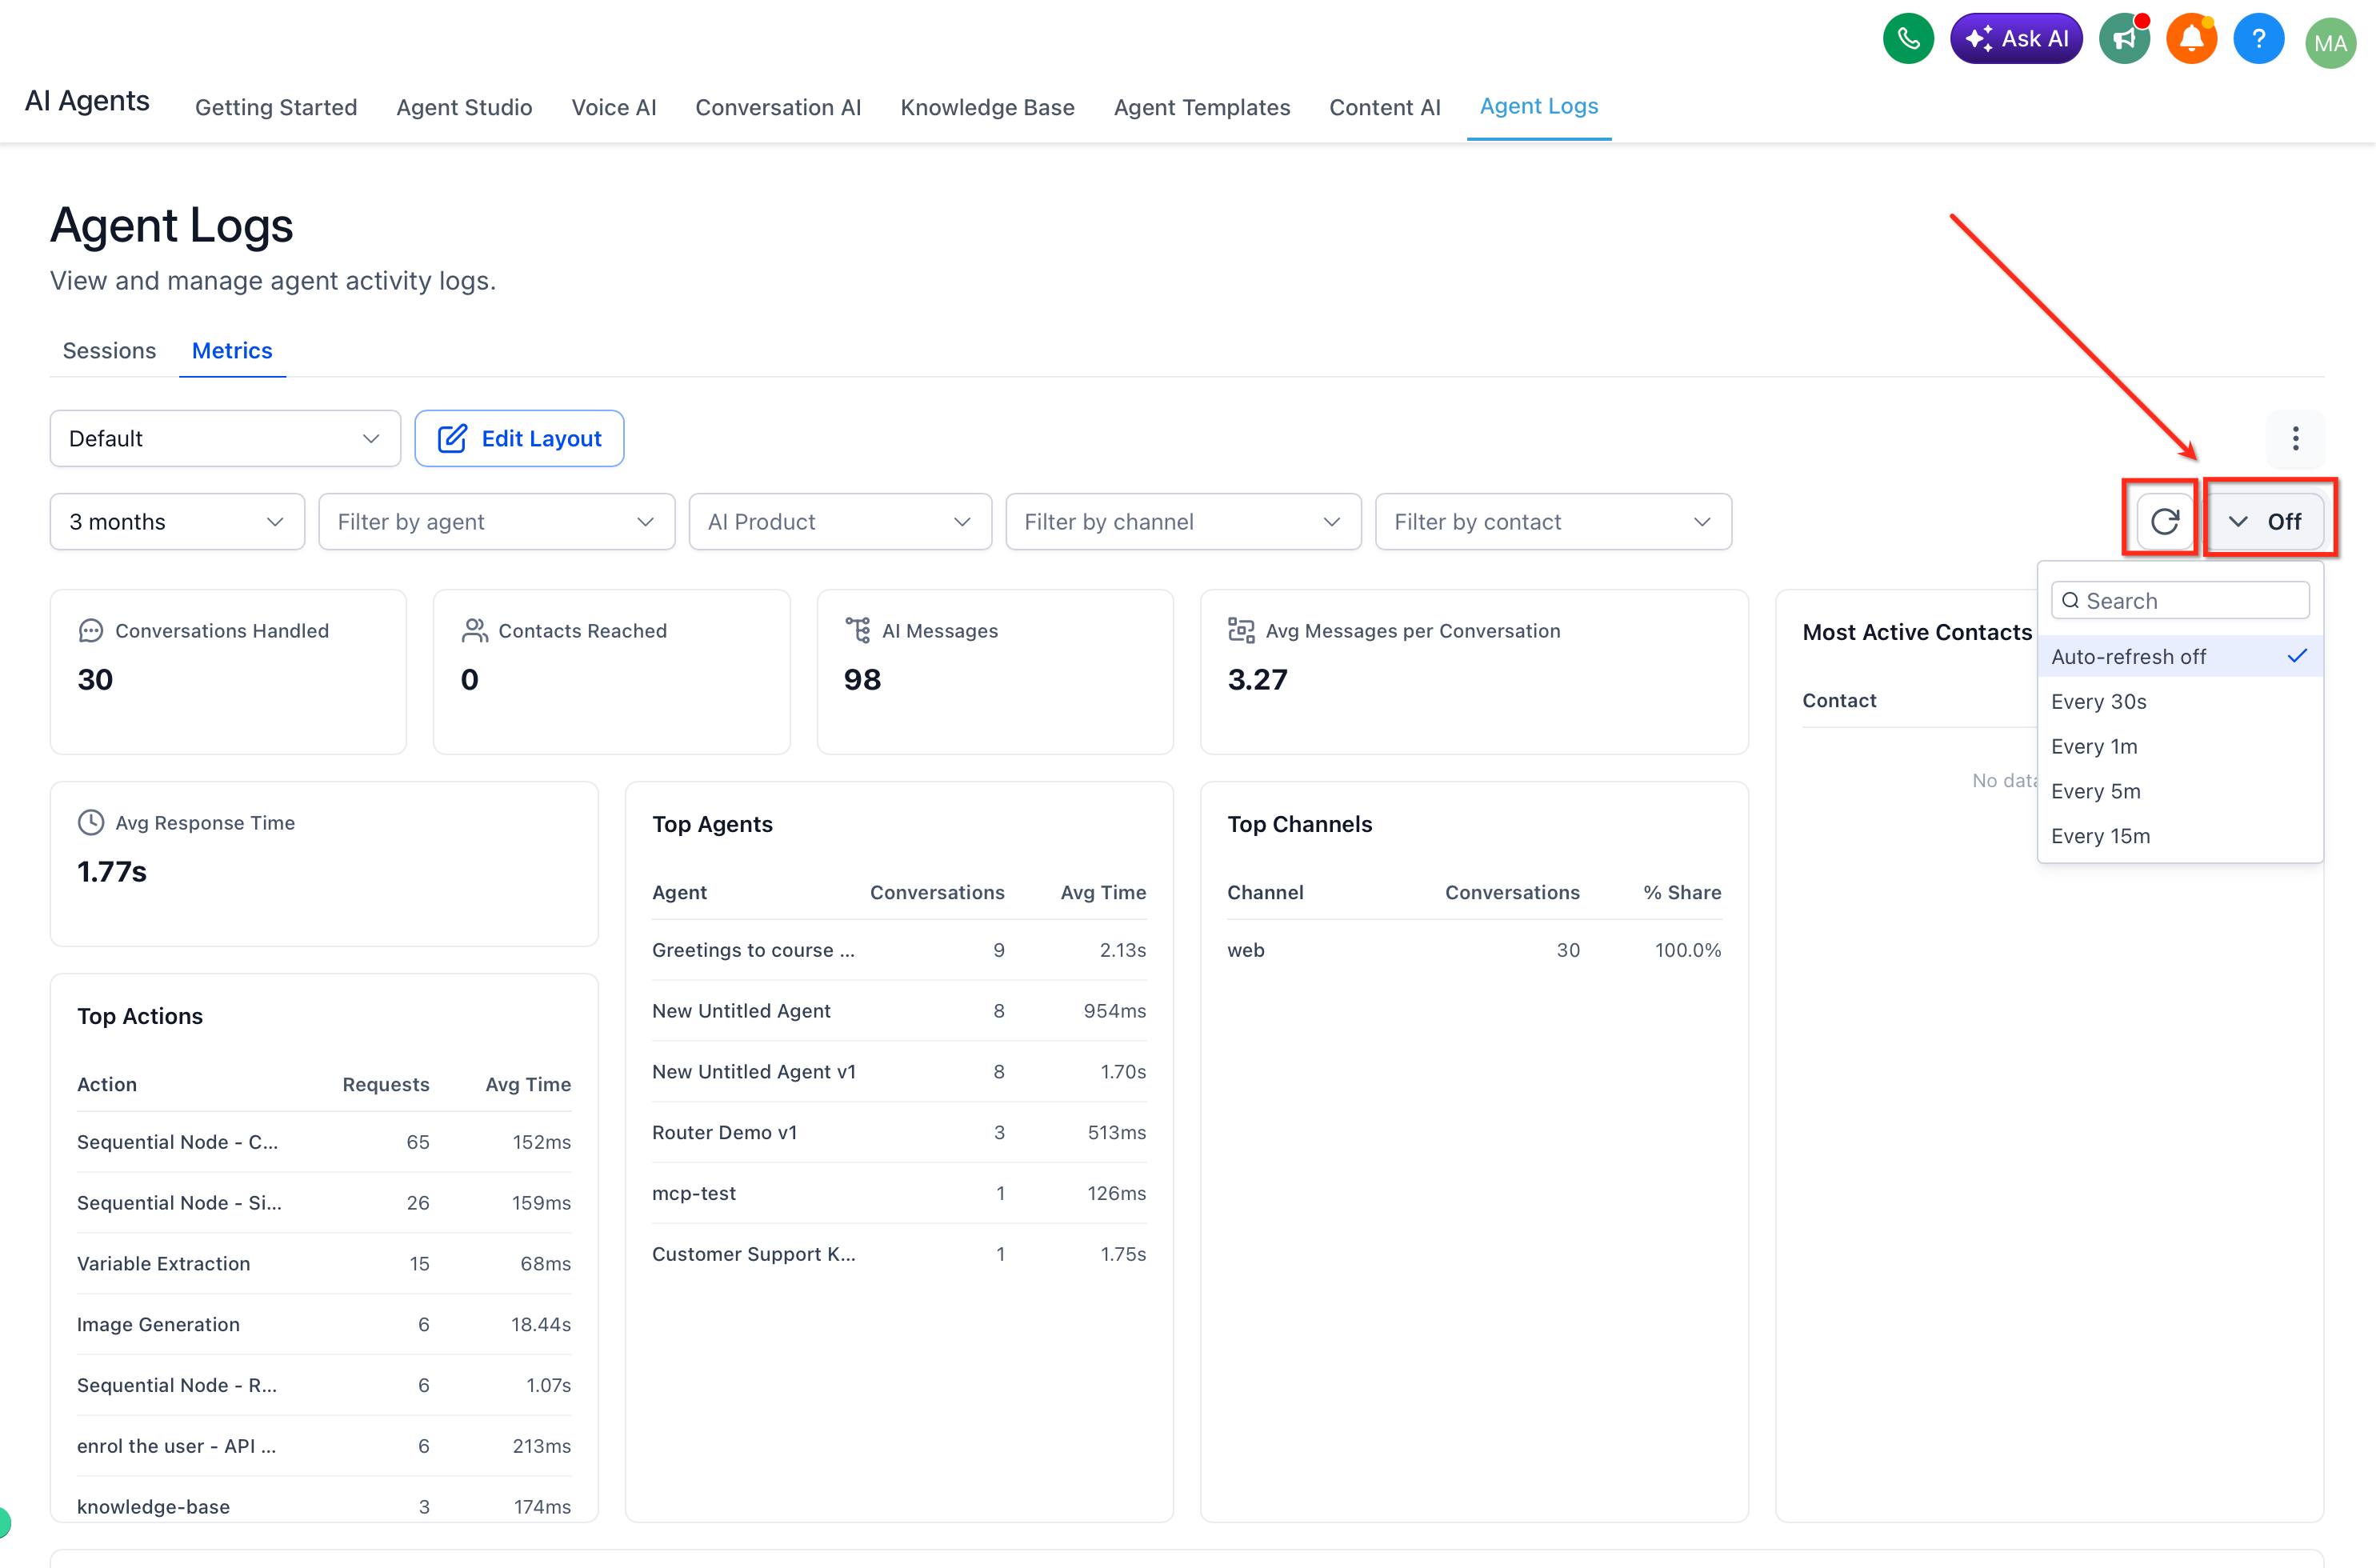
When a trend needs a closer look, open Agent Logs > Sessions to read the conversations behind it.
A Monitor tracks recorded AI agent activity against a target over a time window and tells you whether you are on pace. Unlike Metrics, which shows history and trends, a monitor evaluates one goal with a scheduled daily check. Example: 50 appointments booked in 30 days, counting only Conversational AI activity, checked daily at 9:00 AM. Remember that AI appointment booking works only with native Aesthetix CRM calendars, not EMR calendars, so appointment monitors only reflect bookings the AI makes on native calendars.
Monitors can track:
Appointment activity: appointments booked, rescheduled and canceled.
Conversation activity: conversations handled, conversation volume and contacts reached.
Call activity: calls completed and supported Voice AI call metrics.
Automation activity: workflows triggered, SMS sent and bot transfers.
Knowledge base activity: knowledge base lookups.
Performance rates: success rate, booking conversion and supported voice call rates.
Select AI Agents in the left menu.
Select Agent Logs from the top navigation.
Click the Monitor tab.
Select Dashboard to see your monitors.
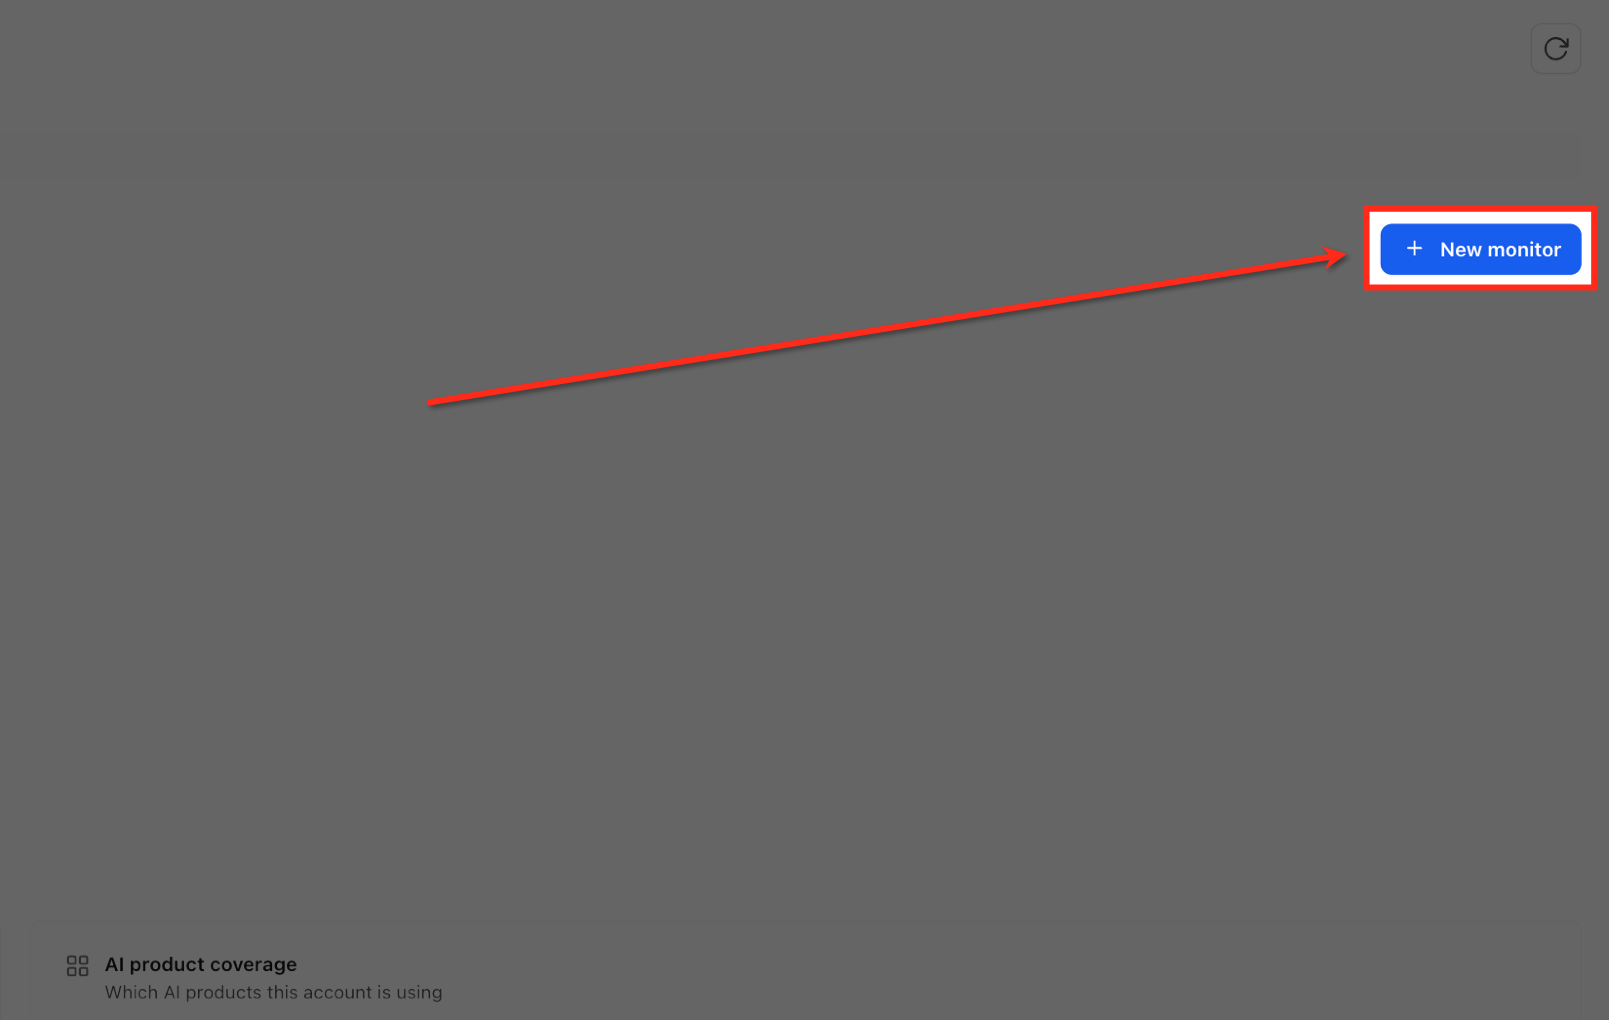
From Monitor > Dashboard, select New Monitor.
In the New monitor form, select the metric.
Review the comparison type for that metric. Depending on the metric it can be Reach a number (progress toward a target count), Stay under a cap (keep the count below a limit) or Percentage target (performance against a target rate).
In Number to watch, enter the target value or percentage.
Under Time window, choose 7, 14, 30, 60 or 90 days, or Custom. Choose the Start date (today or a future date); the end date is calculated. Only activity inside the window counts toward progress. Select Repeat this monitor to start a new window of the same length automatically after each one ends, with completed windows kept in history.
Under Applies to, choose All products or select products: Conversational AI, Voice AI, Agent Studio, Managed Agent.
Under Daily check at, choose the time and Timezone. The monitor evaluates once a day at that time; opening the page does not run another check.
Under Notify me when, choose events: Status becomes at risk, Goal reached, Tracking window ends, Daily progress email (sent at the check time or another time you choose).
Select the email or webhook channels that should receive updates.
Review the Preview panel (metric, comparison, target, dates, products, check time, notifications and channels) and click Create monitor.
A monitor with a future start date shows as scheduled until that date. If you create a new monitor for a metric that already has one, the new one becomes the active version and the old one stays in History.
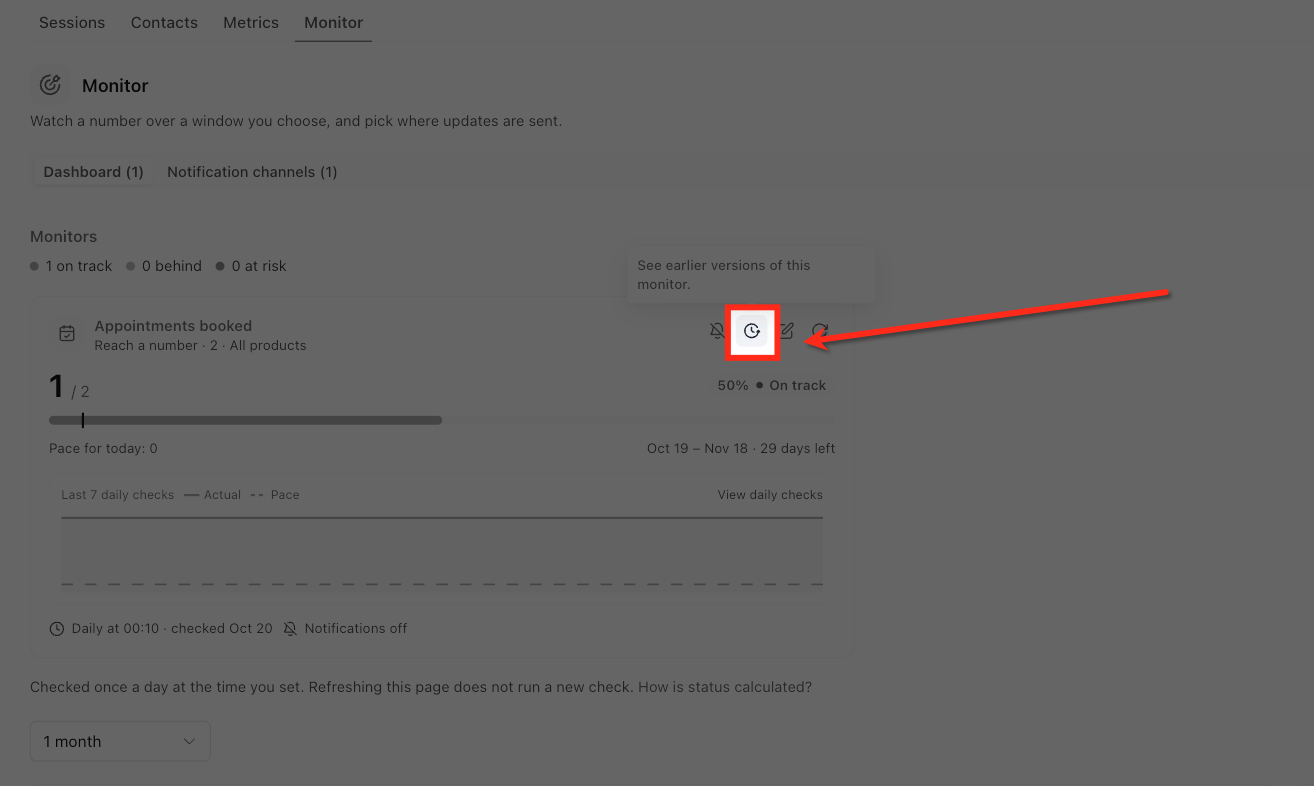
Monitor cards show saved evaluation results rather than running a new evaluation on each visit. A card shows the metric, goal, current value, progress percentage, status, pace for today, tracking window with time remaining, the daily check schedule and last check time, and Last 7 daily checks.
Status | Meaning |
|---|---|
On track | For a reach-a-number goal, progress is at or above the expected steady pace for today |
Behind | Progress is below expected pace but within 15% of it |
At risk | More than 15% below pace, over a configured limit, or below an applicable rate target |
Achieved | The goal has been reached |
Under the number | The measured value is below the number for a limit-based comparison |
Scheduled | The window has not started |
Missed | The window ended without meeting the goal |
Count-based goals use expected pacing. Cap-based and rate-based goals use their configured thresholds.
To see recent checks, click View daily checks under Last 7 daily checks. The chart has an Actual line (solid blue, the measured value at each saved check) and an Expected pace line (dotted). The table lists Checked (date and time), Value and Change (difference from the previous check, such as First check or No change). It shows the last seven saved checks, including manual ones.
Edit: click the pencil icon on the card to change comparison type and target, window and repeat, products, check time and timezone, and notification events and channels. Review the preview and click Save changes. Earlier versions stay in History.
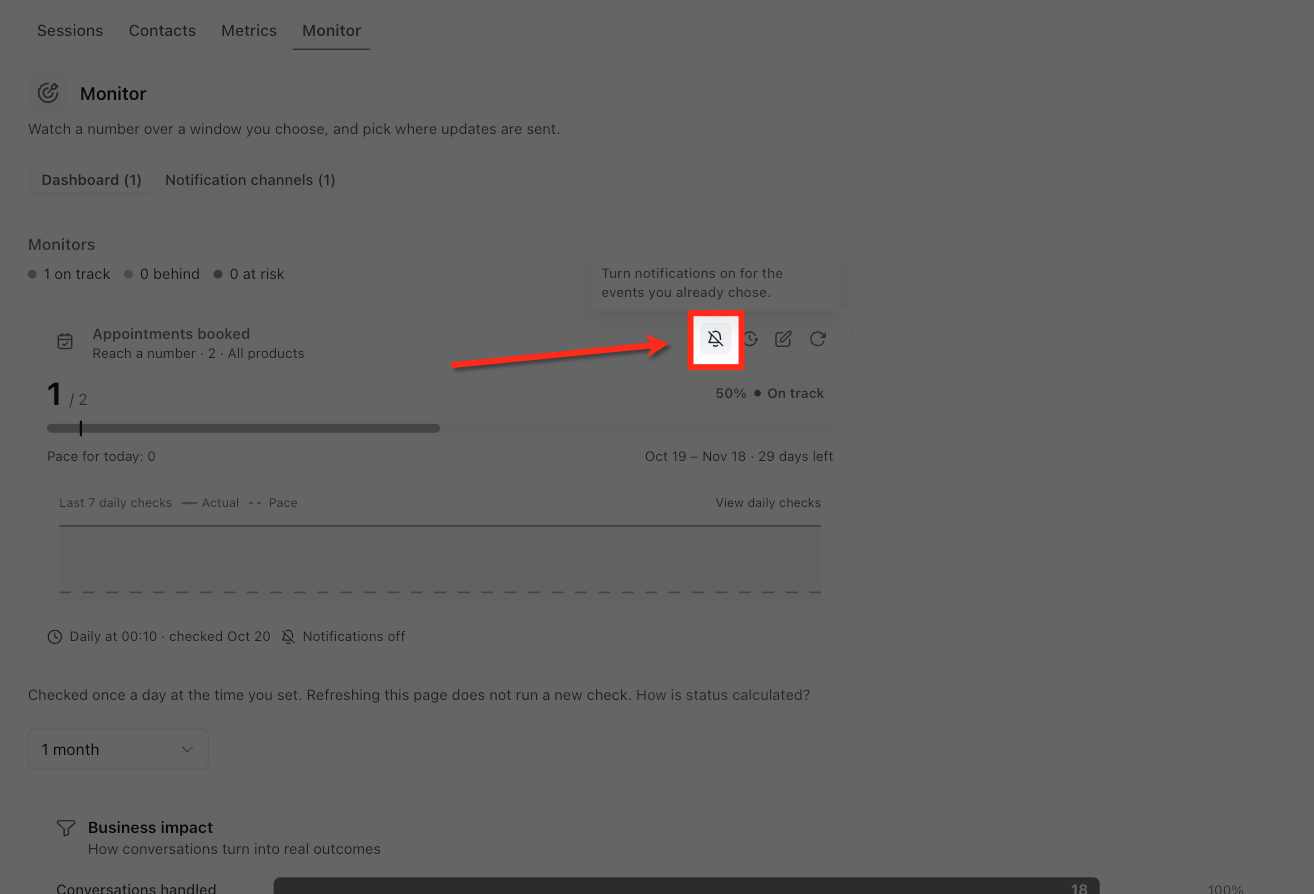
Notifications on or off: click the bell icon on the card. Turning them off stops email and webhook notifications but keeps your configured events, and daily checks still run.
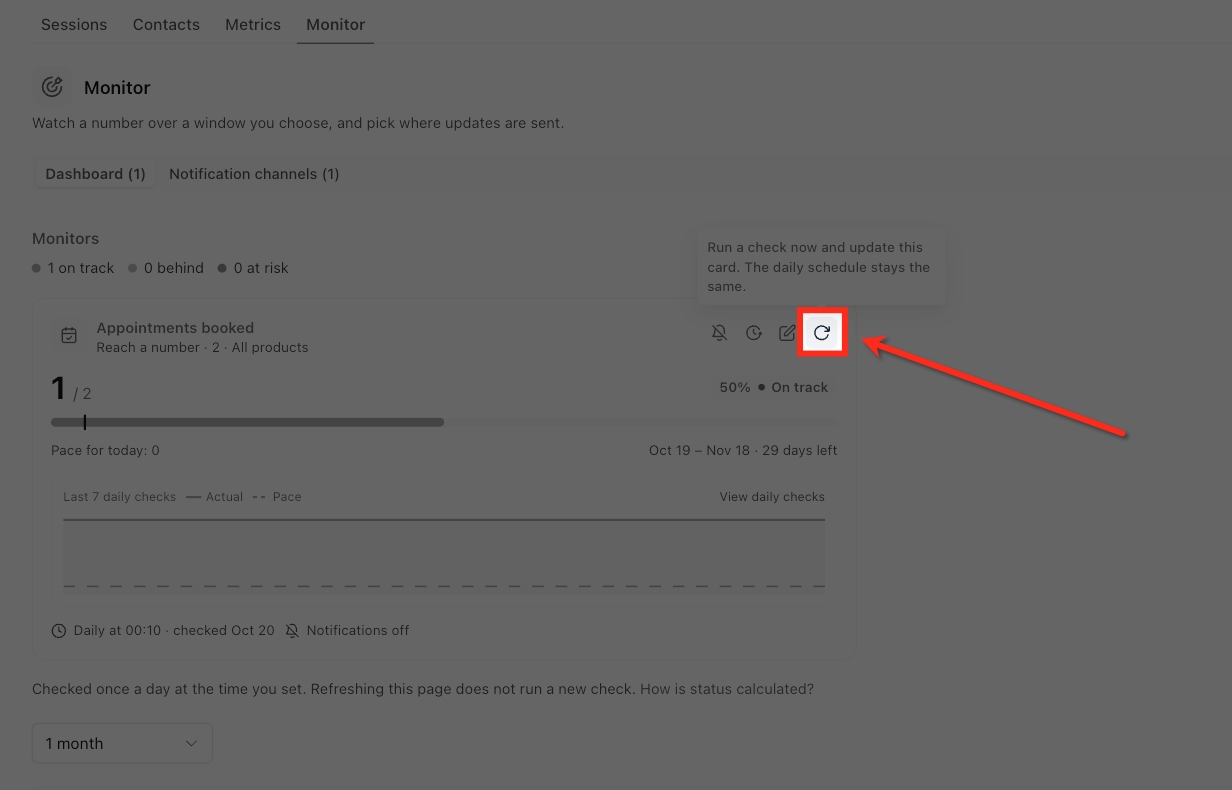
Manual check: click the Refresh icon. This updates the saved result without changing the daily schedule and can appear in the check history.
History and versions: click the History icon. ACTIVE NOW shows the current version with goal, progress, status, dates and products. OTHER VERSIONS shows earlier configurations and outcomes. Click Make active on an eligible version to switch; only one version of a metric is active at a time and nothing is deleted. Completed versions can show Restart.
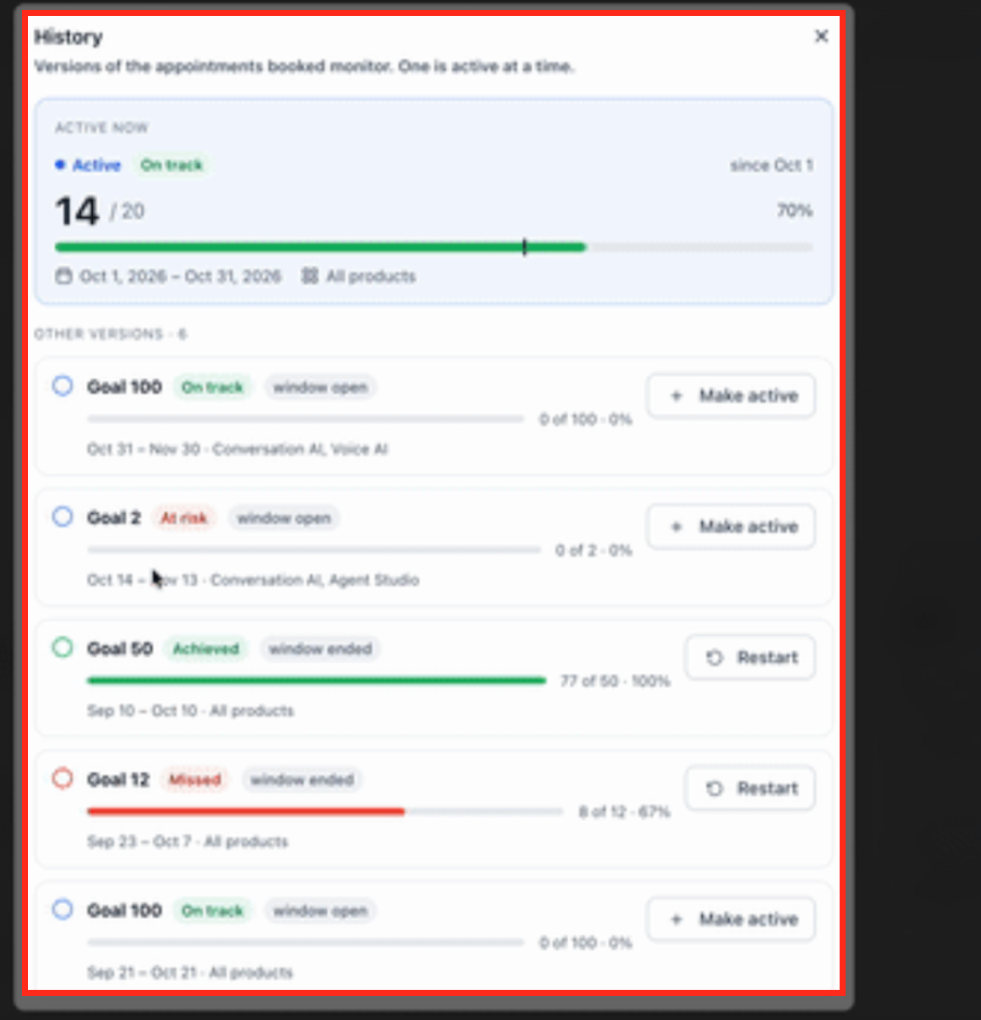
Repeat: edit the monitor, enable Repeat this monitor under Time window, and save.
Finished monitors: when a non-repeating window ends, the completed card shows the outcome (achieved or missed) and dates, with Start new and Dismiss actions.
If a monitor recovers and later becomes at risk again, another at-risk notification is sent when that event is enabled. Daily progress emails continue through the last day of the window.
Channels define where monitor updates go. Create a channel once and reuse it across monitors. Open Notification channels in the Monitor area.
Select Notification channels and click Email.
Enter a descriptive Channel name.
Under Email recipients, enter an address and click Add. Repeat for more.
Click Add channel.
Do not send PHI to notification recipients. Monitor messages contain counts and status, not patient details.
Select Notification channels and click Webhook.
Enter a descriptive Channel name.
Enter the Endpoint URL.
Select the HTTP method (the interface shows POST).
To add request headers, click Add header. Mark a header as secret when its value is sensitive.
Review Expected payload to see the data structure.
Optionally click Send test under Test delivery.
Click Add channel.
Each channel card shows its type (EMAIL or WEBHOOK) and monitor usage. Use the toggle to enable or disable a channel, and edit or delete channels you no longer need. The tab count includes channels marked Not in use; it is not a count of active alerts. One channel can be assigned to several monitors.
The AI Usage page shows how much AI your account has used and what your plan allows. Find it at AI Agents > AI Usage. The page is currently in Labs, so it may not be enabled on every account yet, and it is visible to account administrators. Other users still see usage banners on AI product pages.
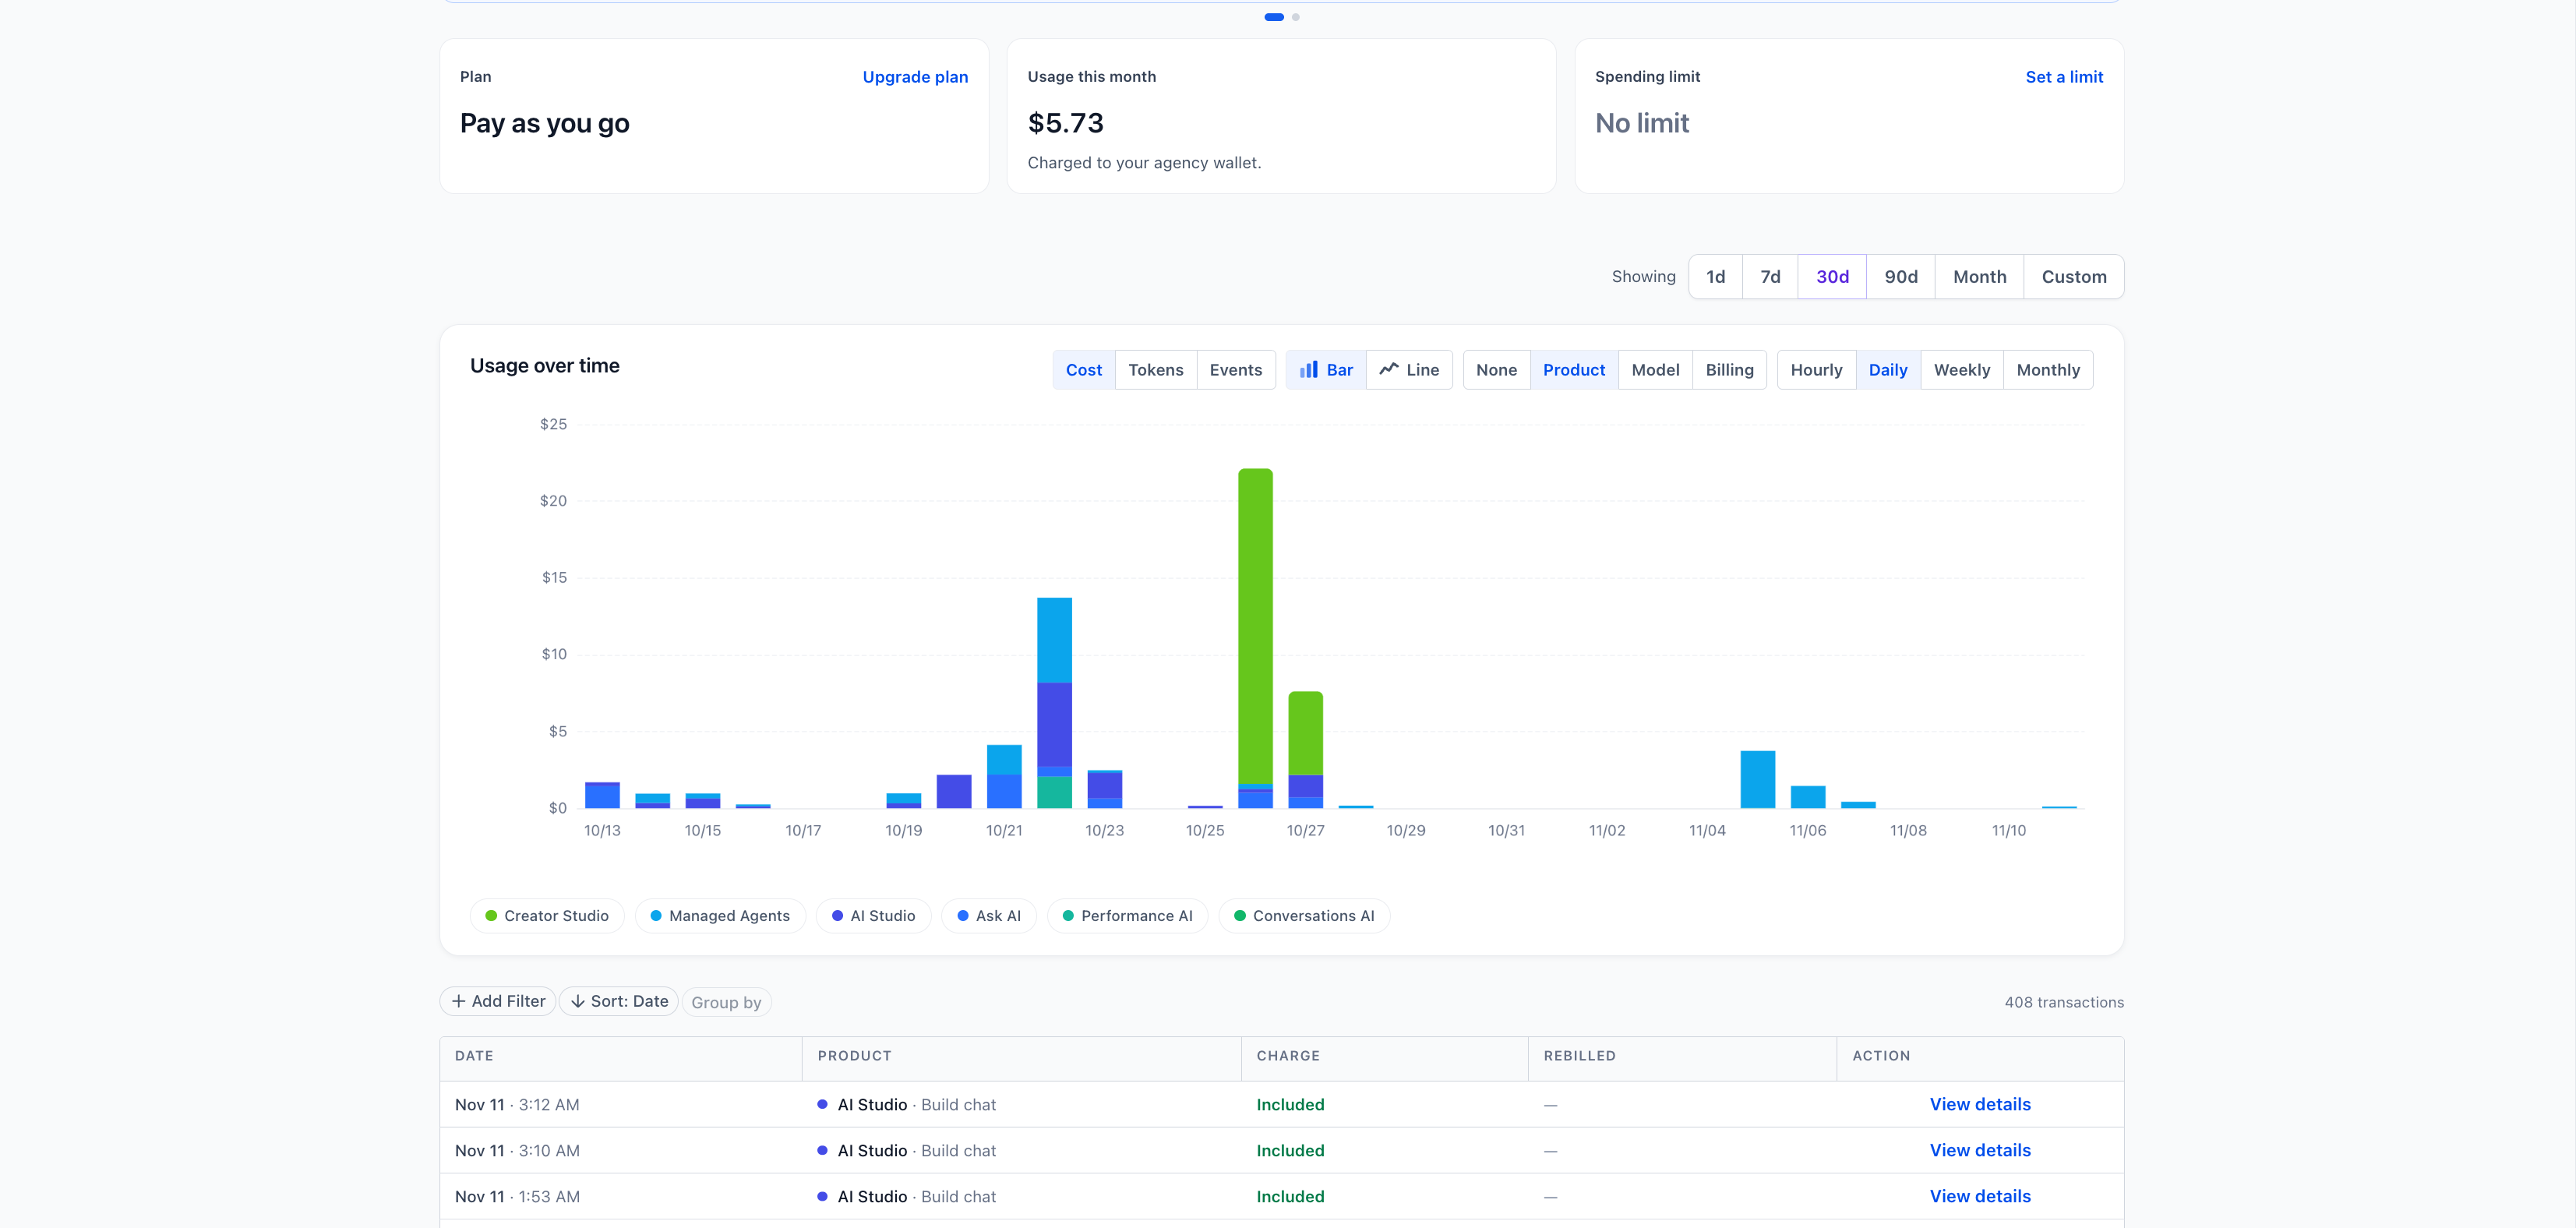
Card | What it shows |
|---|---|
Plan | Your AI plan, with an upgrade option when one is available to you |
Usage this month | Billable AI used this month; on a plan, extra usage beyond what the plan includes |
Spending limit or Extra usage | How much of the monthly limit is used, what happens at the limit (Stops AI at the limit or Alerts only), when it resets and who manages it. A red Stopped tag means AI has stopped. No limit means none is set. |
Included in your plan | On a plan only: what is included and how much is left |
Below the cards, Usage over time charts AI cost or usage events grouped by product, and an activity table lists individual AI charges with date, product and amount. Select View details on a charge to review it. Your account view does not show AI model names or token counts.
Limits and allowances reset on the 1st of each month at 00:00 UTC, which in the Americas is the evening of the last day of the previous month. Usage included in your plan is used first and does not count toward the limit; only billable usage counts. Each account has one monthly limit for everyone in it.
Usage can come from these products, depending on what your account uses: Ask AI, Managed Agents, Voice AI, Conversational AI, AI Studio, Agent Studio, Content AI image and text, Reviews AI and other AI features. A product appears only if it had activity in the period. Cost components can include language model processing, text-to-speech, image generation, video generation, call duration, web search and flat-rate products.
Situation | What happens | Banner on AI product pages |
|---|---|---|
Near the limit (75% or more) | AI keeps running | Shows how much of the limit is used and that AI pauses at 100% (or that you will be alerted) |
Stopped (limit reached with Stop AI) | New AI work stops; anything already running finishes | Shows that AI is paused, what stopped and when it resumes |
Past the limit (Keep running and alert me) | AI keeps running and usage past the limit is billed | Shows that you are past the limit and AI continues |
When stopped, the page shows AI stopped. and a red Stopped tag, and product pages say what stopped (for example that Conversational AI replies are not being sent or that Voice AI is not taking calls). AI runs again when the limit is raised or on the 1st of next month. Anyone in the account sees these banners. A closed banner stays hidden in that browser until usage reaches the next level (75%, 90%, 100%), and the stopped banner cannot be closed.
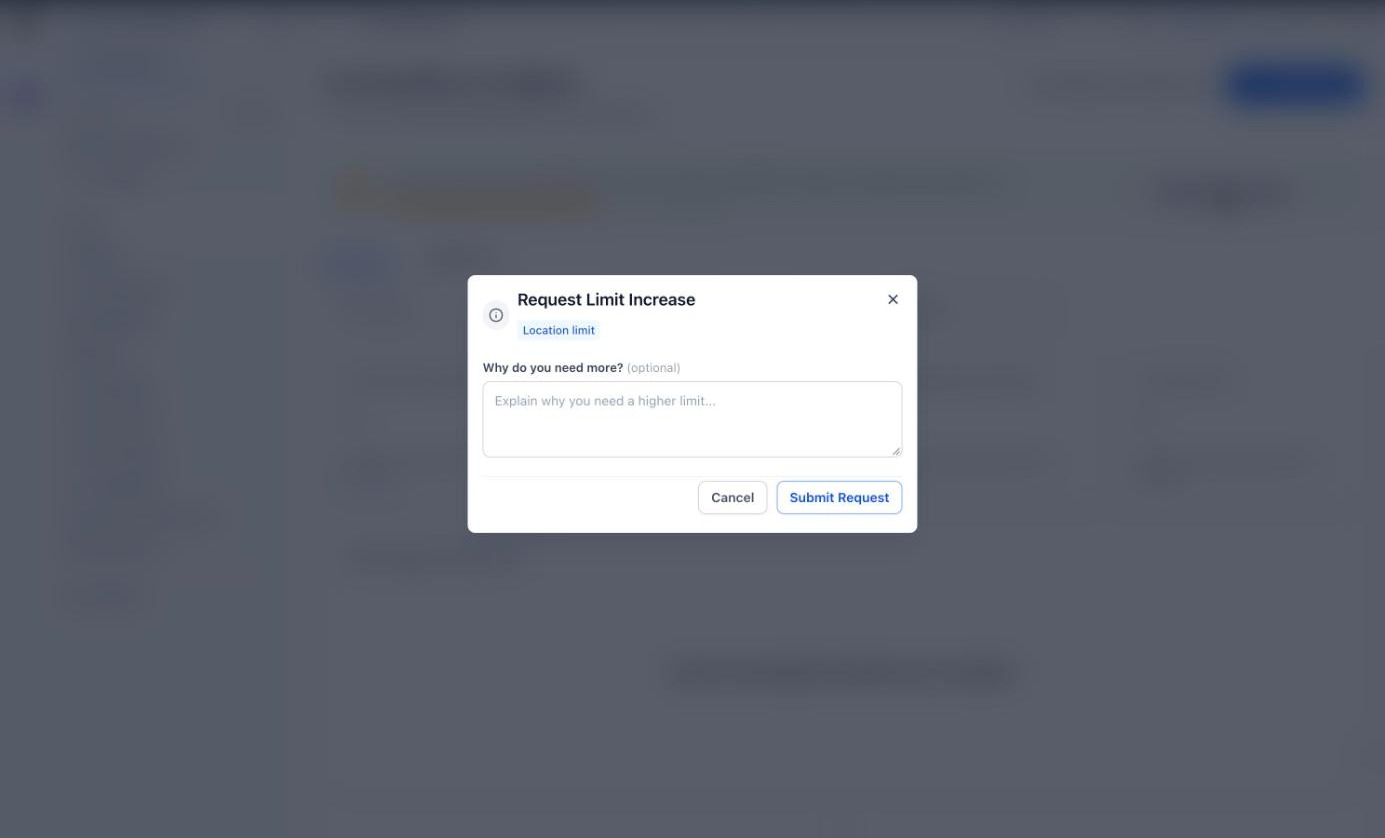
If a limit is managed for you, use Request more usage or Ask on the page to submit a request with an optional reason and click Submit Request. It appears as Waiting for review, and you can Withdraw it. Each person can have one open request at a time. Where your account manages its own limit, an administrator opens Set a limit, turns on Limit monthly spending, enters an amount, chooses Stop AI or Keep running and alert me under Advanced settings, and clicks Save.
What is the main purpose of Agent Logs?
It shows how an AI agent handled an interaction by combining the conversation with execution details in one place.
Is Agent Logs the same as the Message Execution Timeline in Agent Studio?
No. Agent Logs is a centralized logging and tracing view. The Message Execution Timeline is part of the Agent Studio testing and debugging experience.
Which filters does the Metrics dashboard have, and can I customize it?
Filters are Time Range, Agents, AI Products, Channels and Contacts. You can create custom layouts from a template or from scratch. The three default layouts are read-only.
What is the difference between Metrics and Monitors?
Metrics shows historical activity and trends. A Monitor measures one goal against a target within a window and checks it once a day.
Does opening the Monitor page run a check?
No. Monitors are evaluated at the scheduled daily time. You can click Refresh for a manual check, which does not change the schedule.
Can I reuse one notification channel for several monitors?
Yes. A channel can be assigned to more than one monitor.
What happens if I create a second monitor for the same metric?
The new one becomes the active version. The old one stays in History and can be made active again.
Why can I not see model names or tokens on the AI Usage page?
The account view shows cost and usage by product and charge, not model names or token counts.
Why did my AI stop replying or taking calls?
Your monthly AI limit may have been reached with Stop AI selected. Check the AI Usage page and product page banners, then raise the limit or request more usage. AI resumes on the 1st of the month.
Should patient information appear in logs?
No. AI features are not approved for PHI. Keep patient health details out of agent conversations, test messages and instructions.
