Your Aesthetix CRM dashboard can show you exactly which channels, Instagram, Google, referrals, and more, are bringing prospective patients into your practice and turning them into booked consults. Attribution and UTM parameters let you pull that channel data directly onto your dashboard widgets: as columns in a table, as groupings on a donut or line chart, or as filters on any Contact or Opportunity widget. You'll find all of this under Dashboard in your left navigation.
Interactive walkthrough
Interactive walkthrough
Attribution and UTM data is currently available only on Contact and Opportunity widgets.
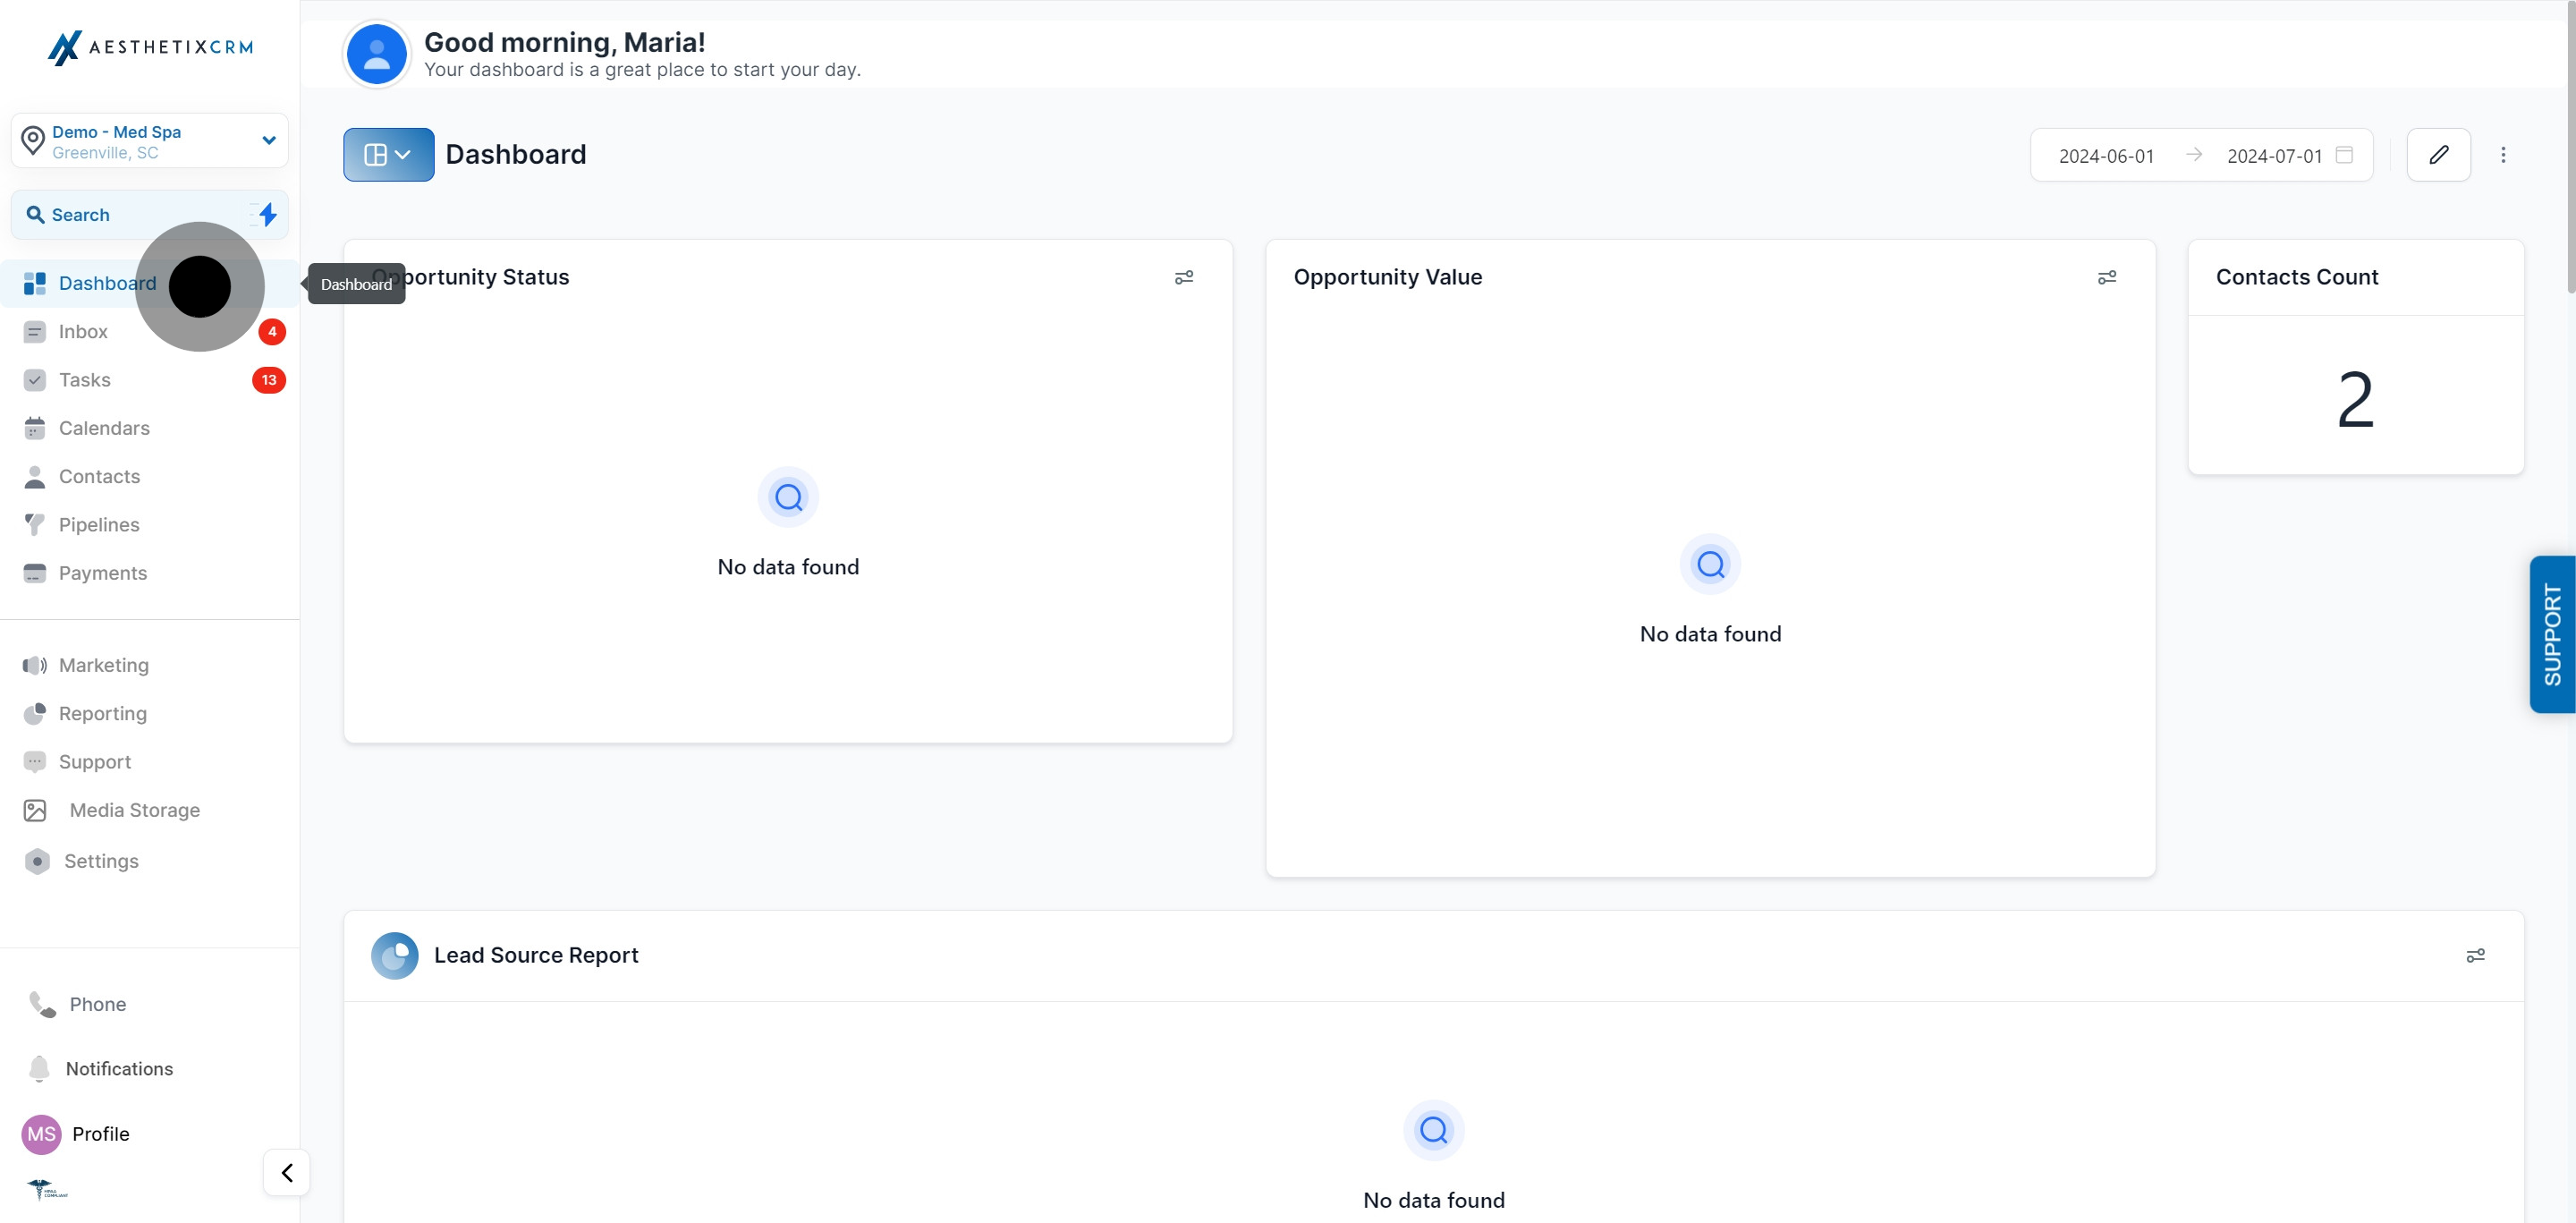
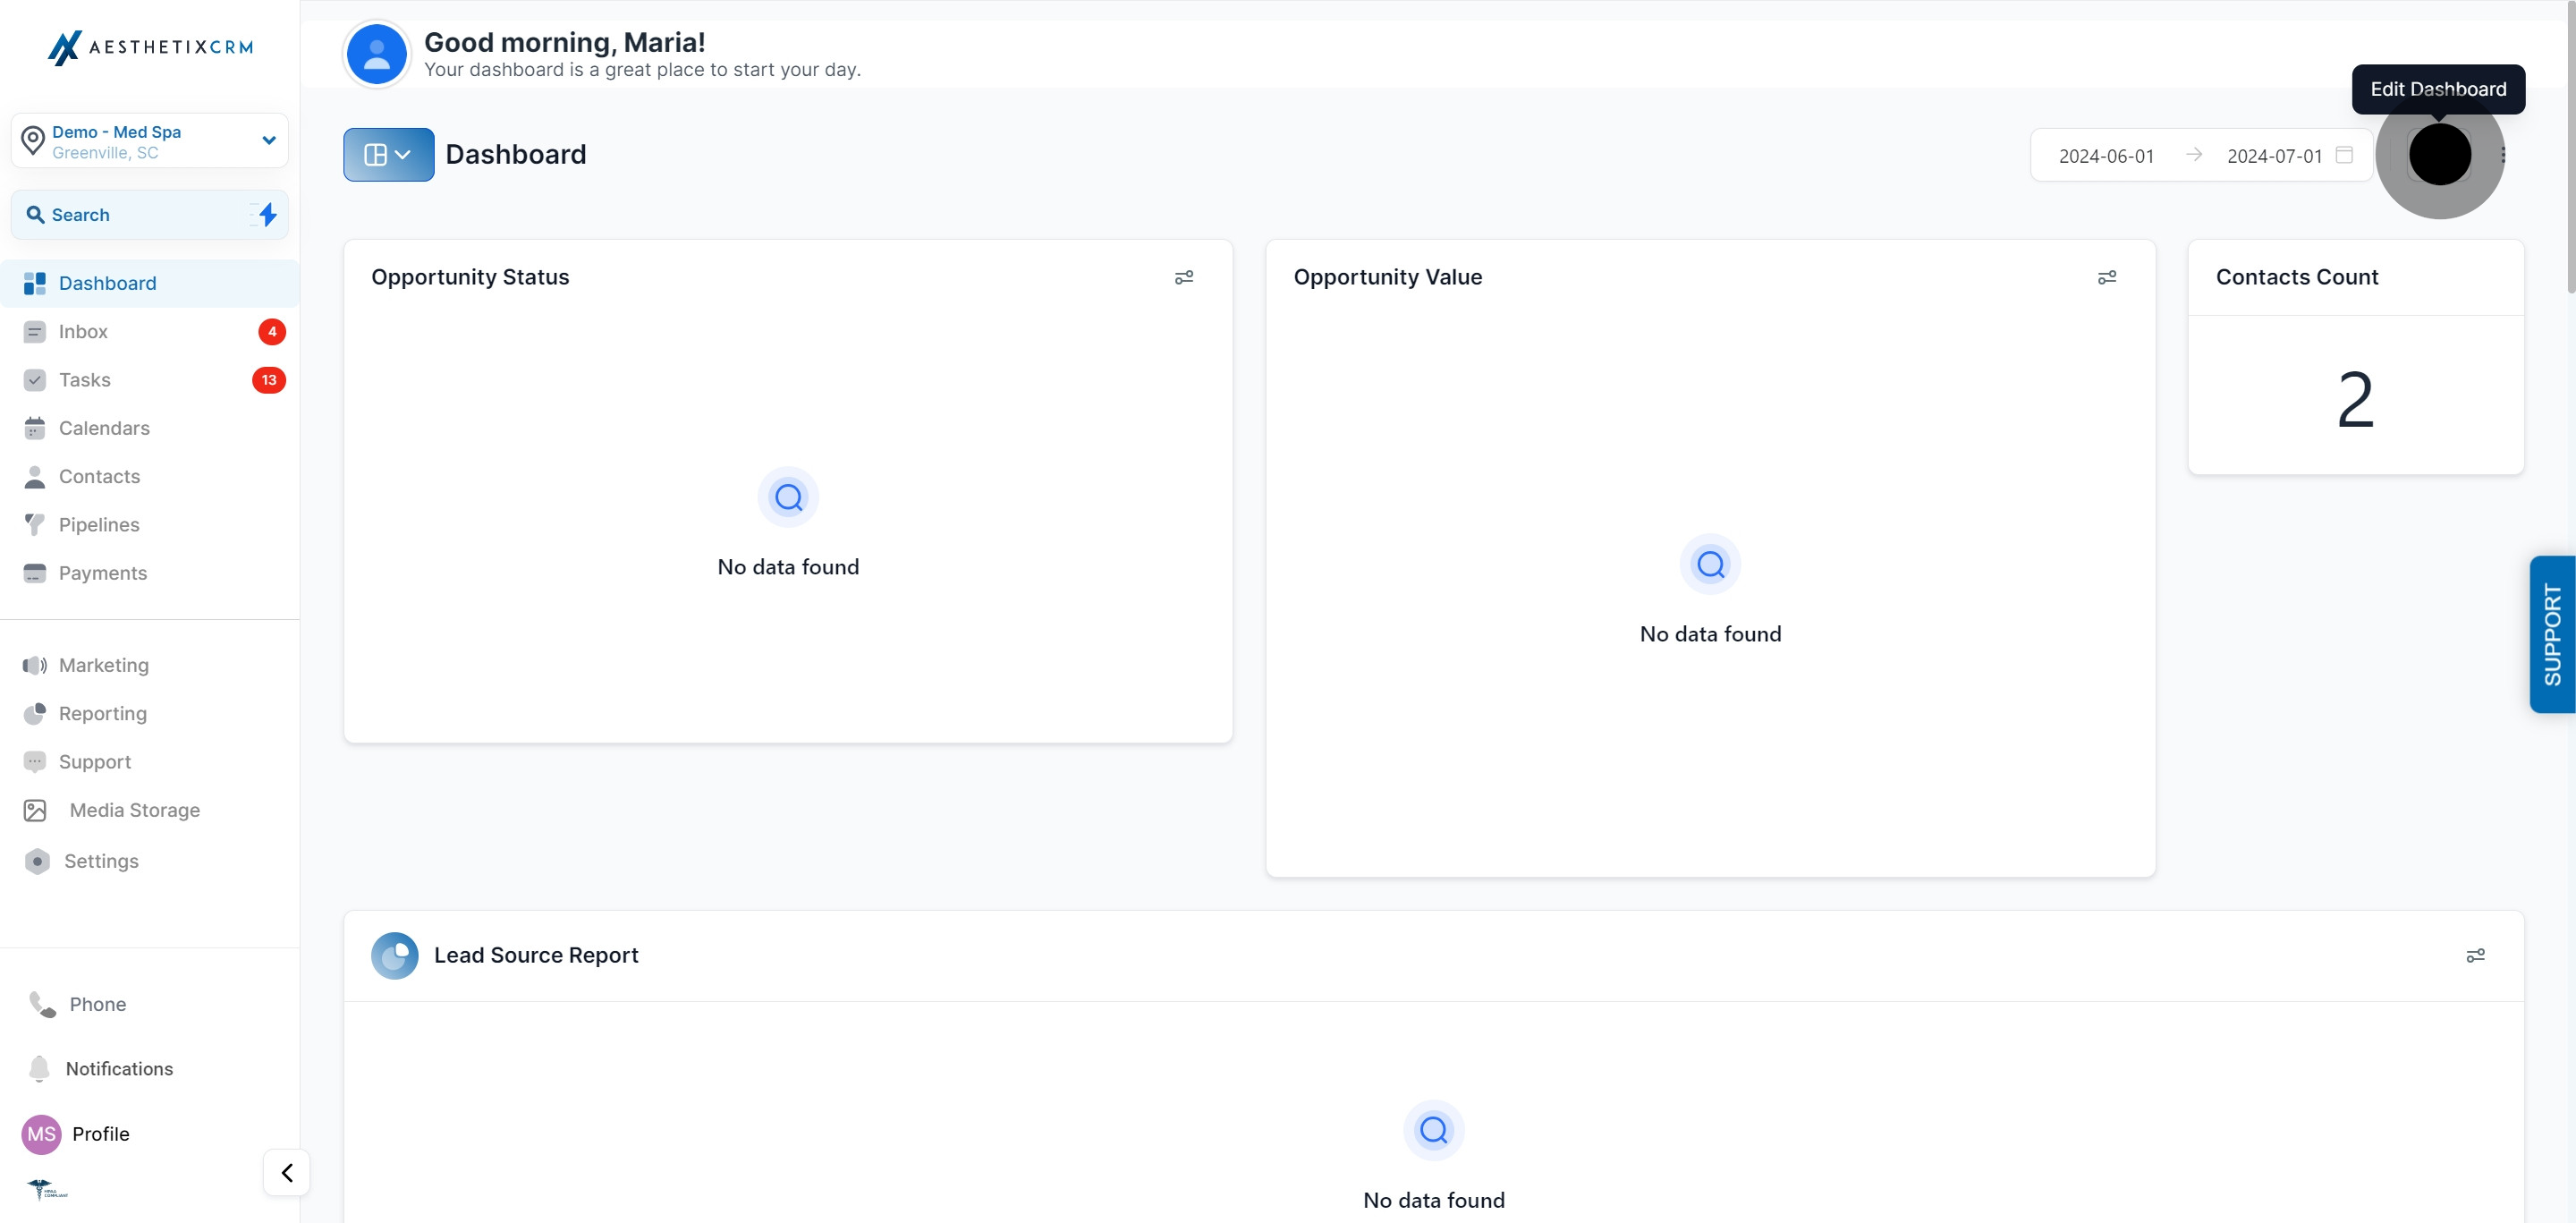
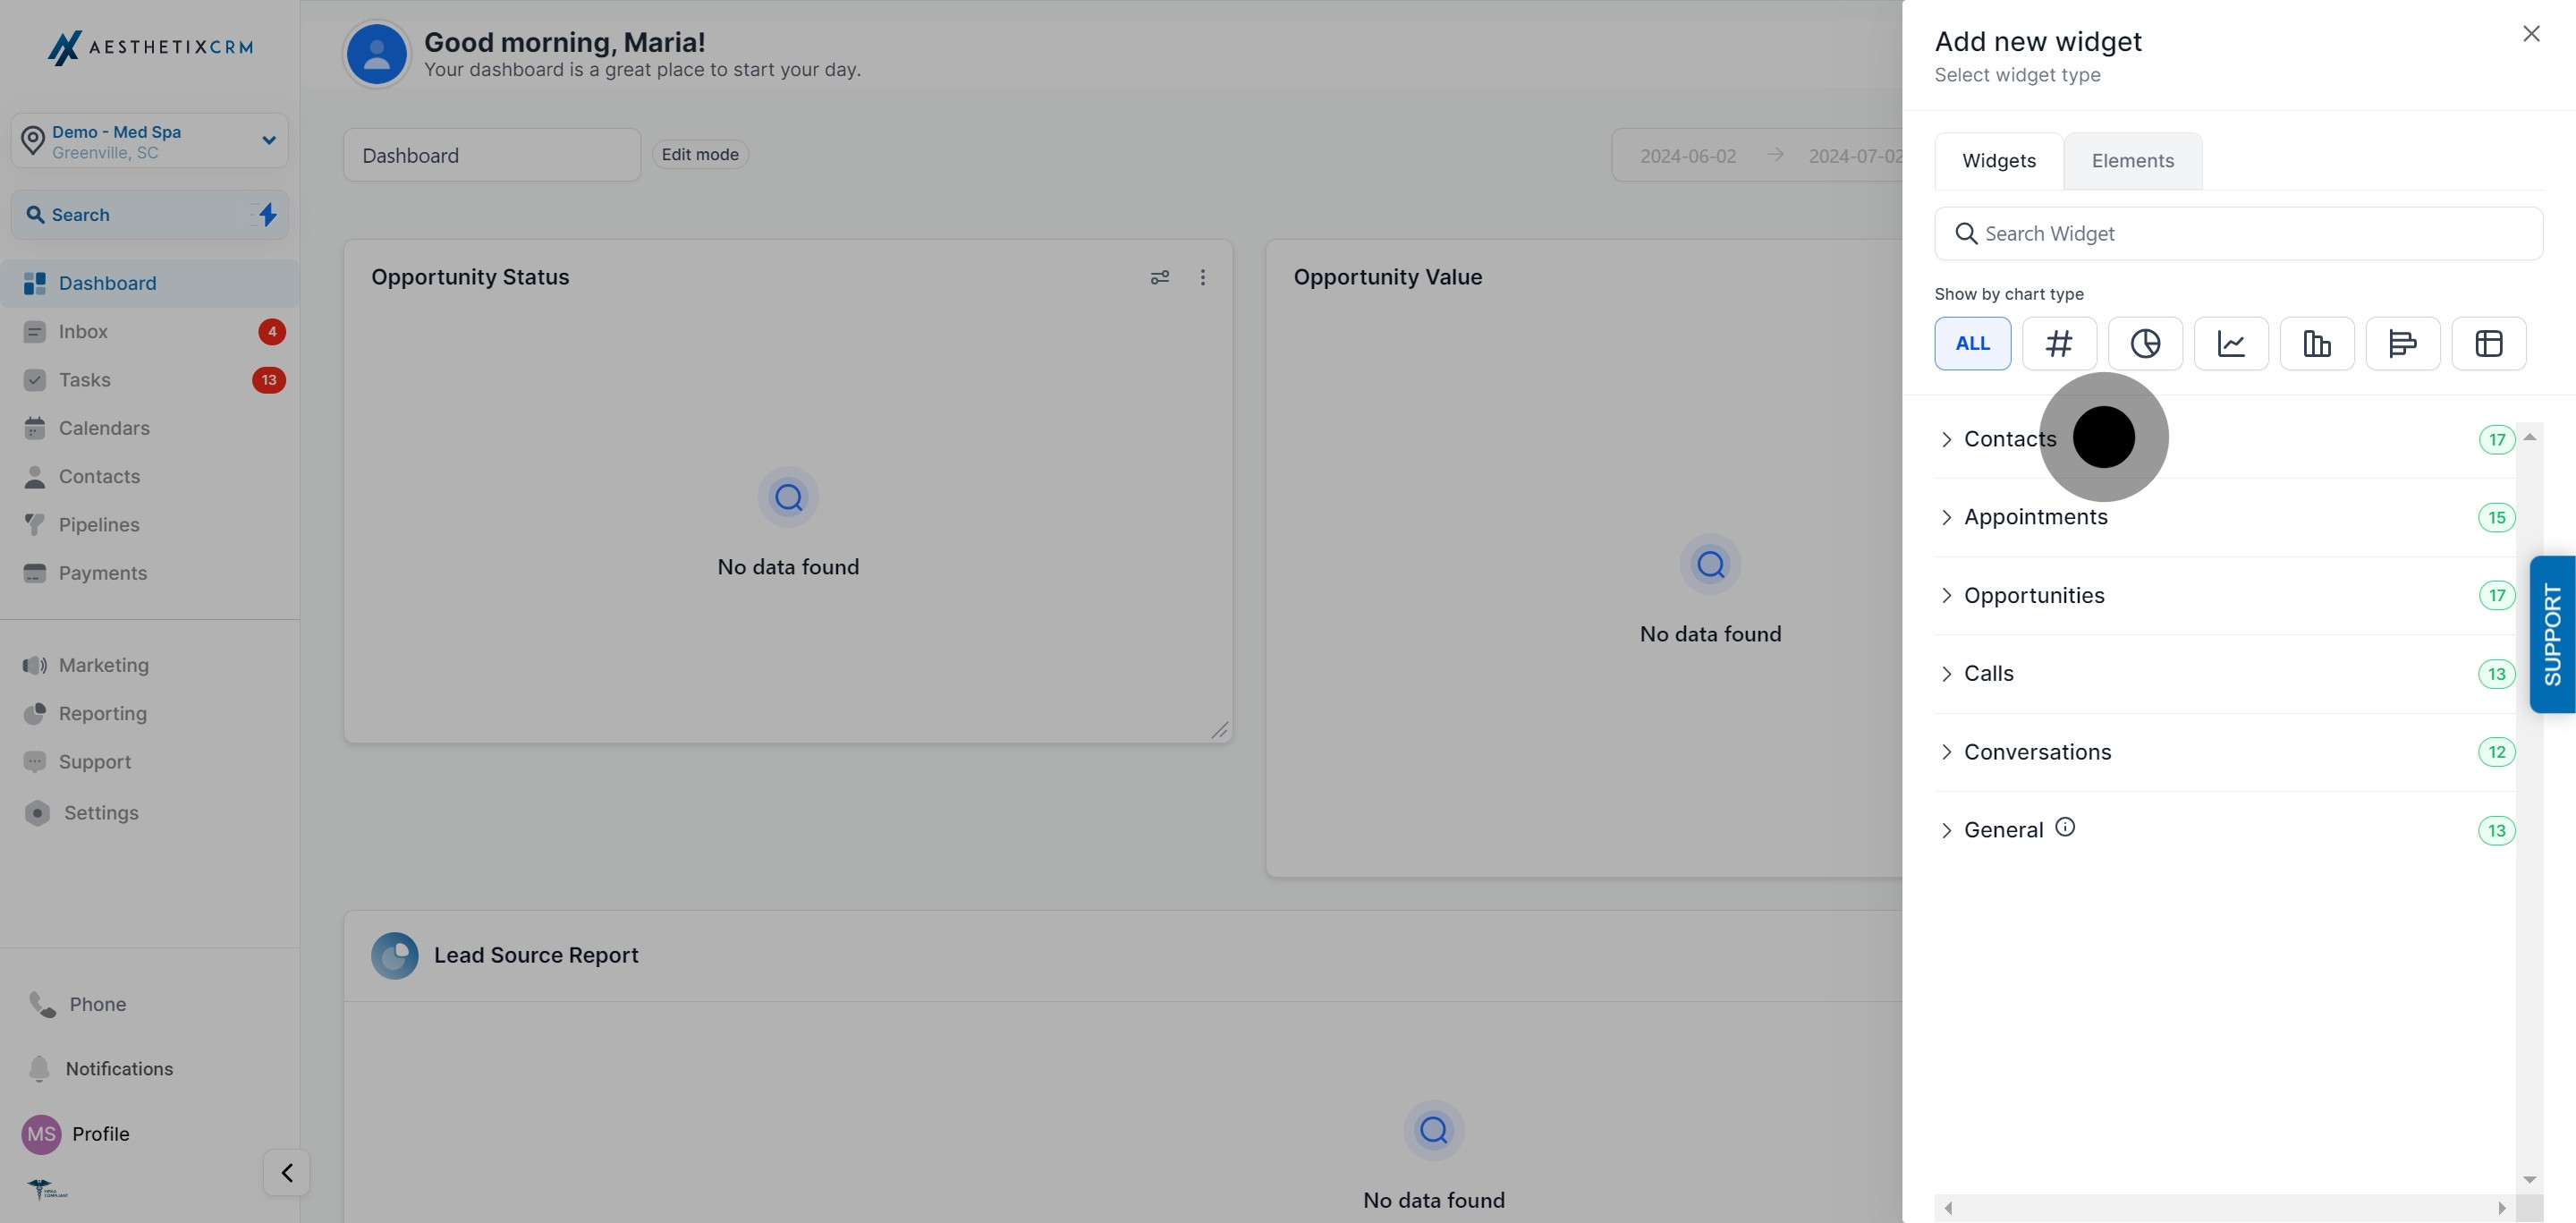
Every walkthrough below starts the same way.
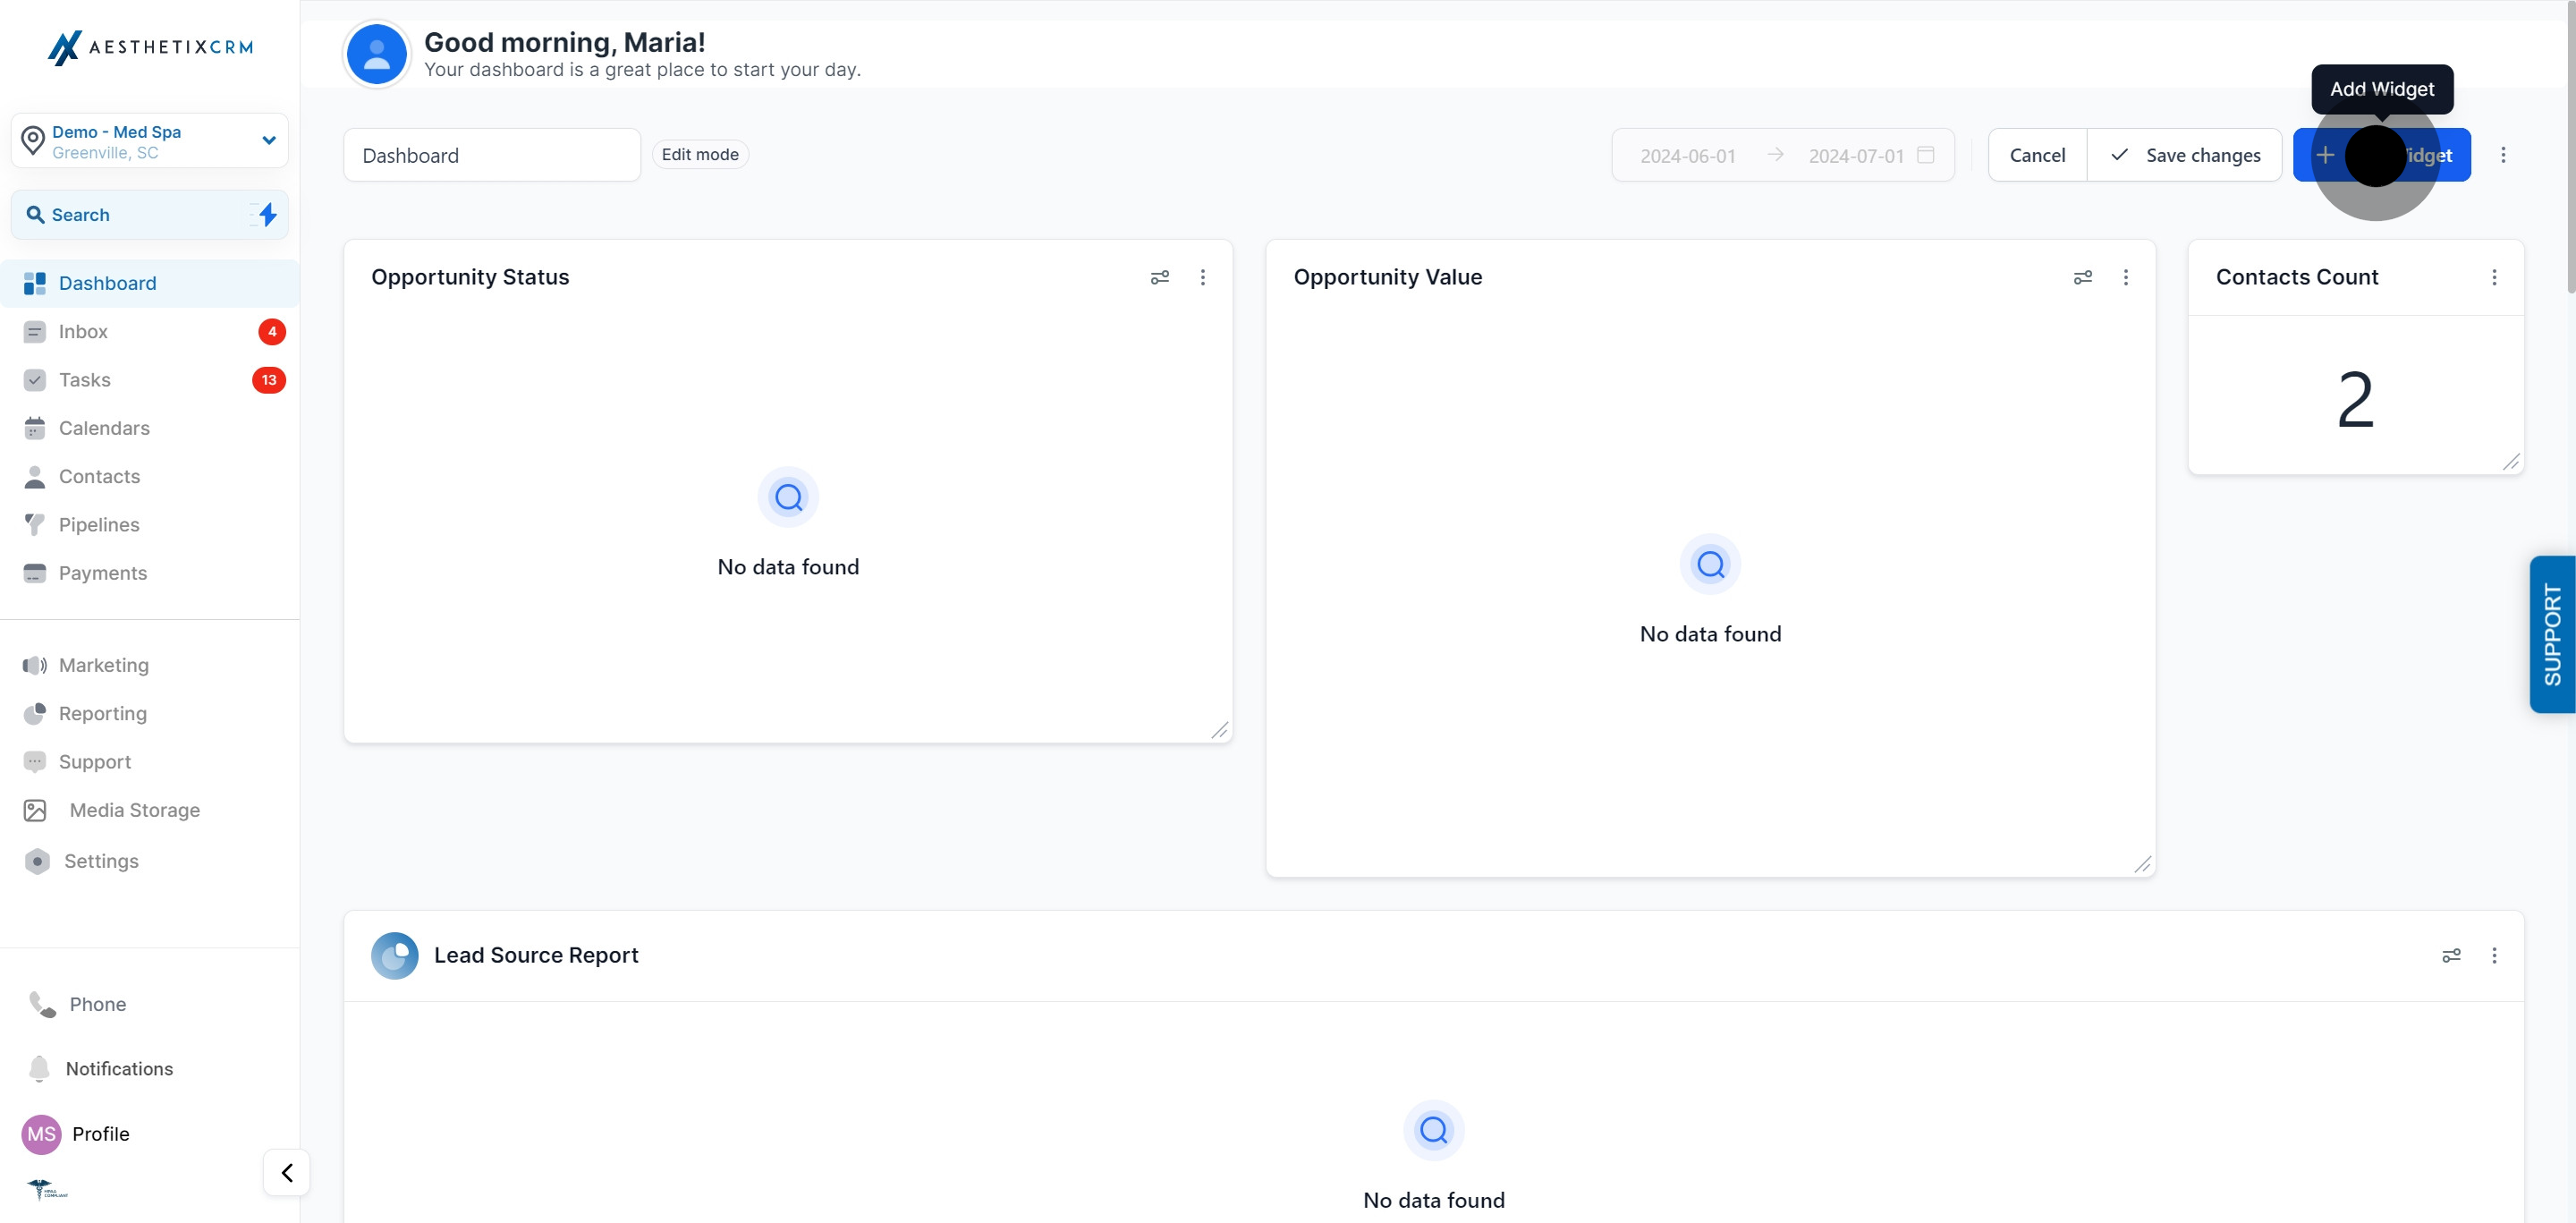
Attribution and UTM data only appears on widgets in these two categories, so pick one before continuing.
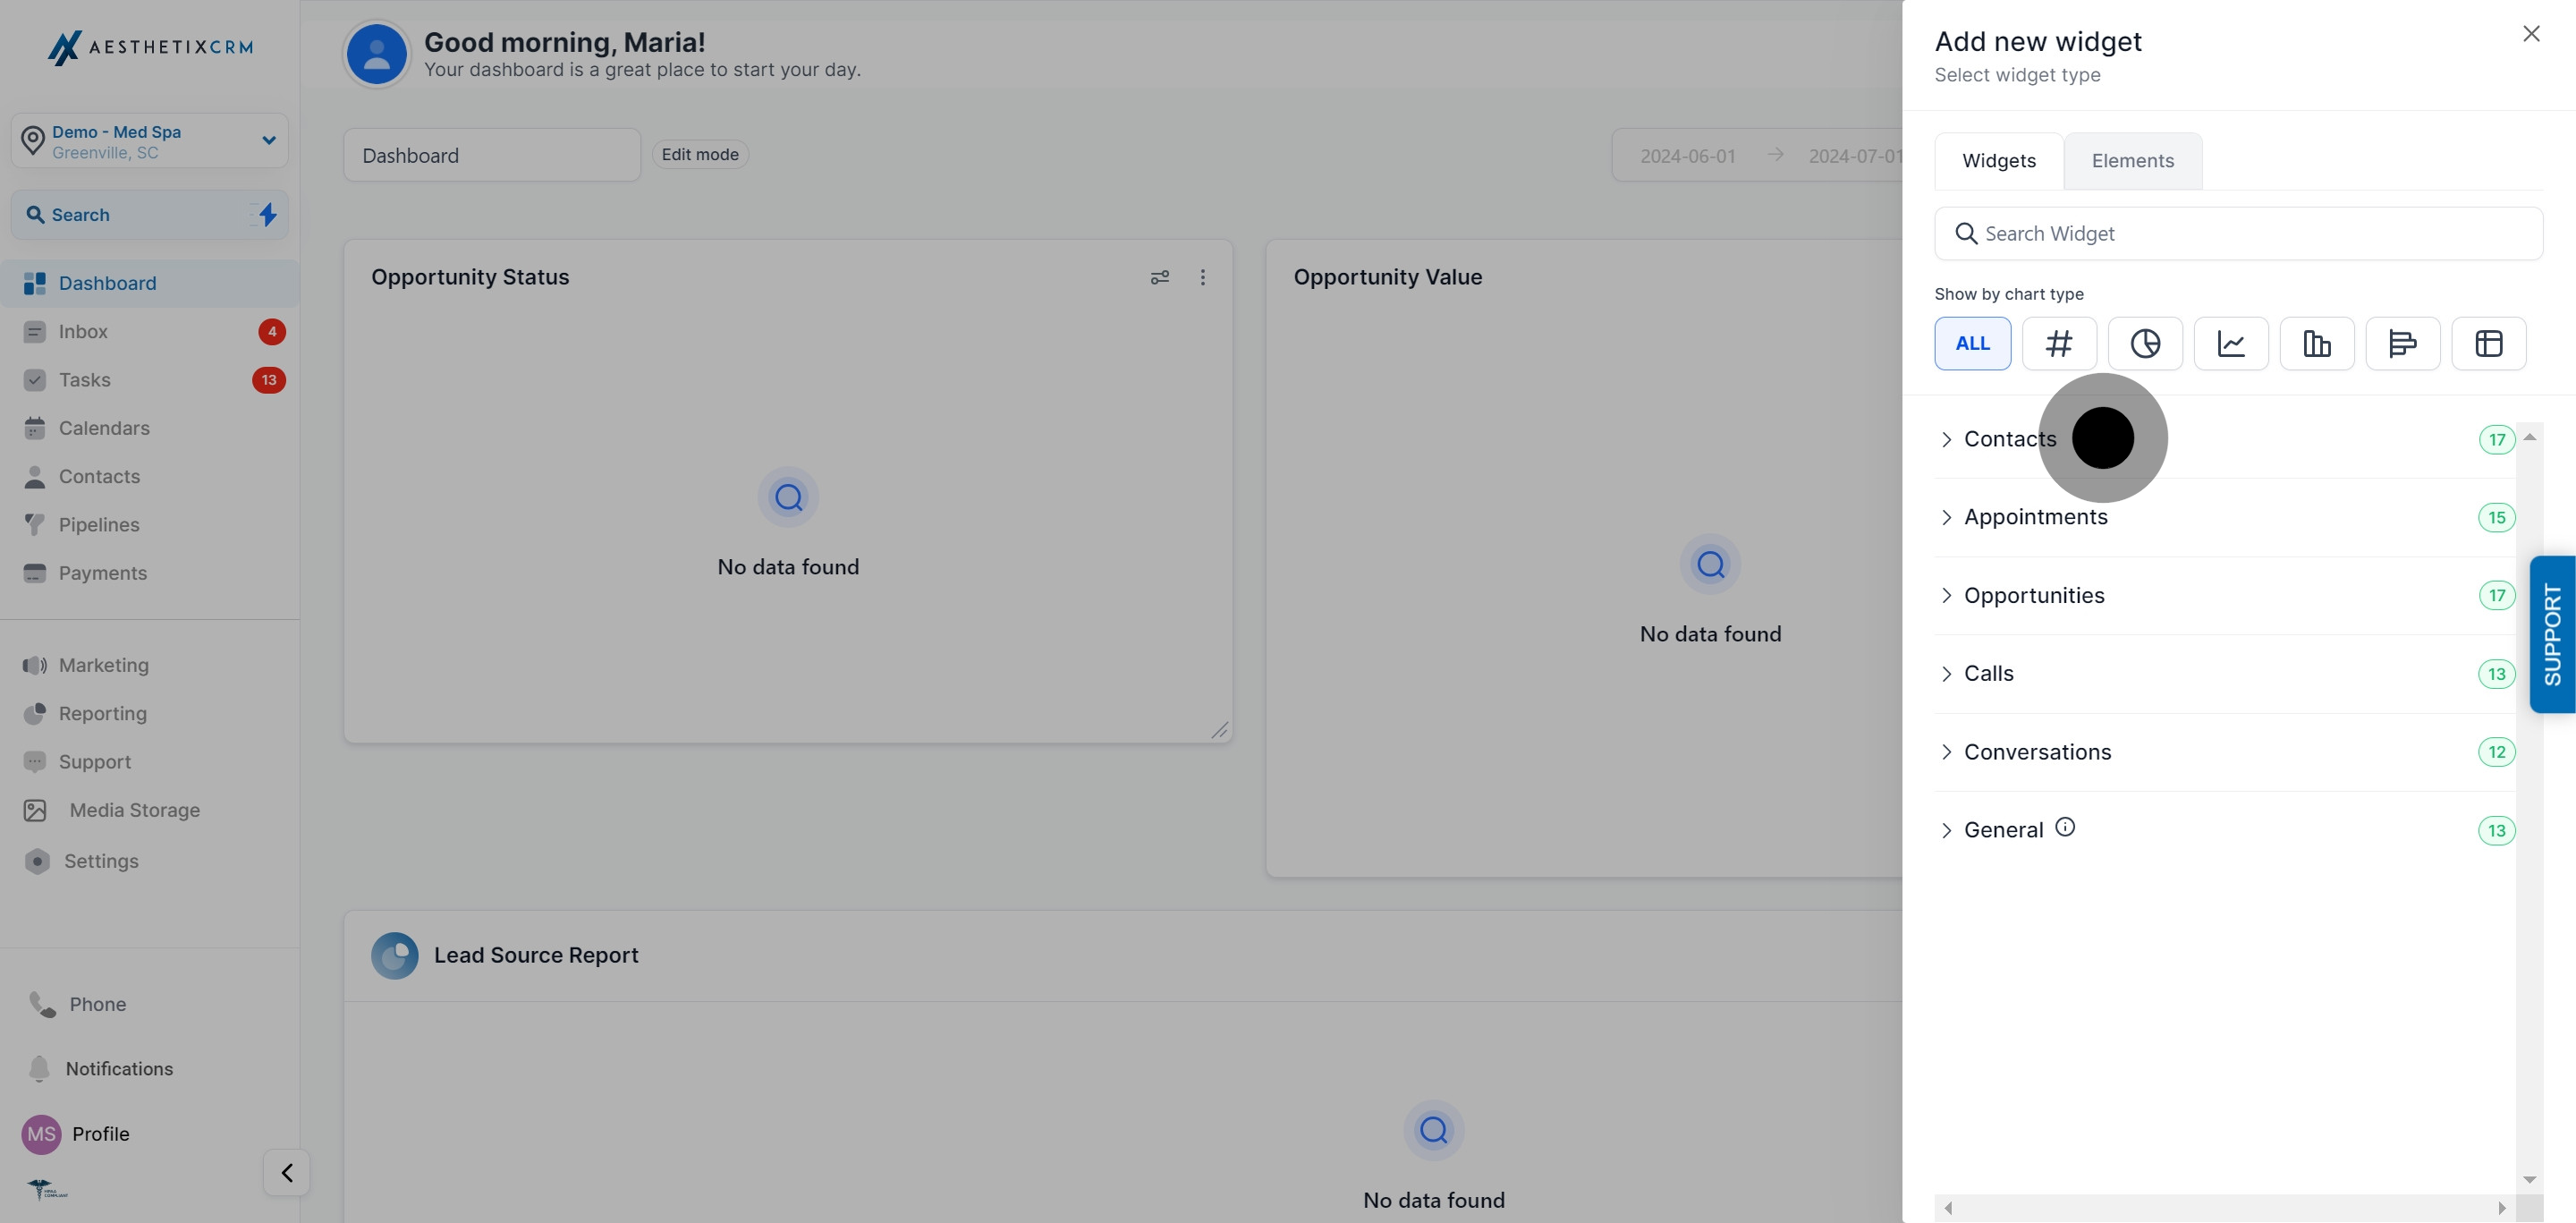
From here, which path you take depends on what you want to see: a sortable table, a grouped donut or line chart, or a widget filtered down to a specific channel.
Use this when you want a spreadsheet-style view of every contact or opportunity with its attribution and UTM data laid out in columns, for example to export a list of every patient who booked through a specific Google campaign.
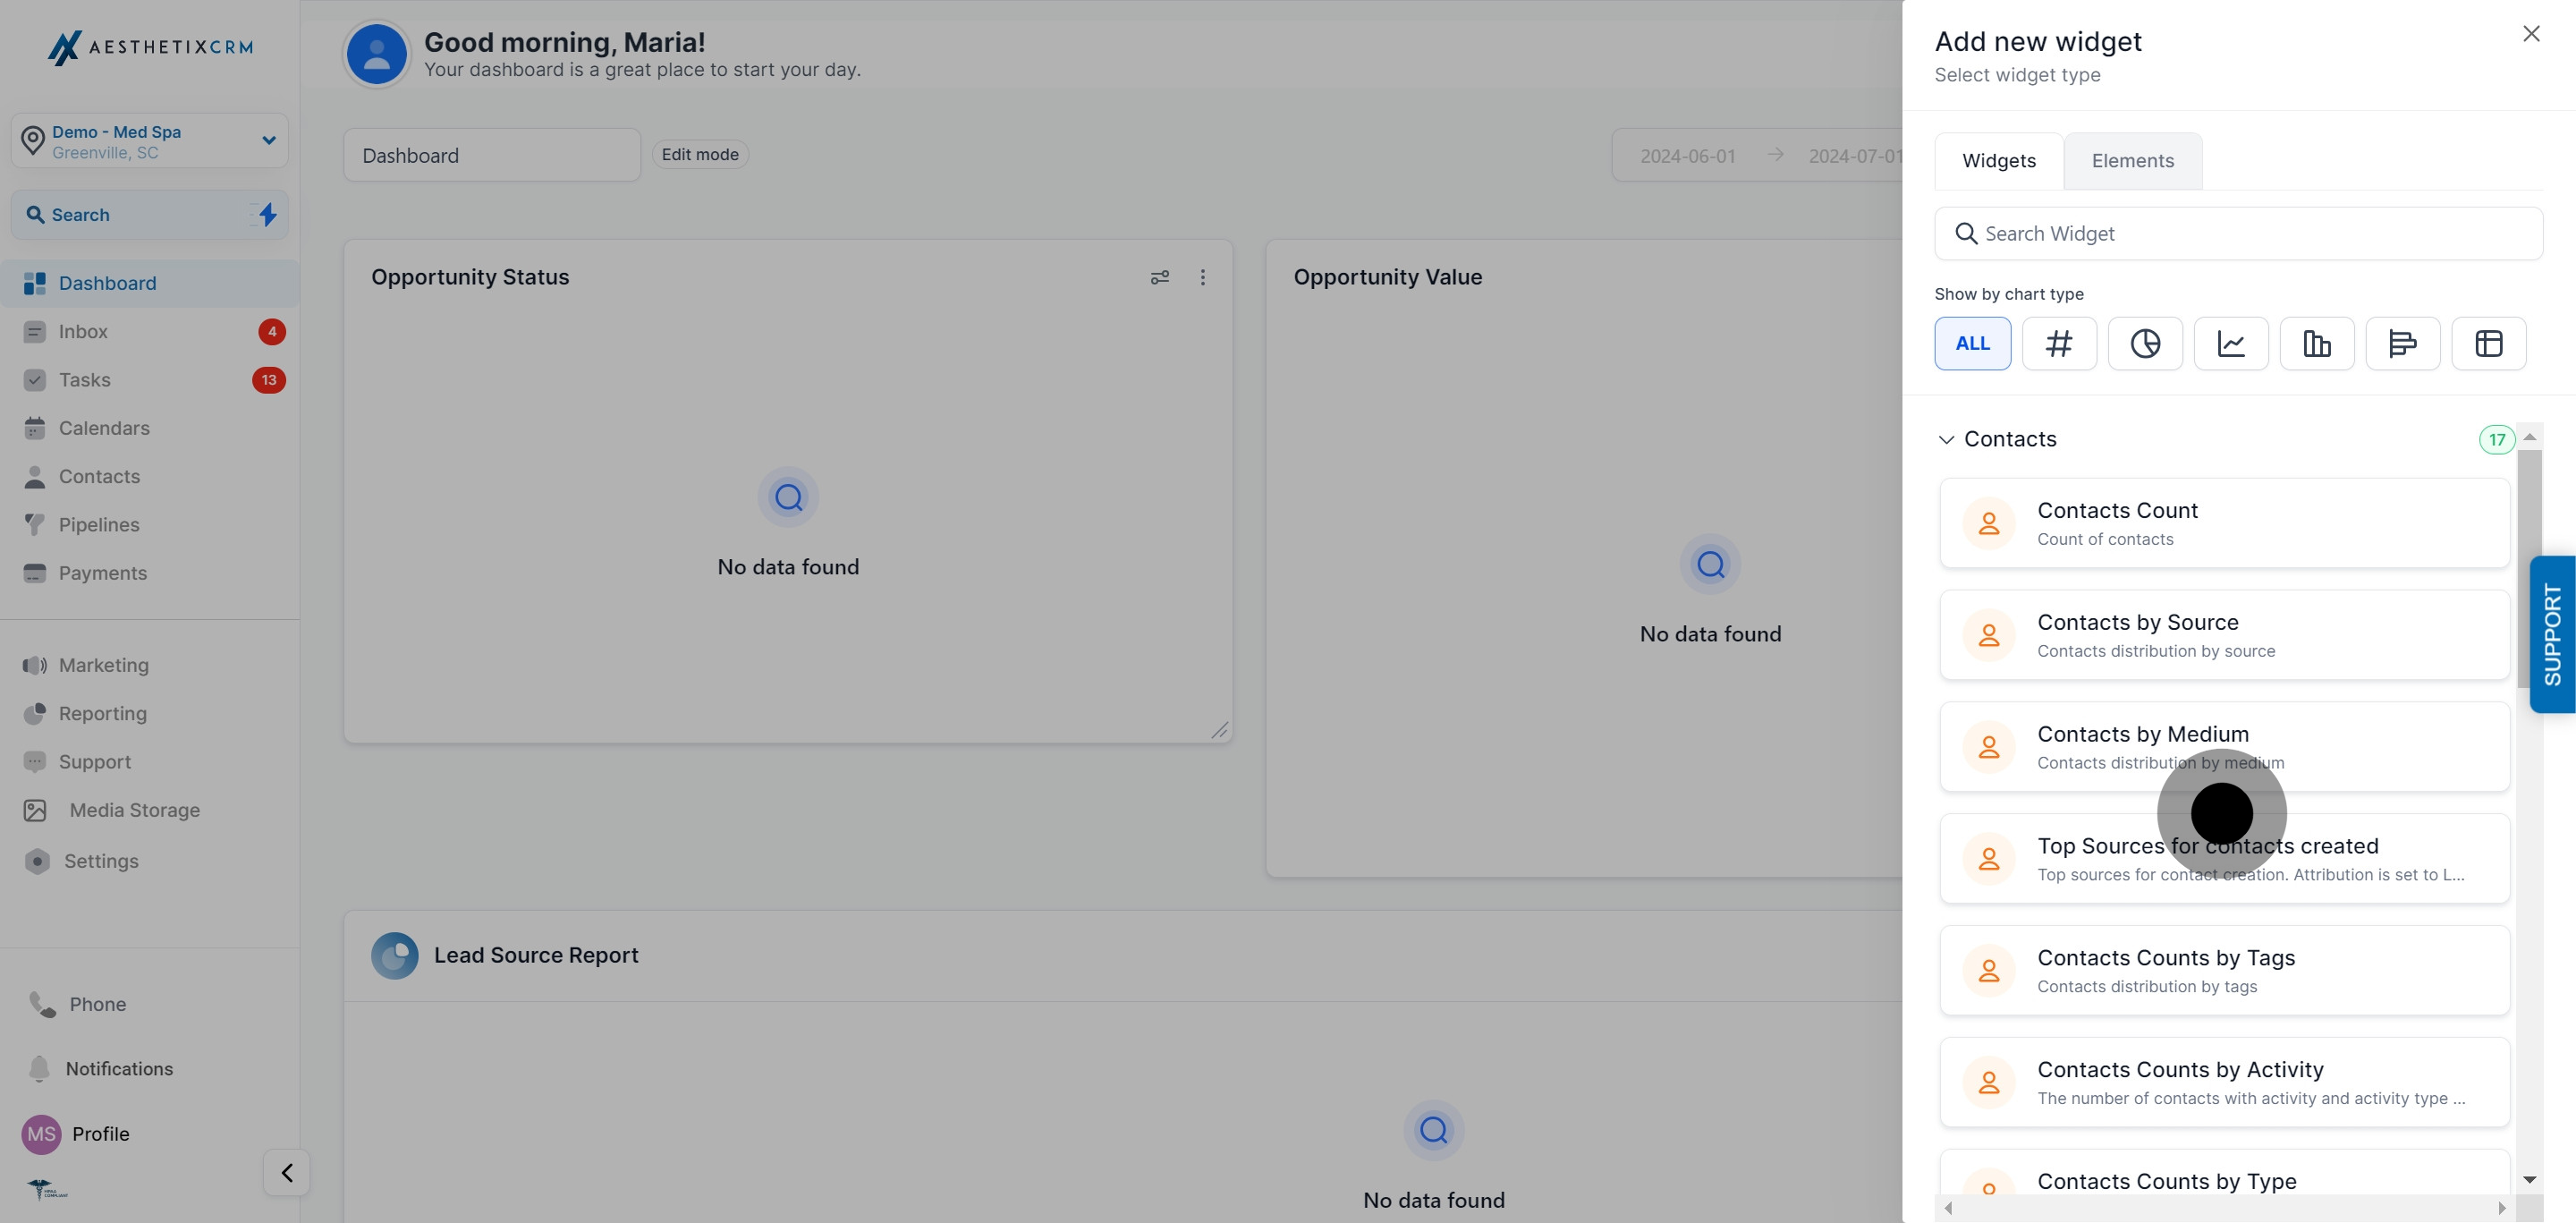
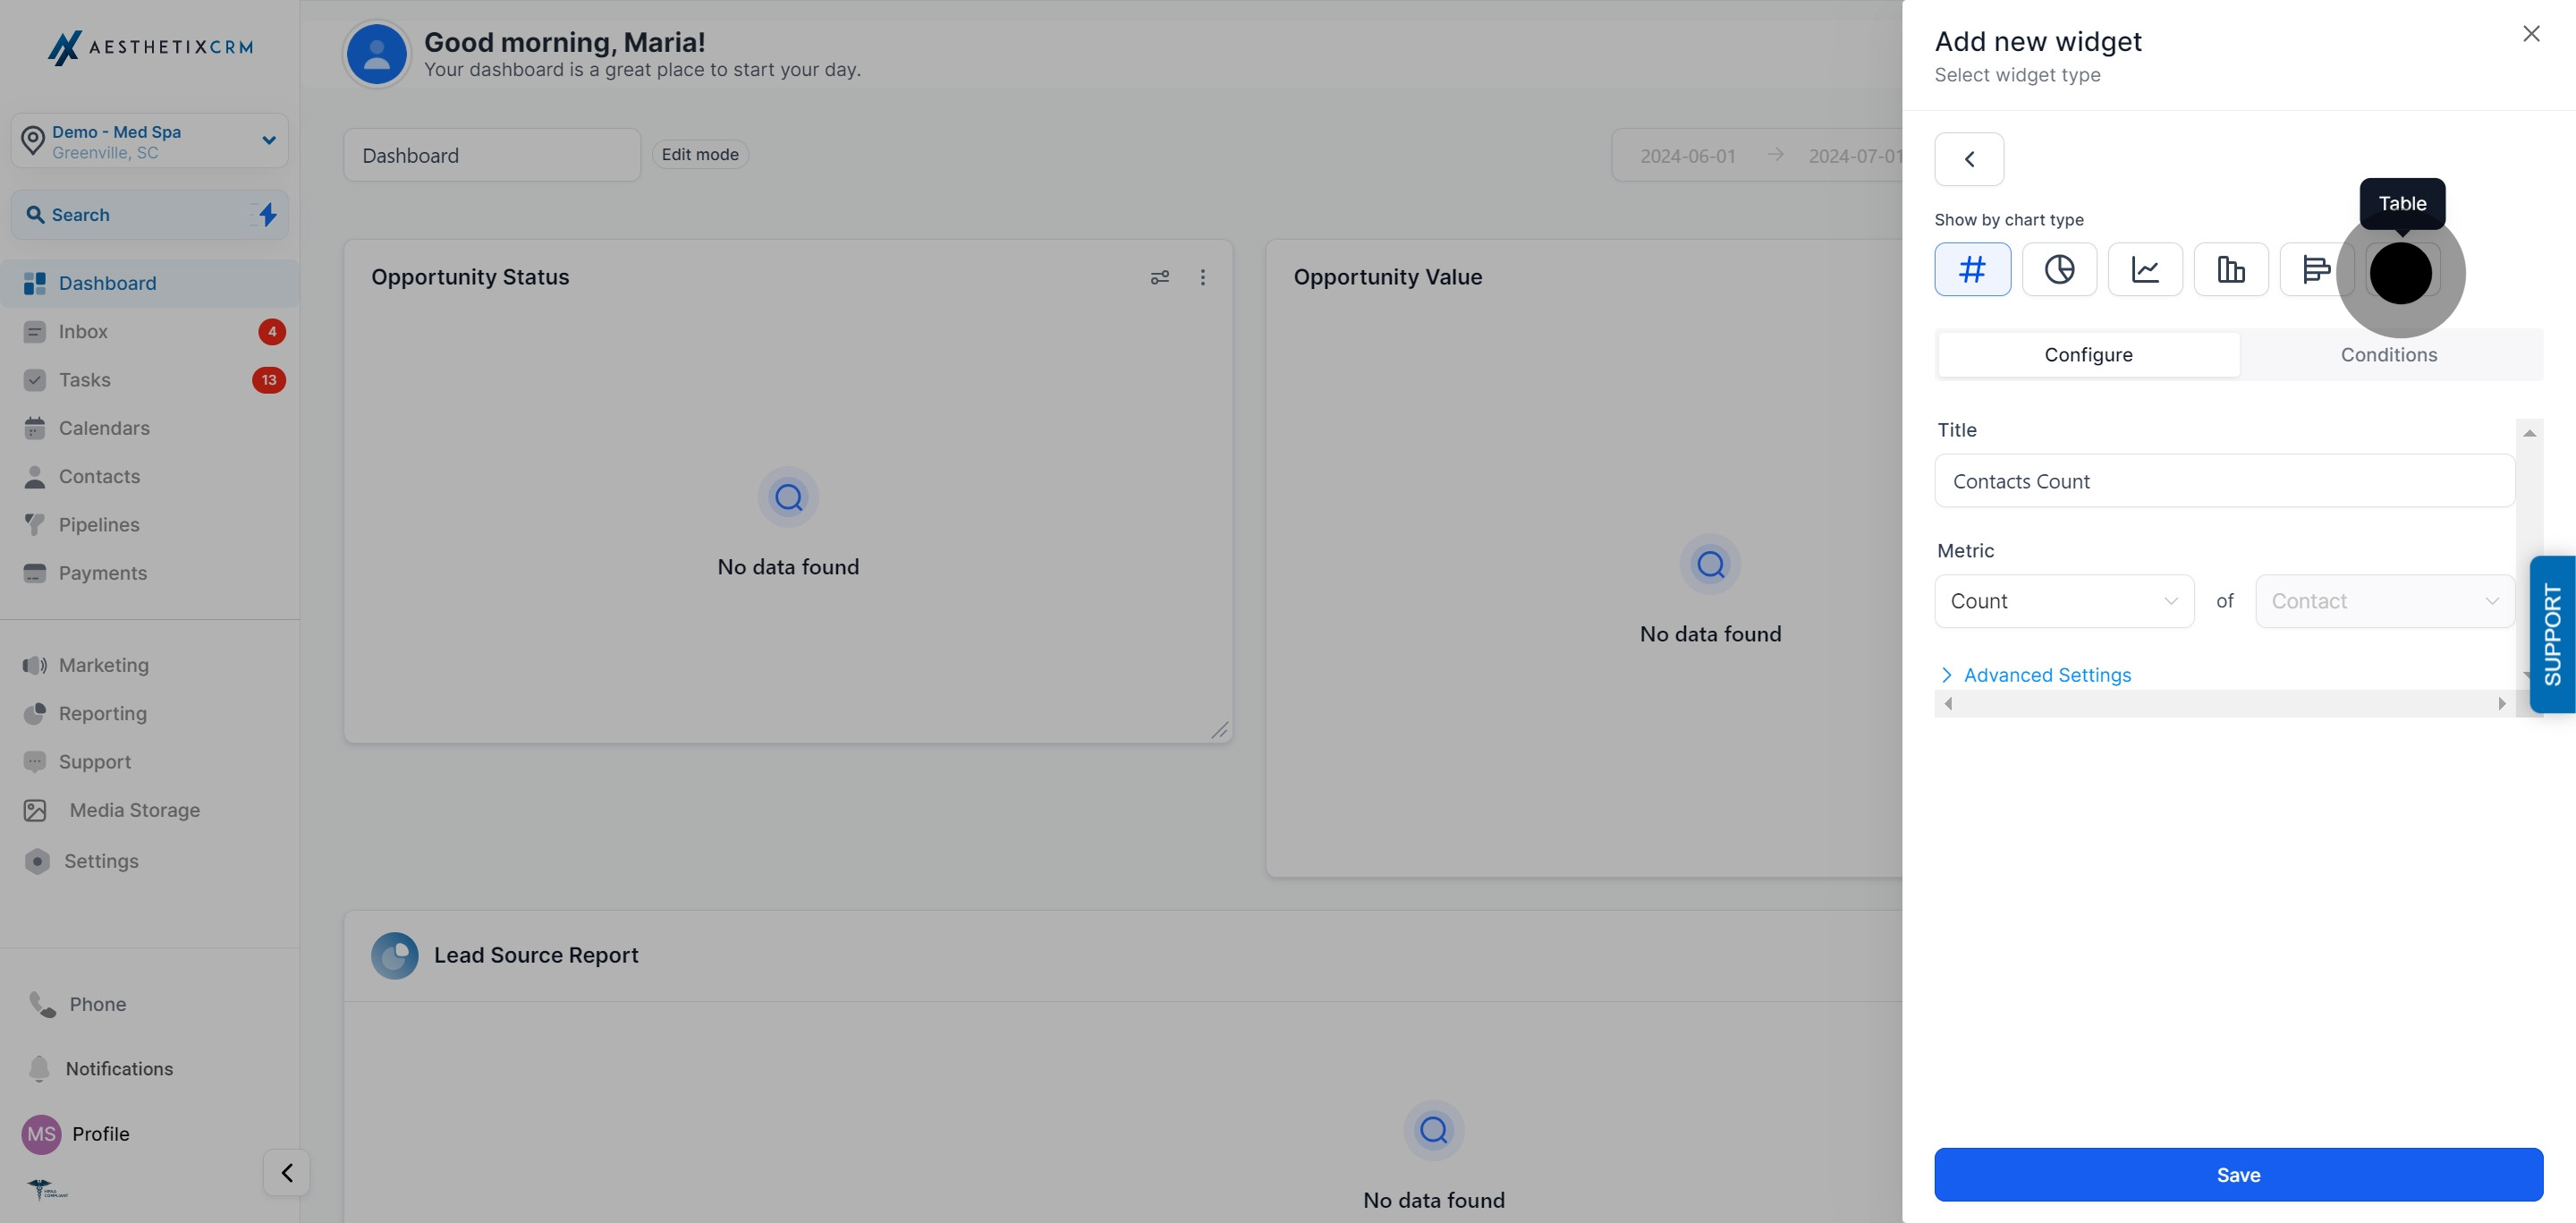
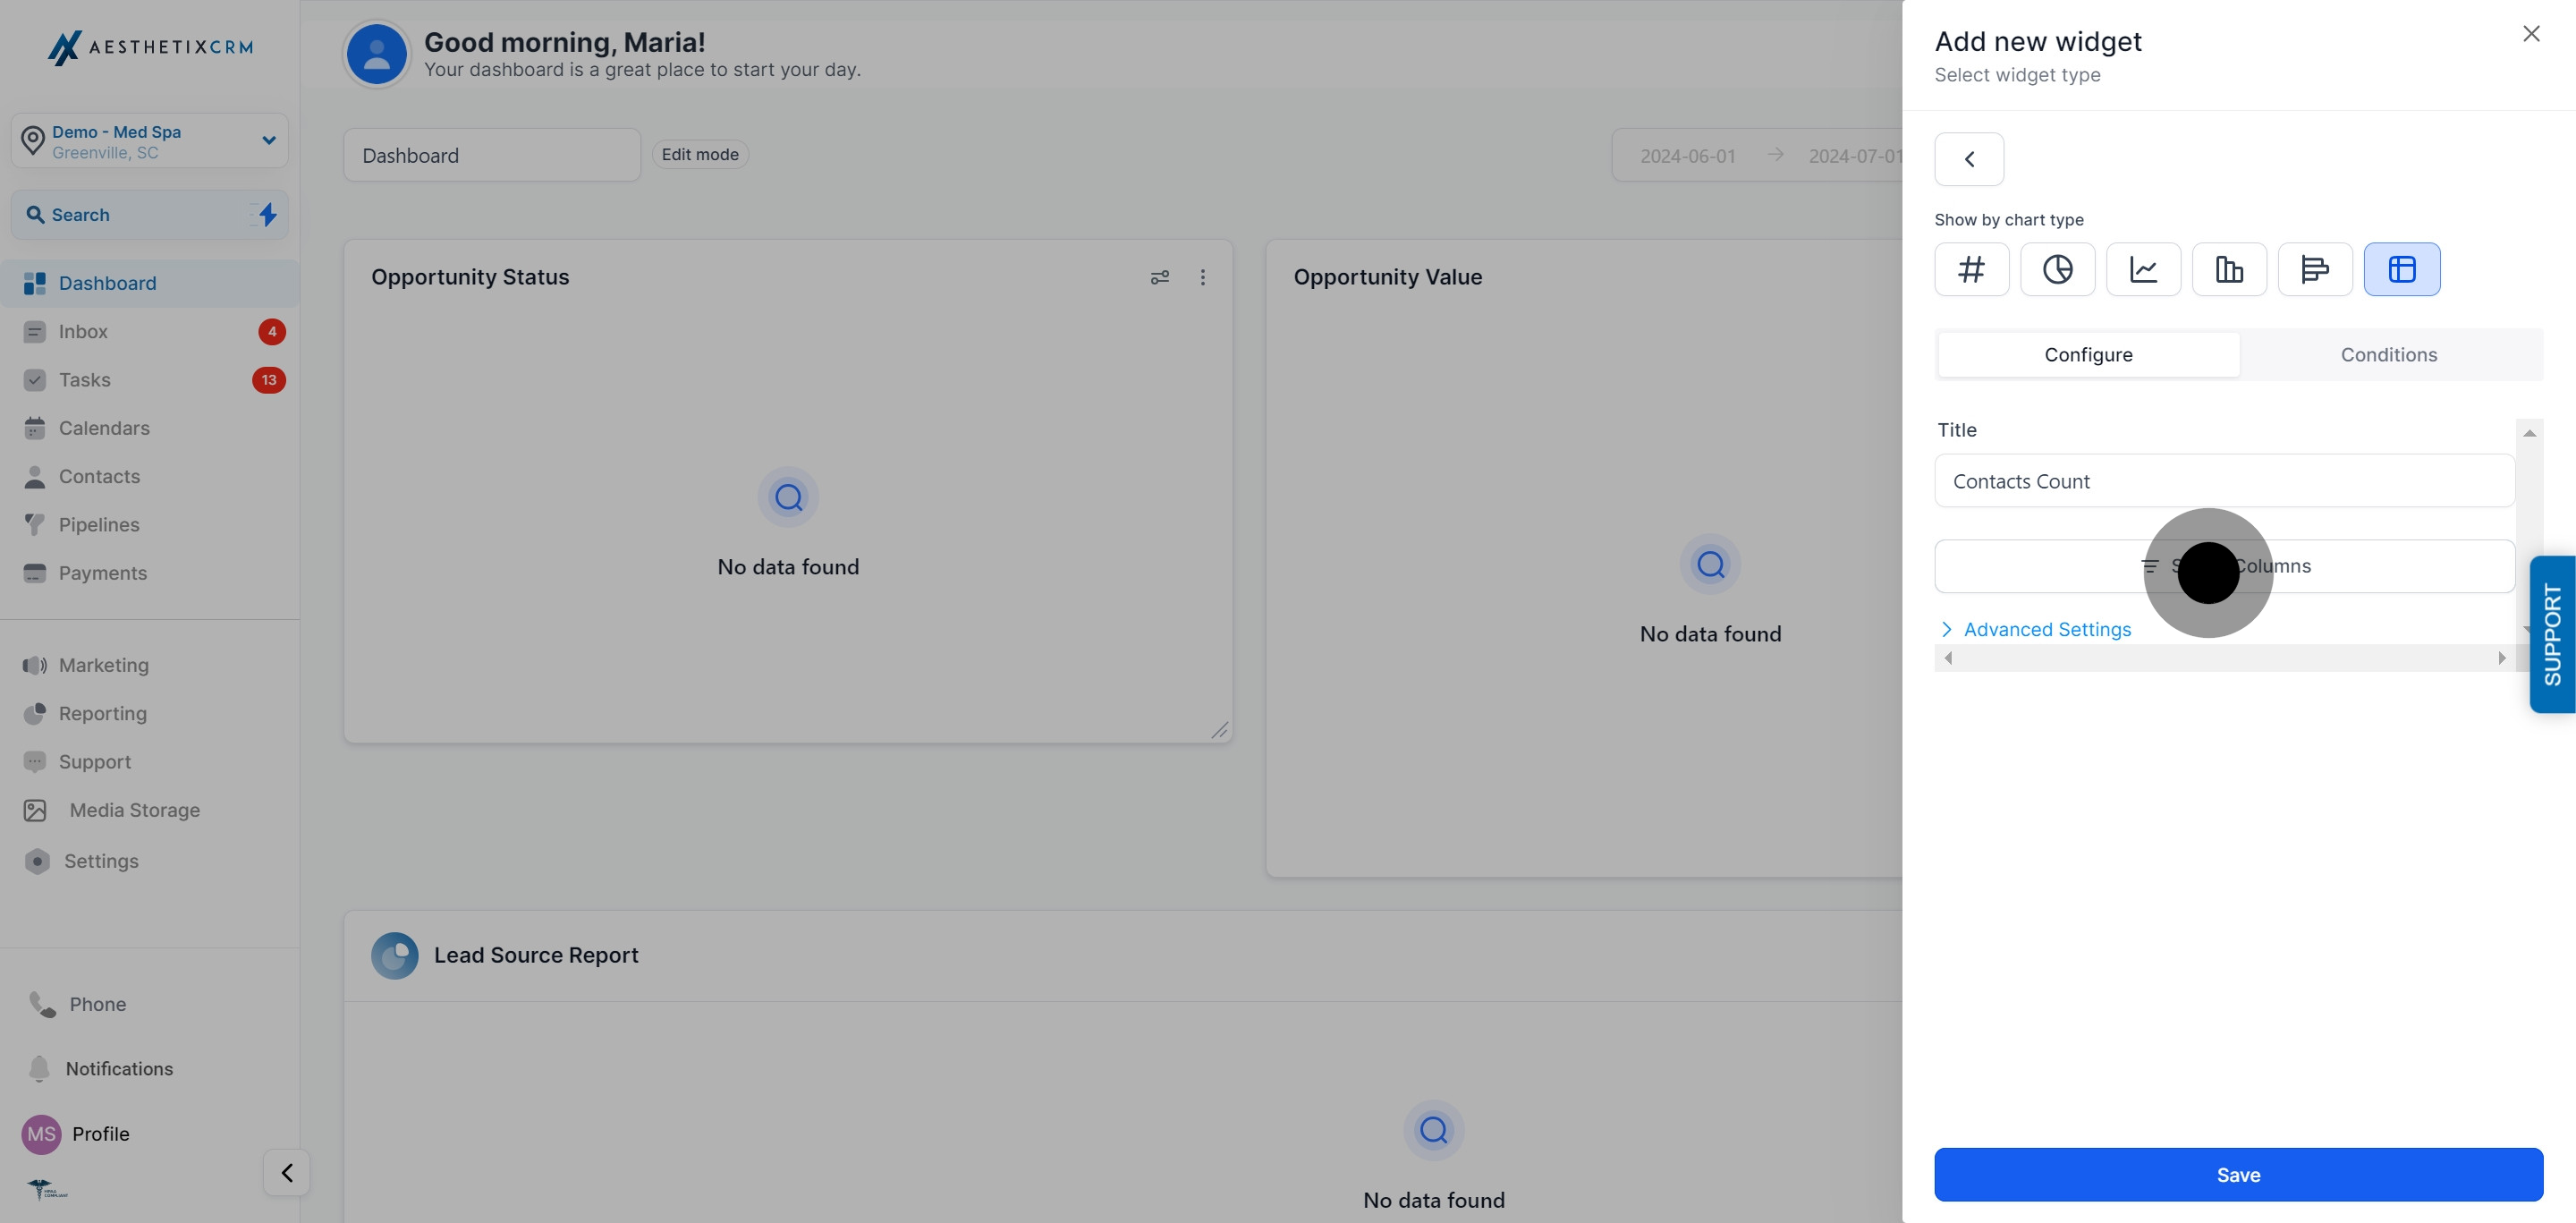
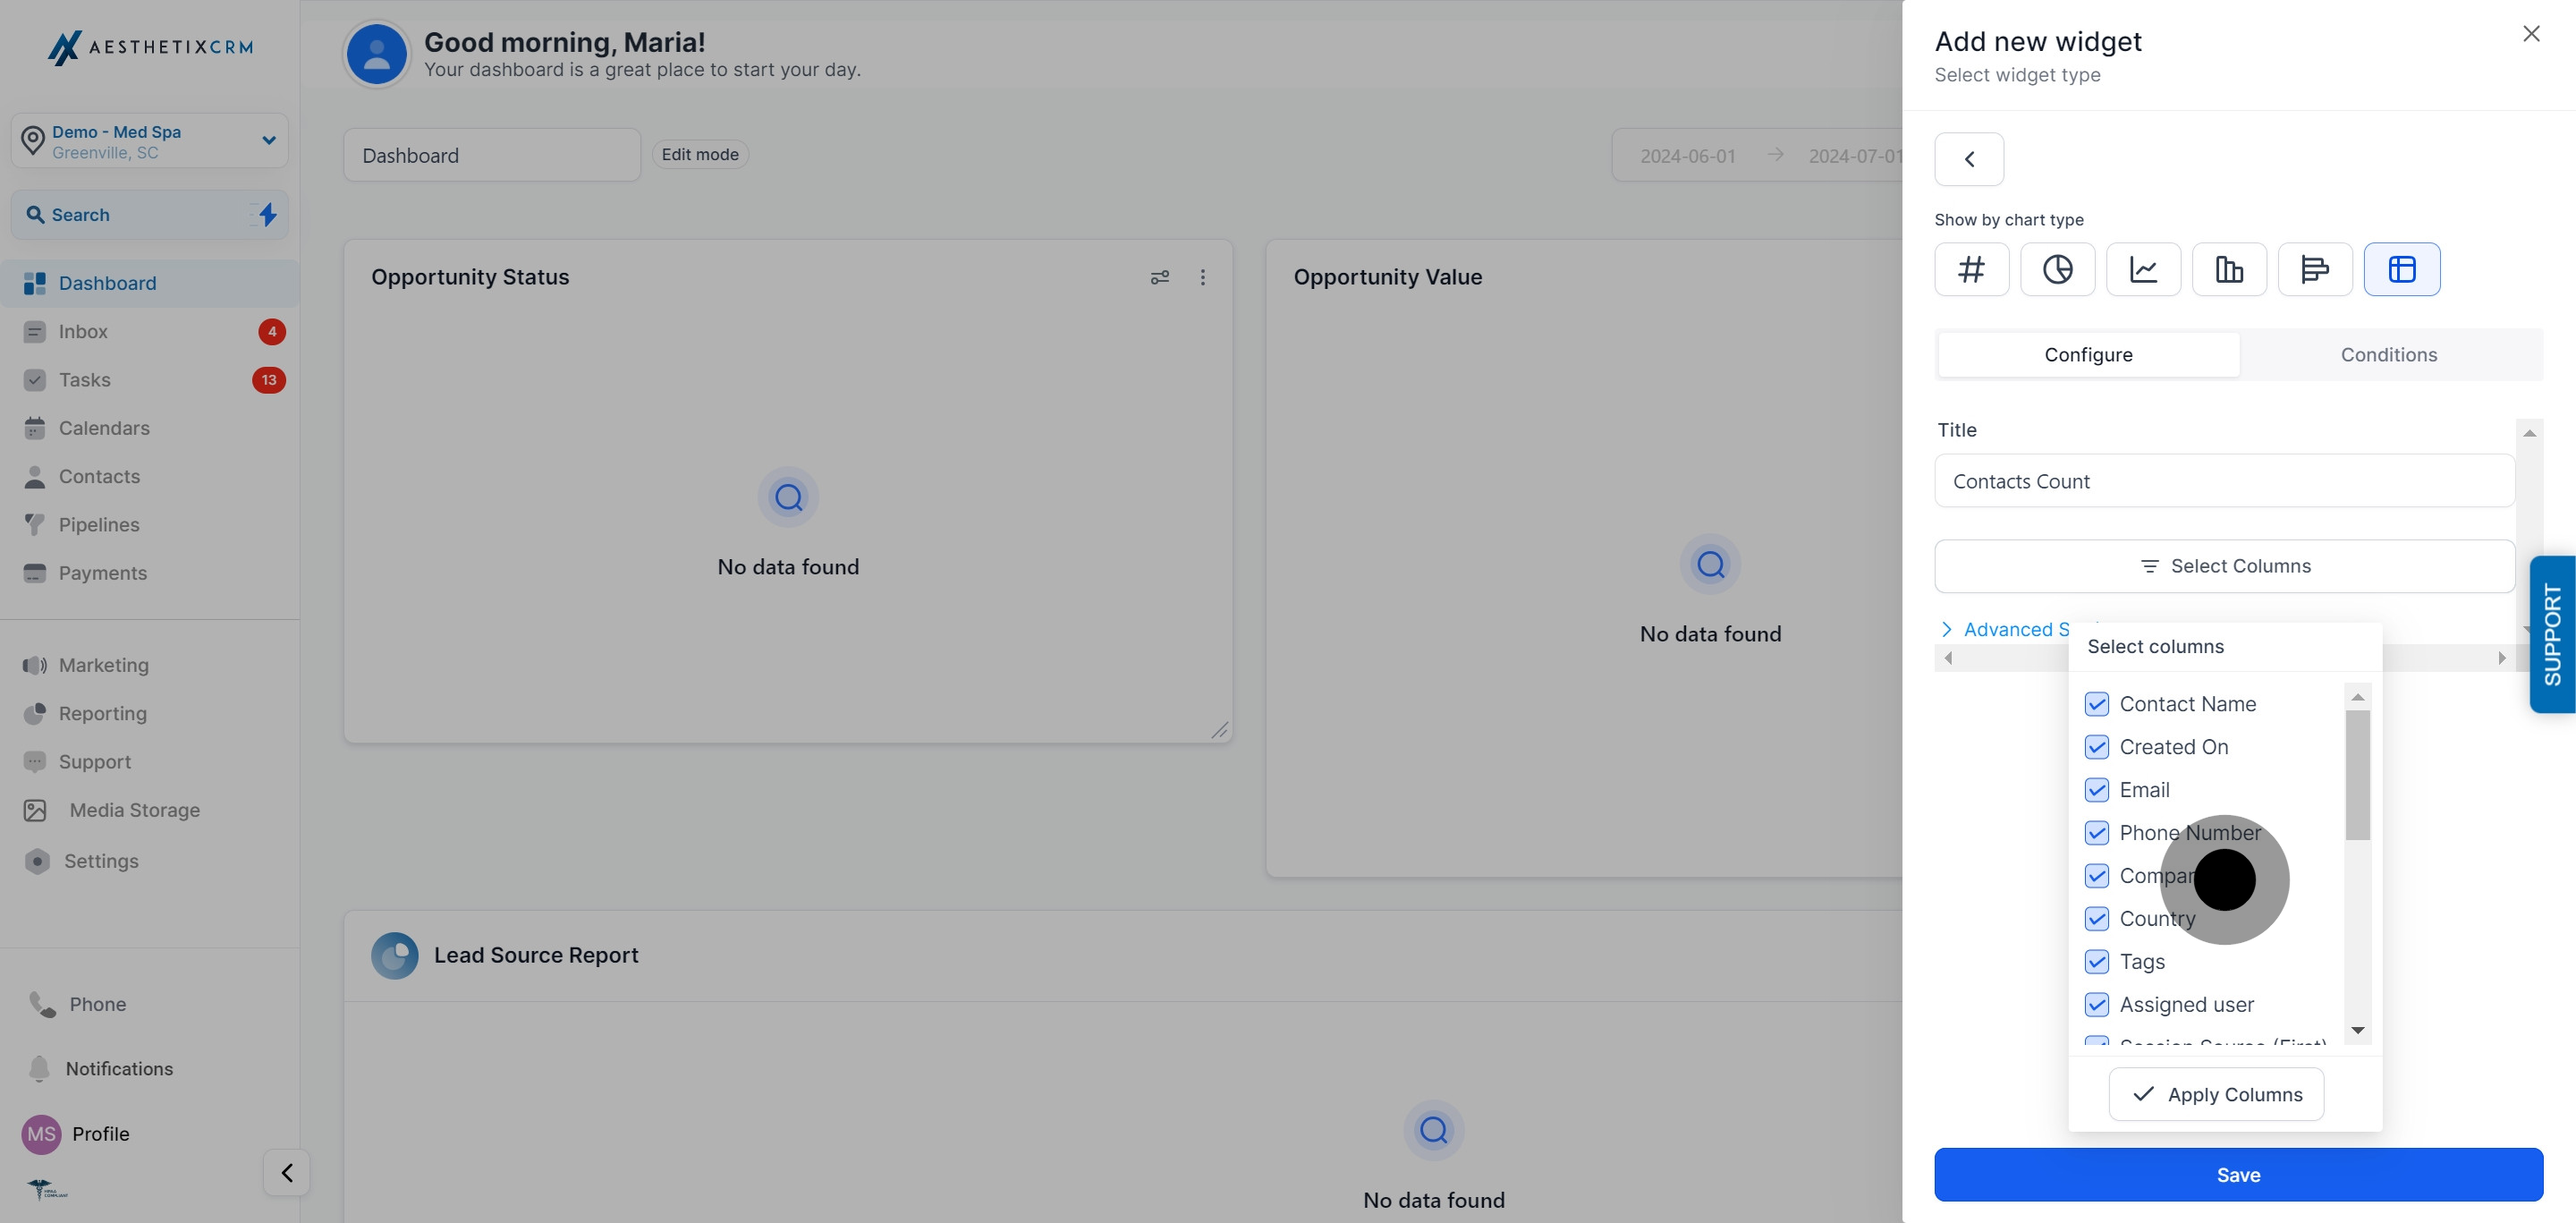
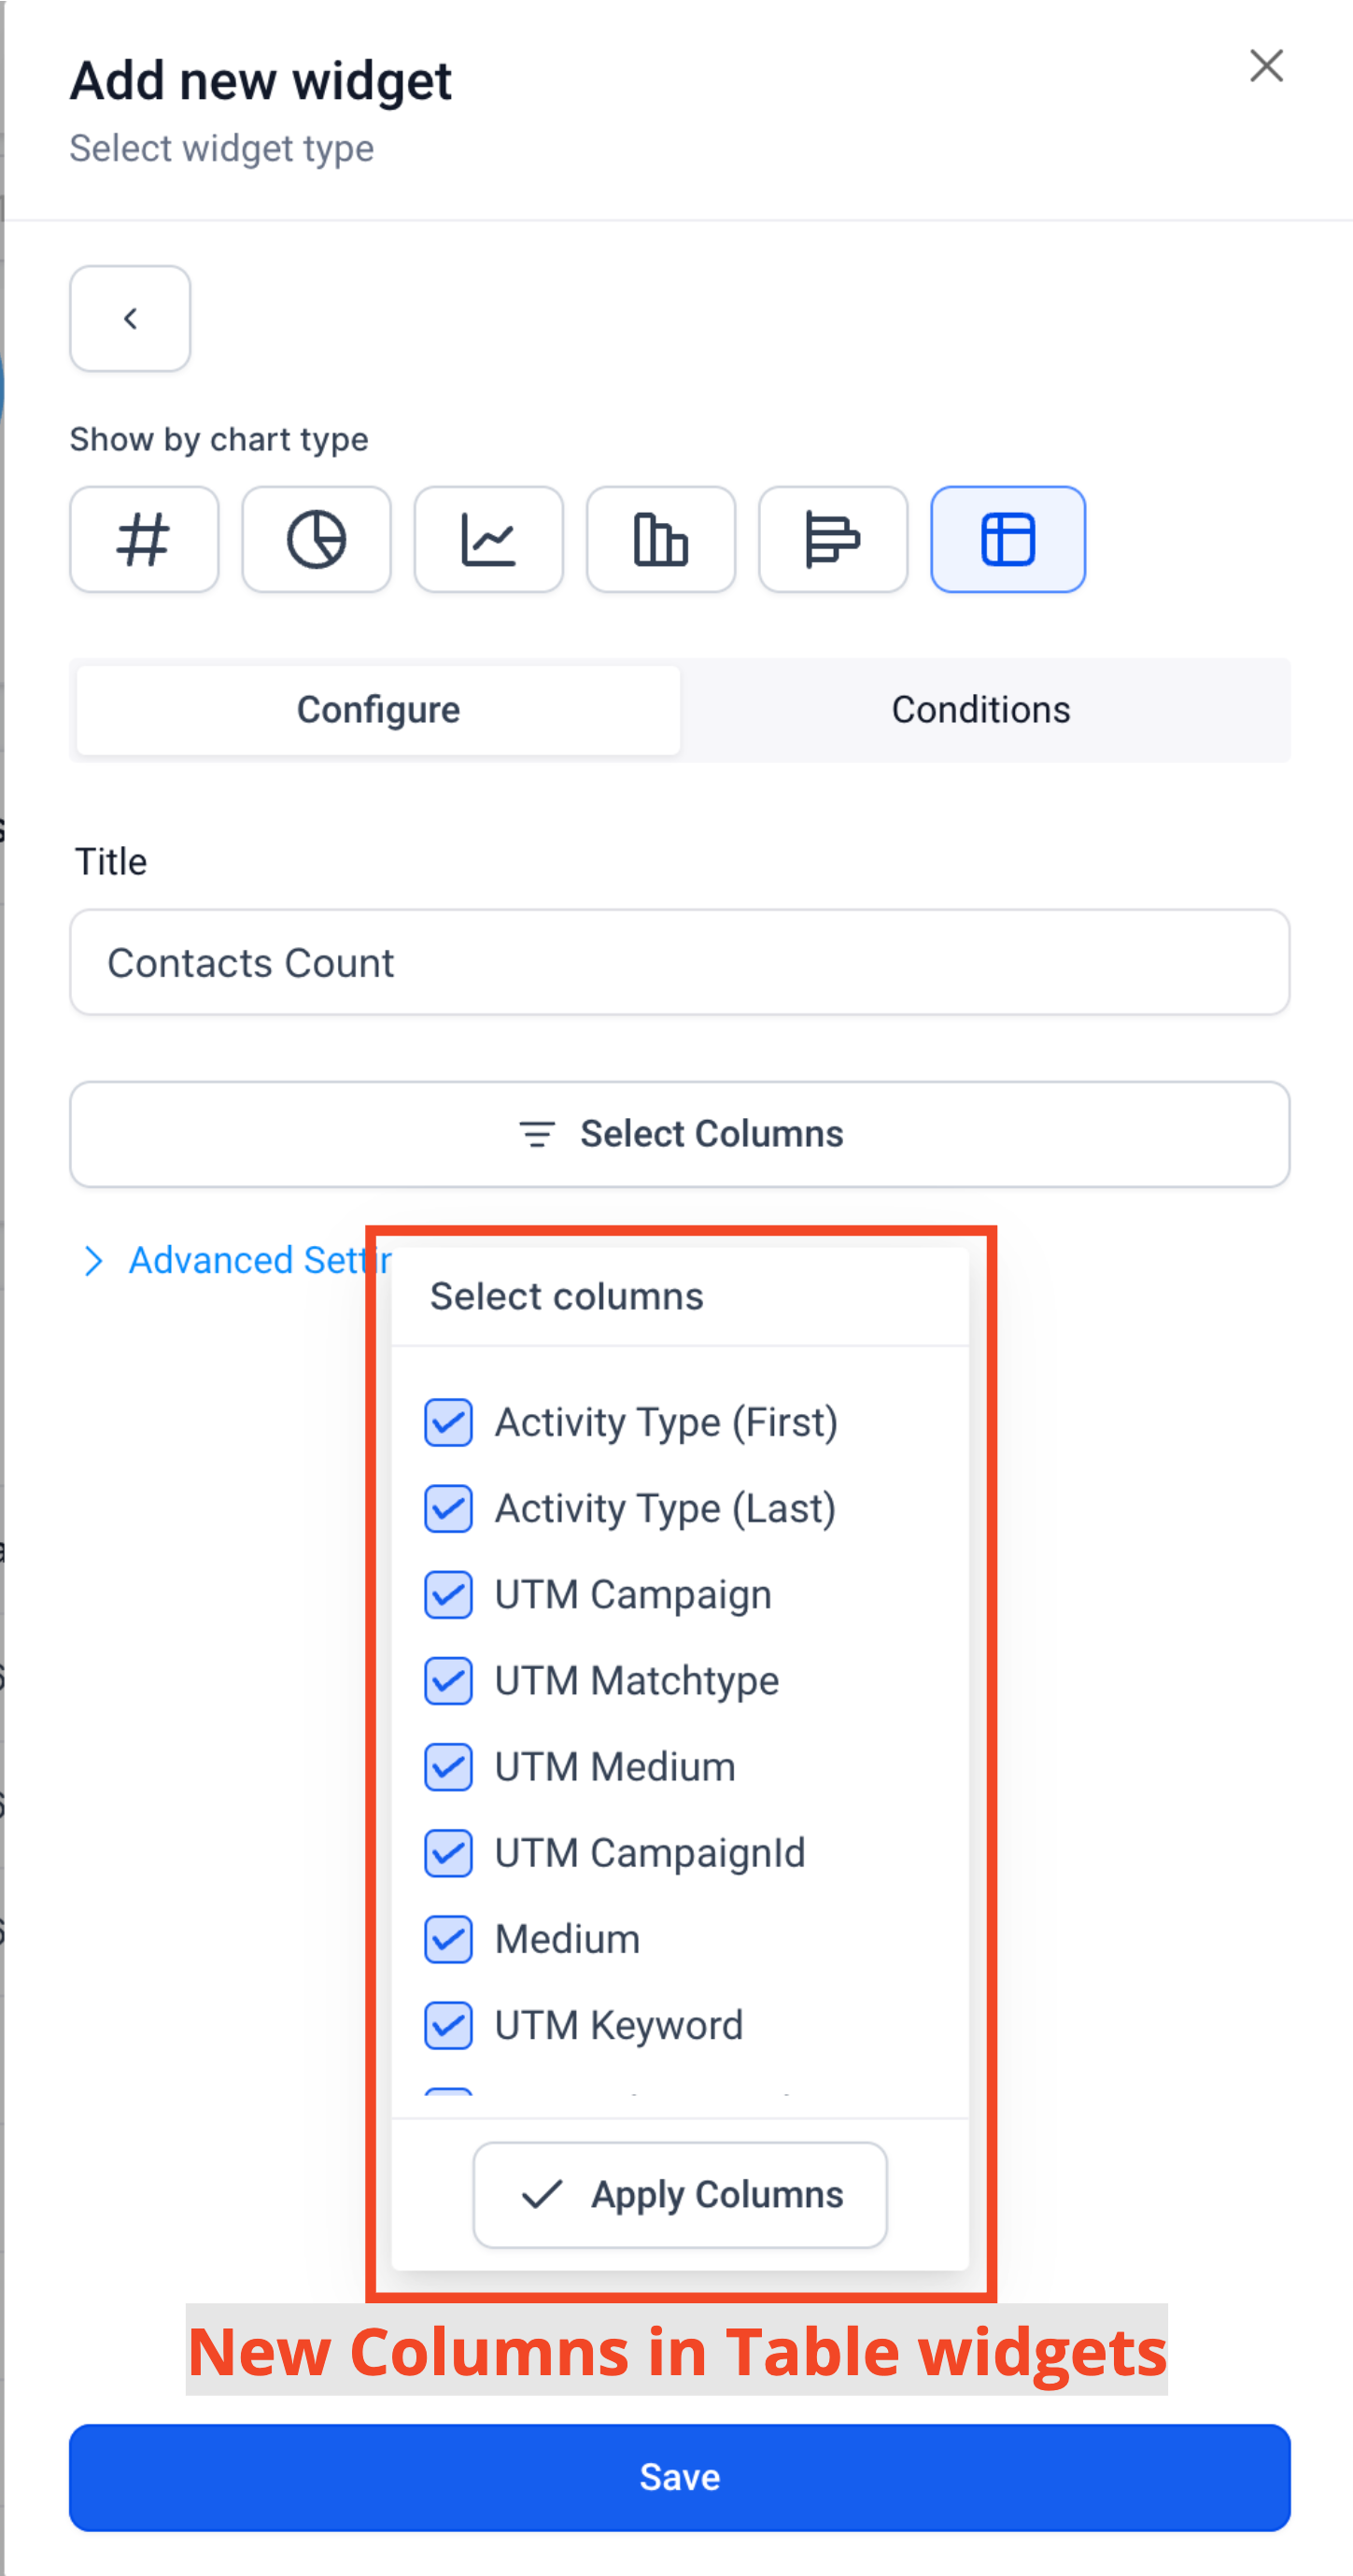
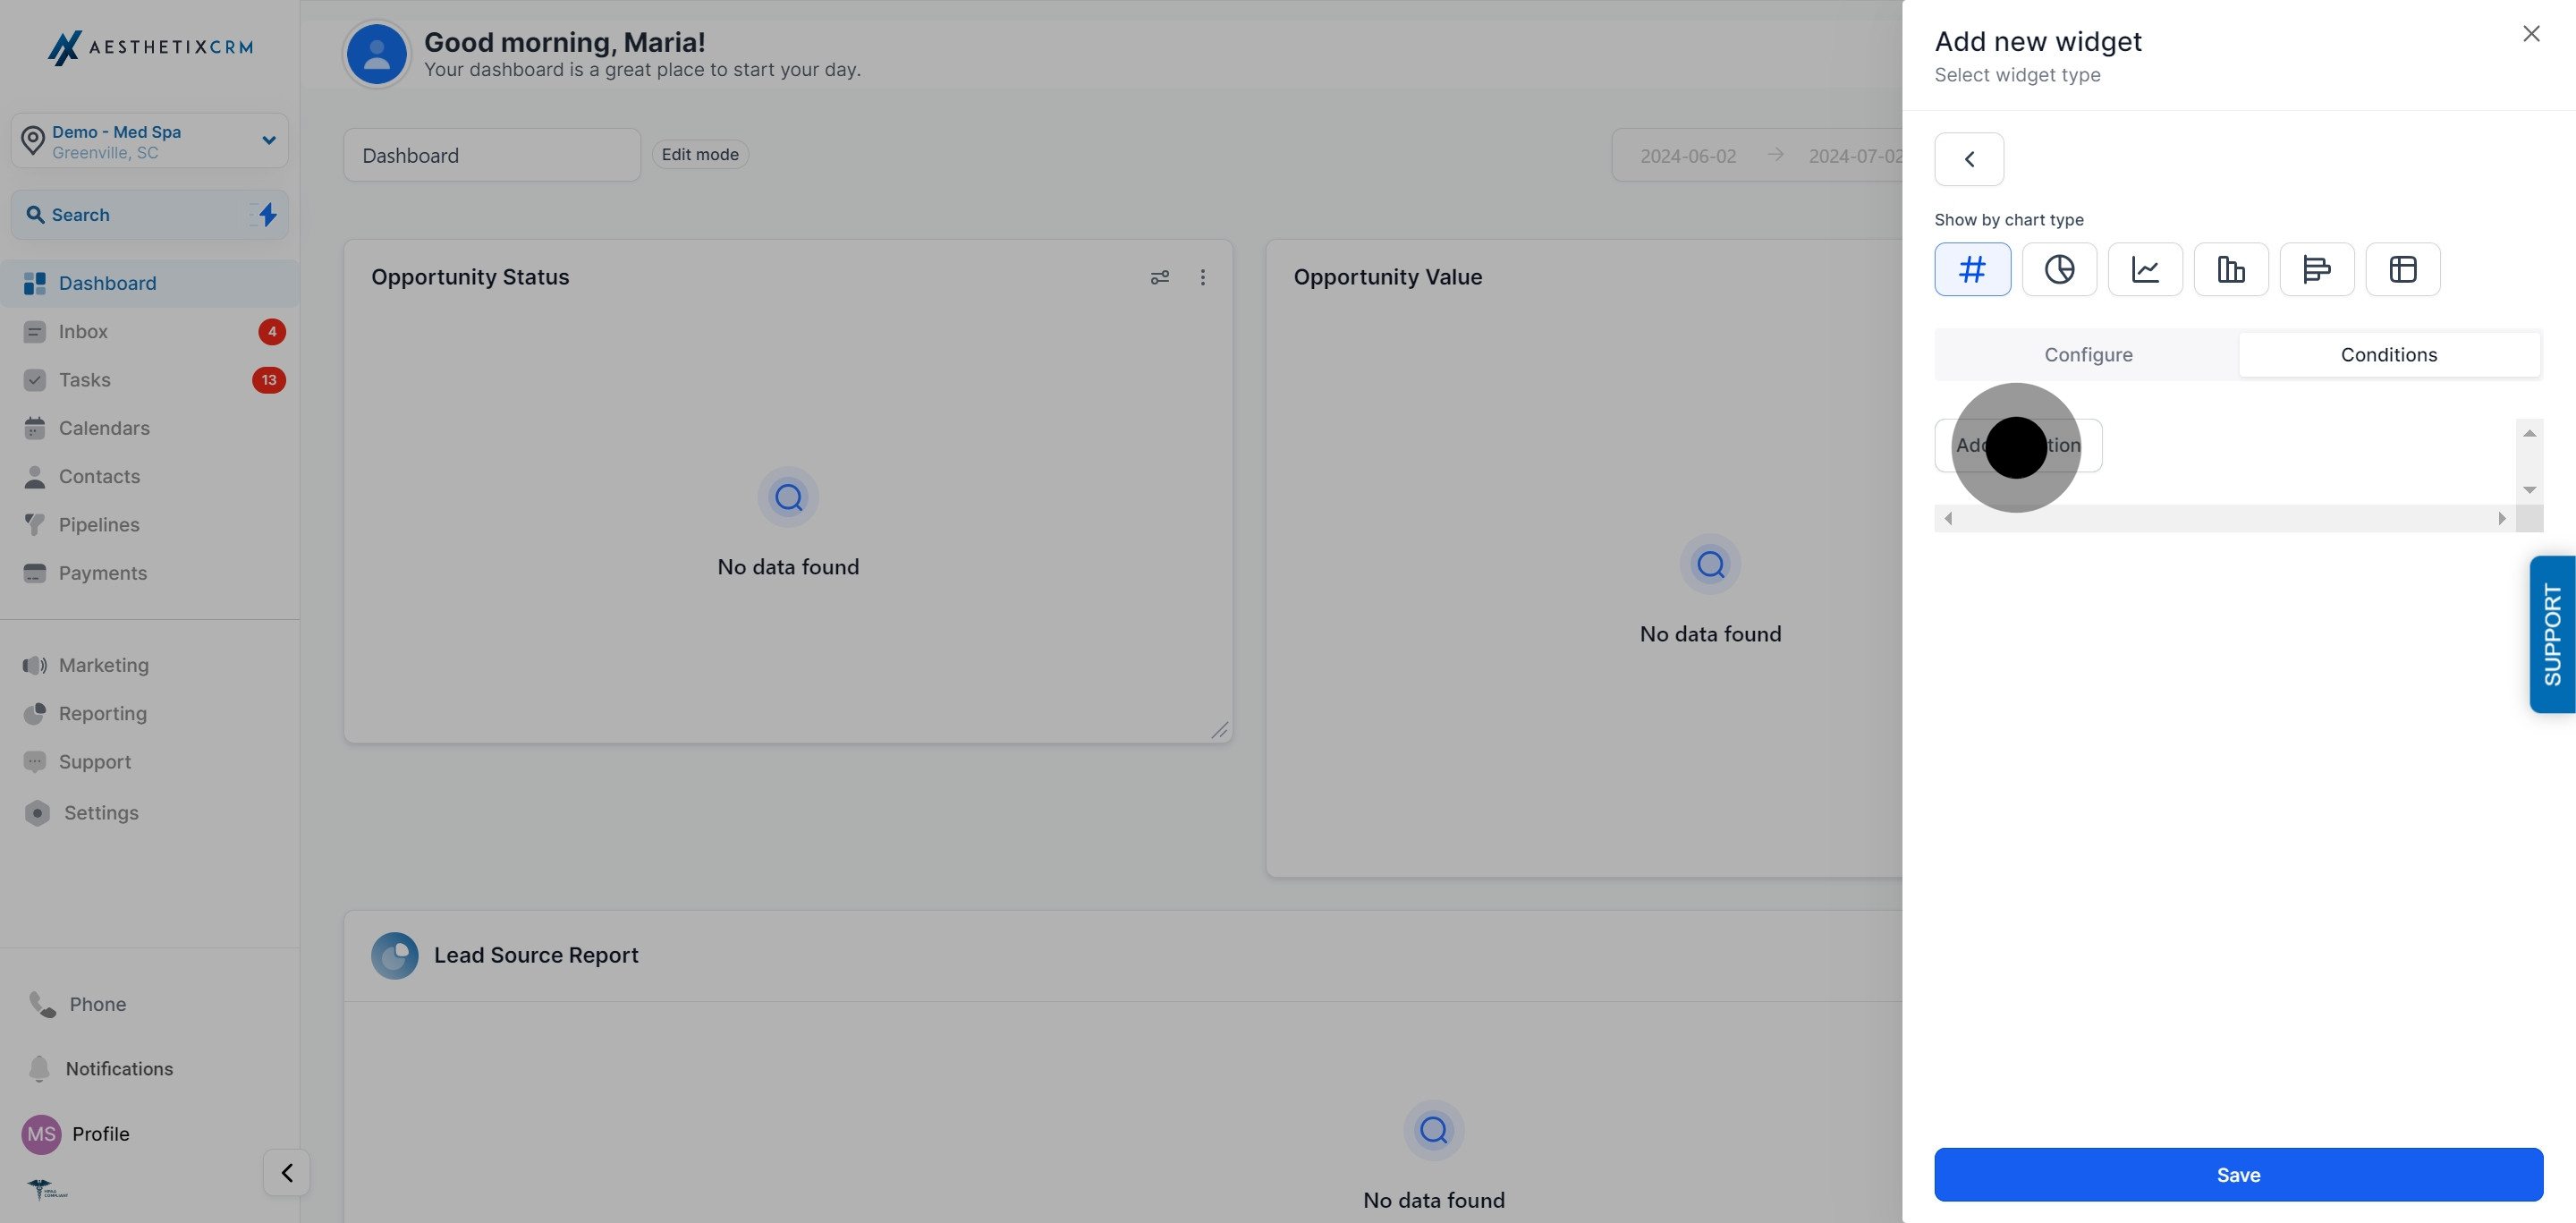
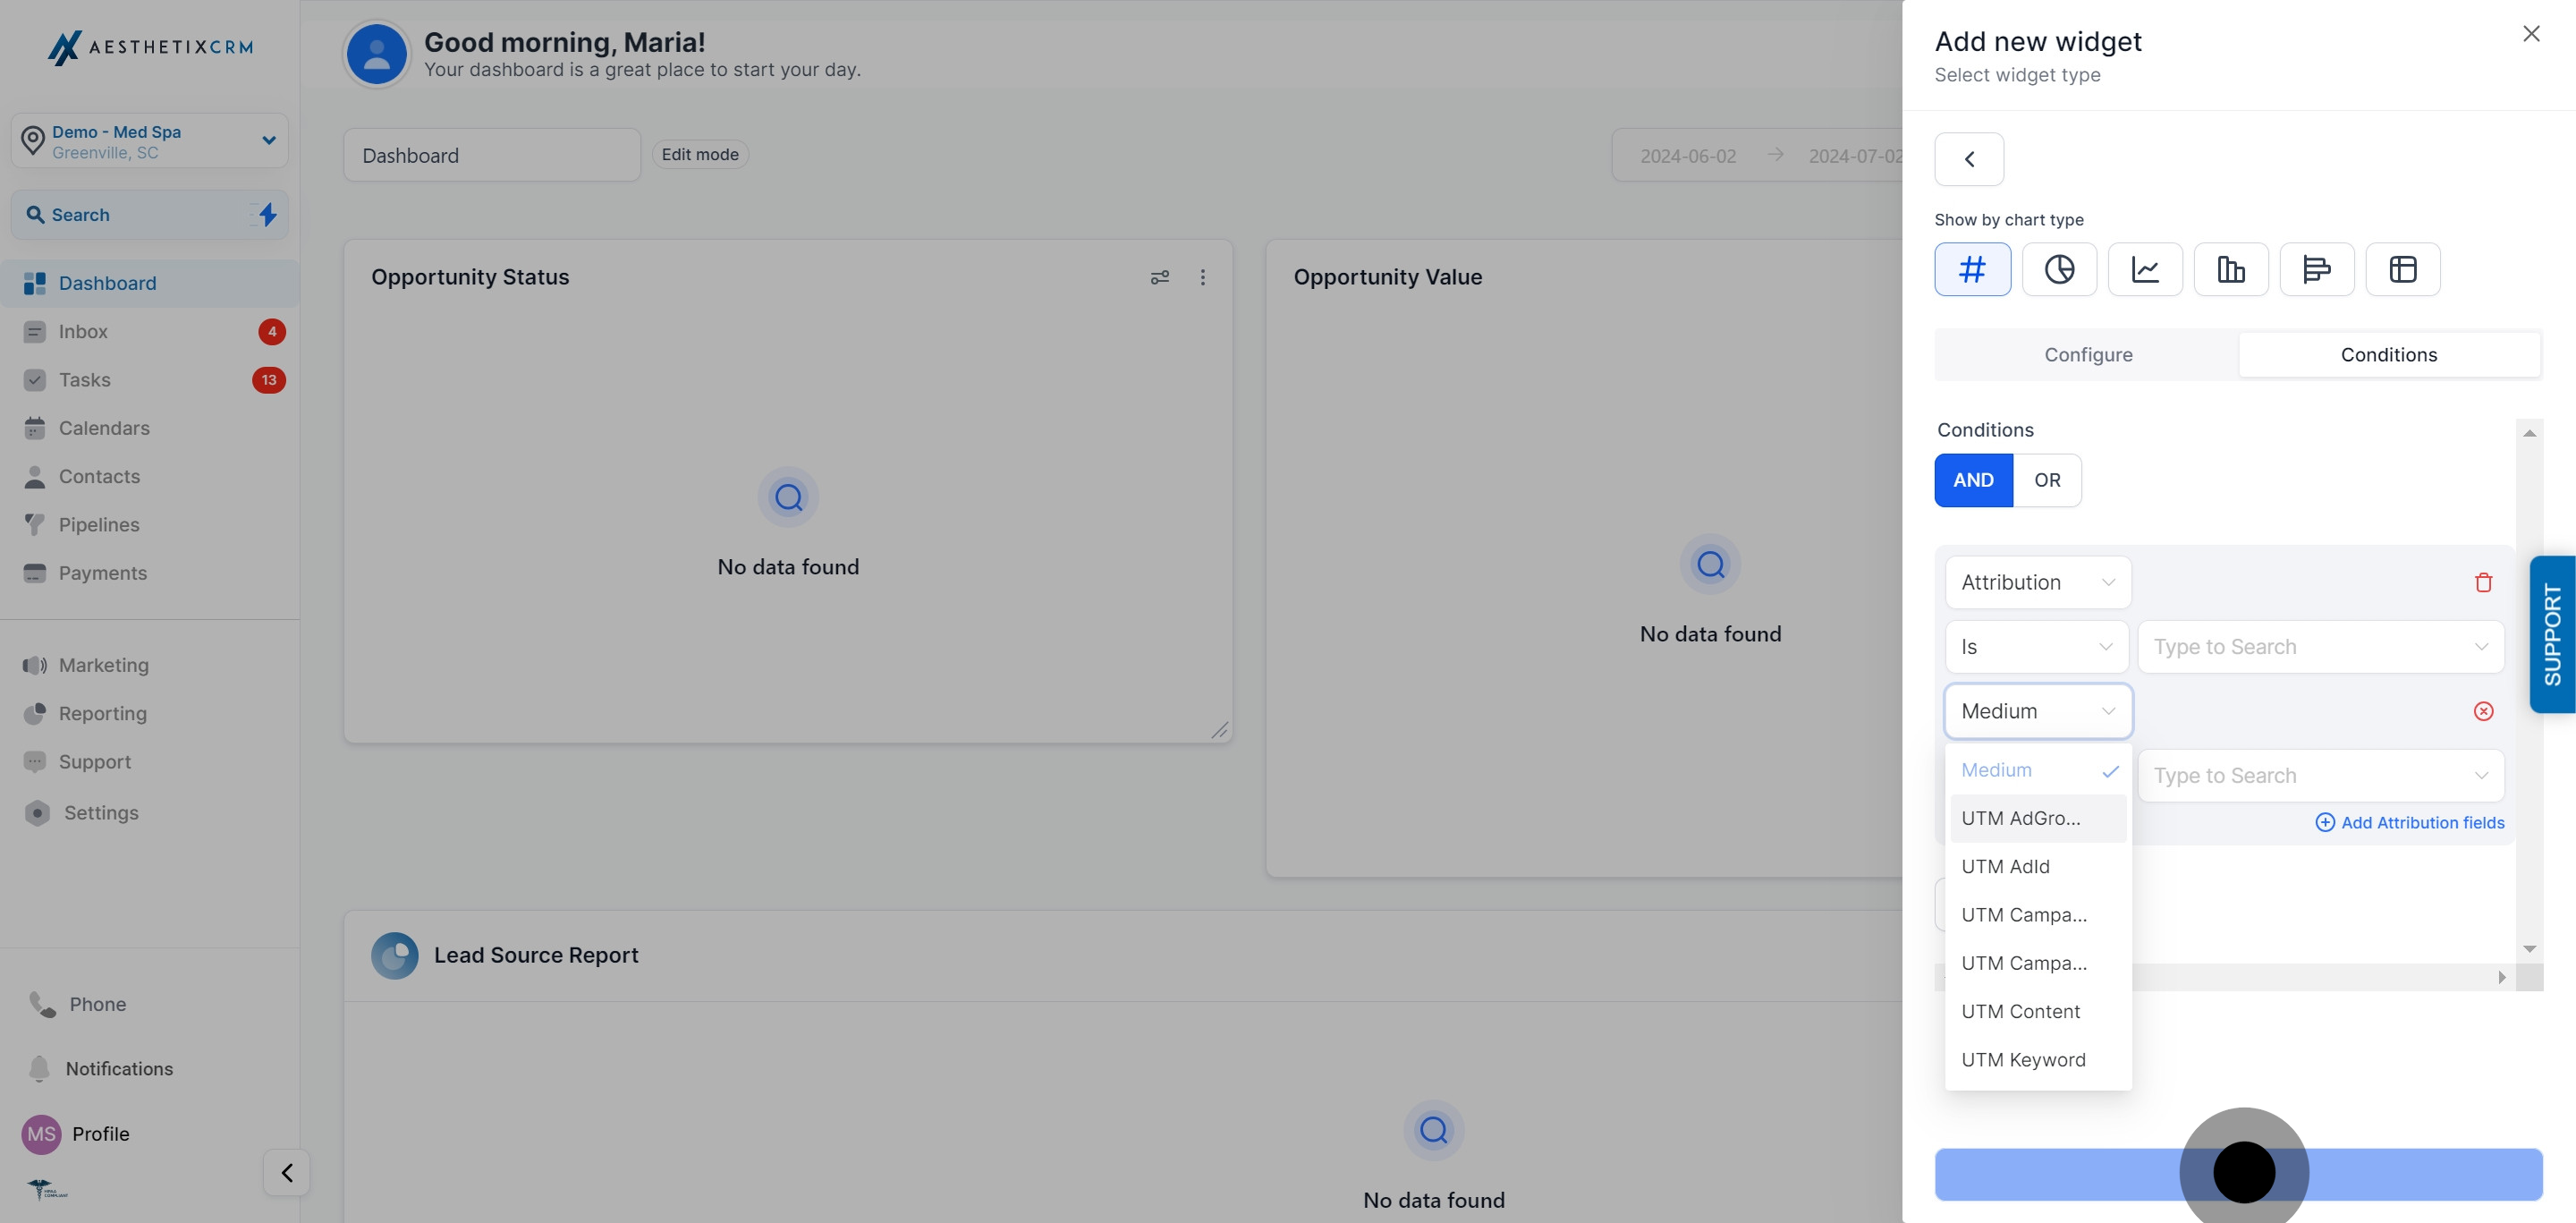
UTM columns and fields only show up in the table and in Granular Insights if an Attribution type (First or Latest) has also been added under the widget's Conditions tab, so add that condition first if the columns aren't appearing.
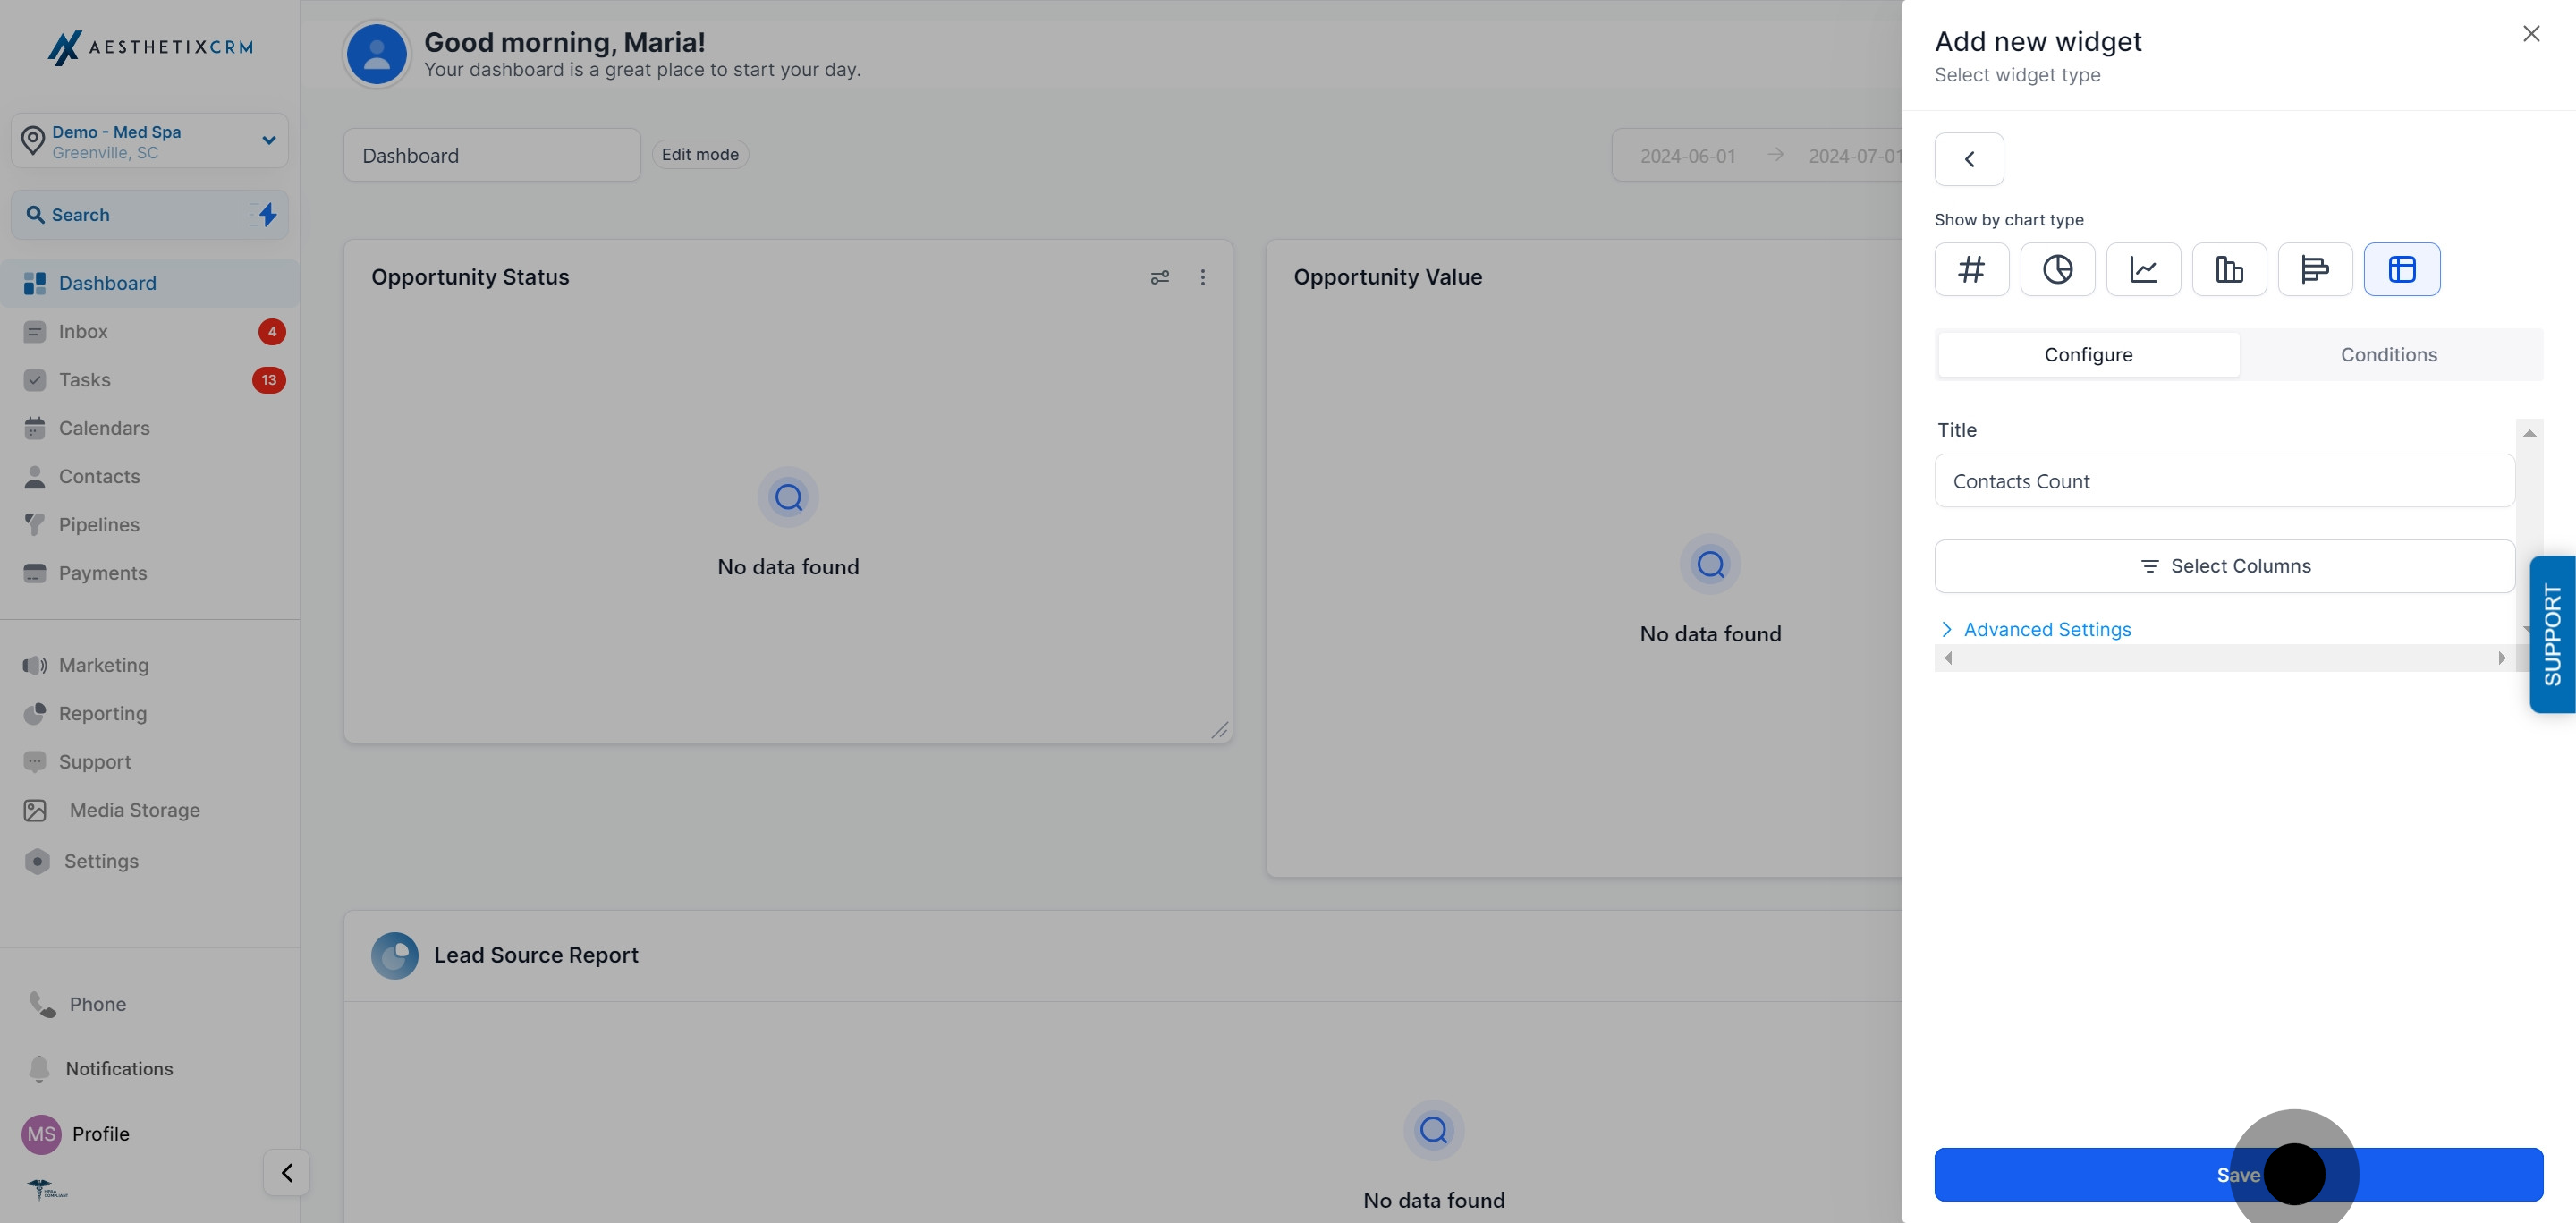
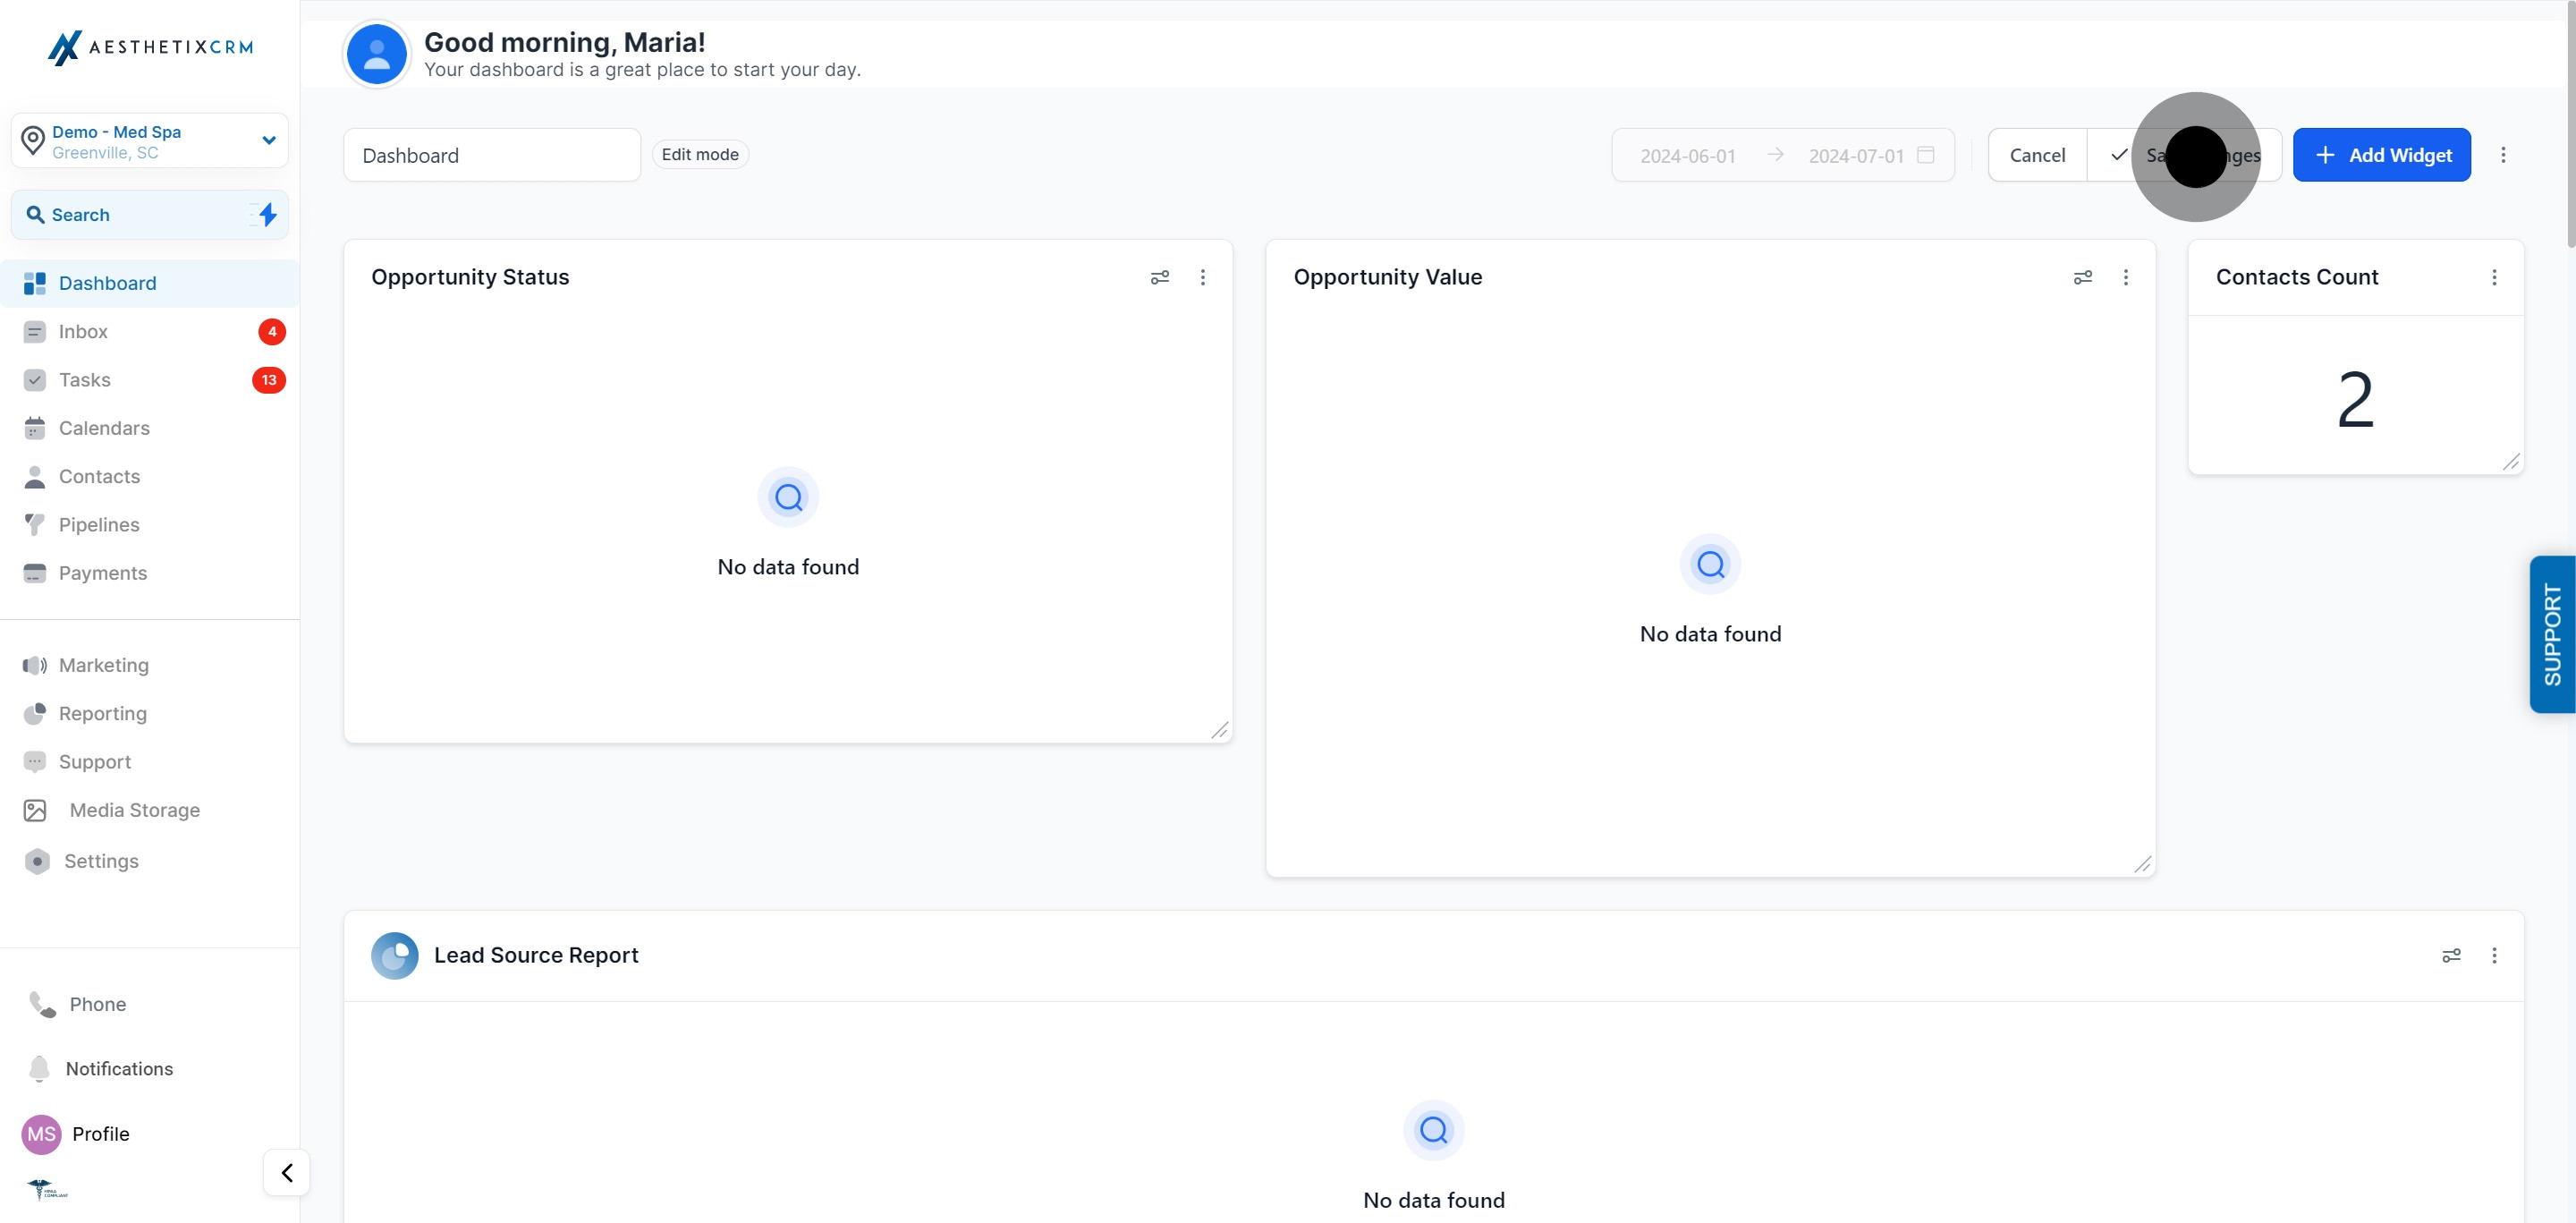
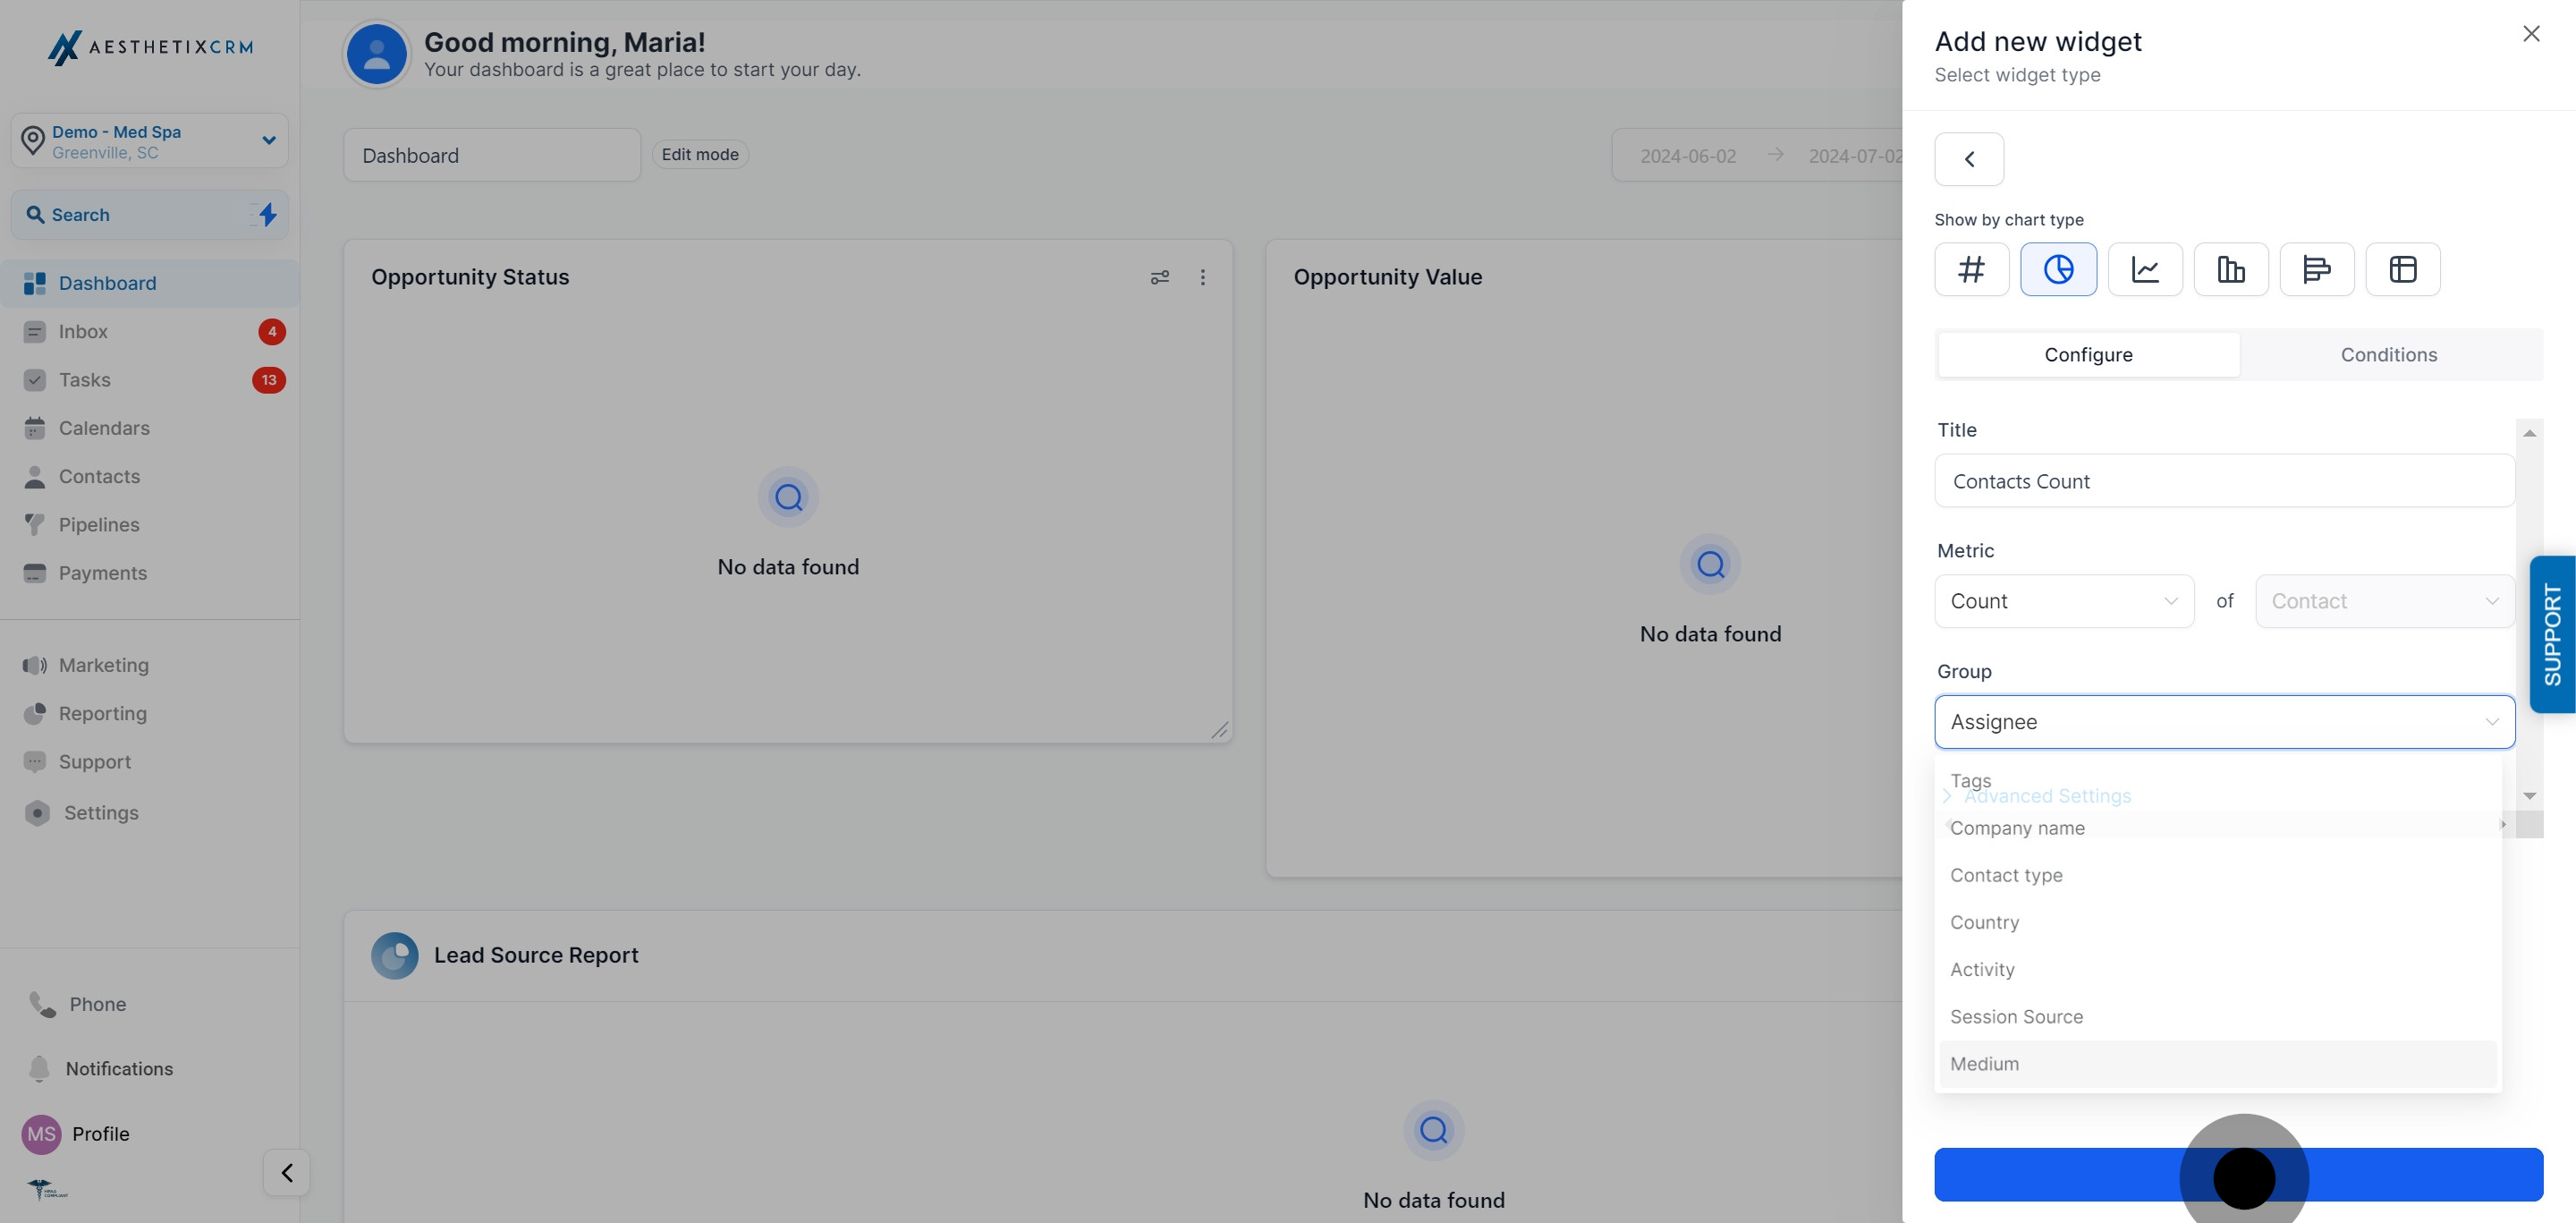
Use this when you want a visual breakdown, at a glance, of what share of your leads or booked opportunities came from each channel, useful for a front-desk or marketing-review dashboard.
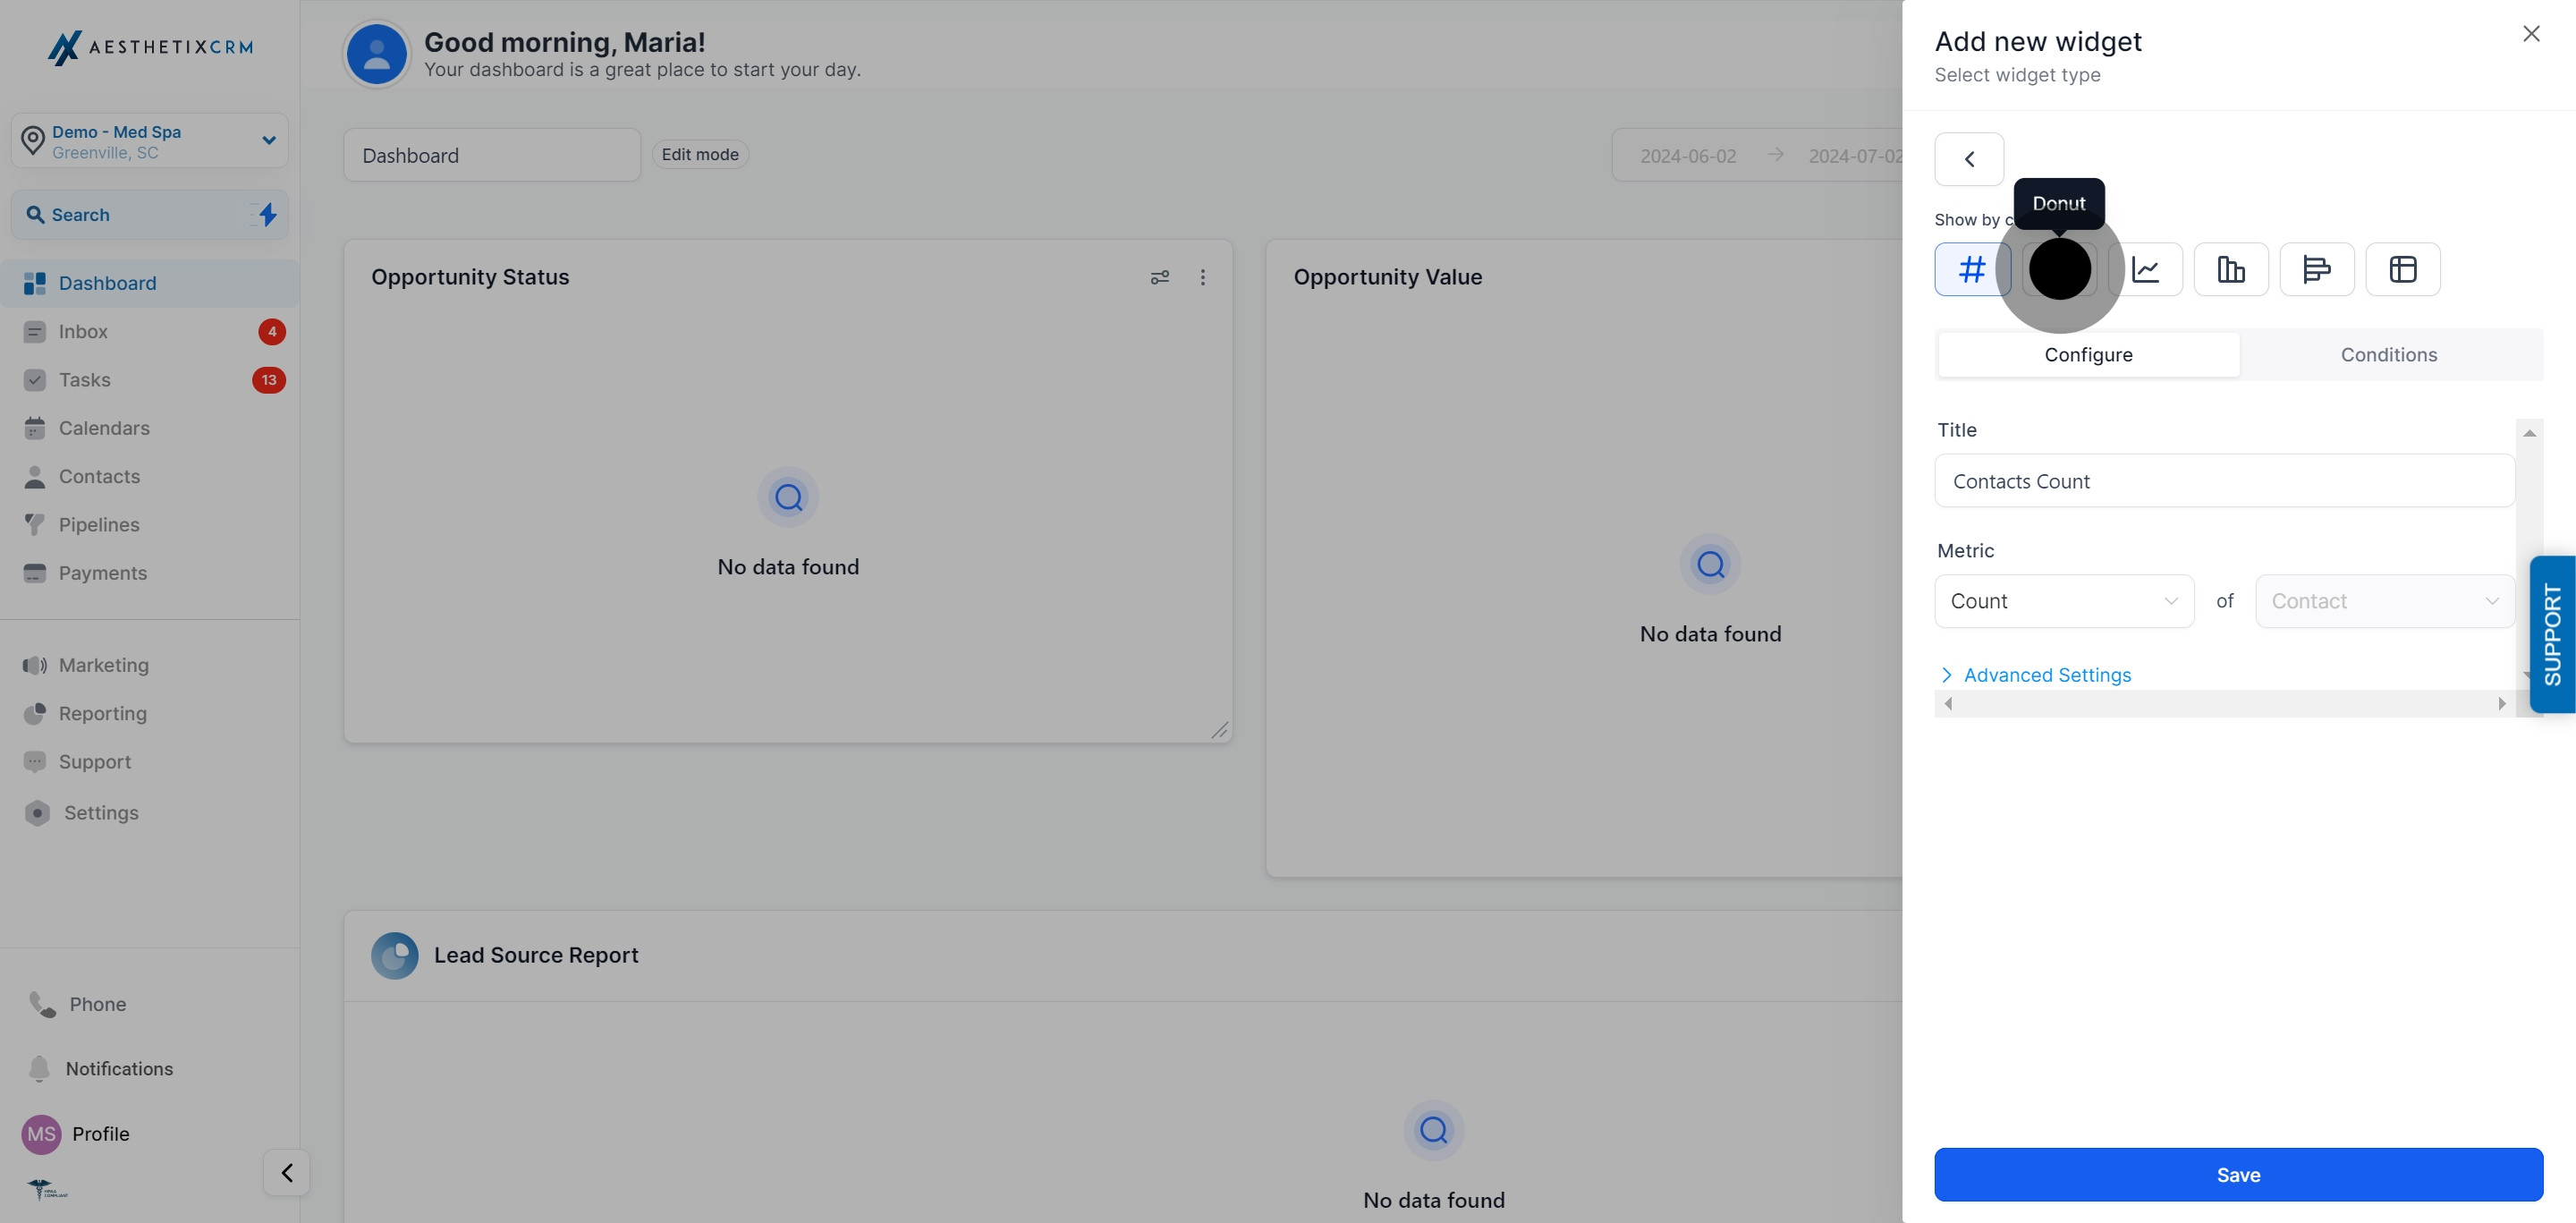
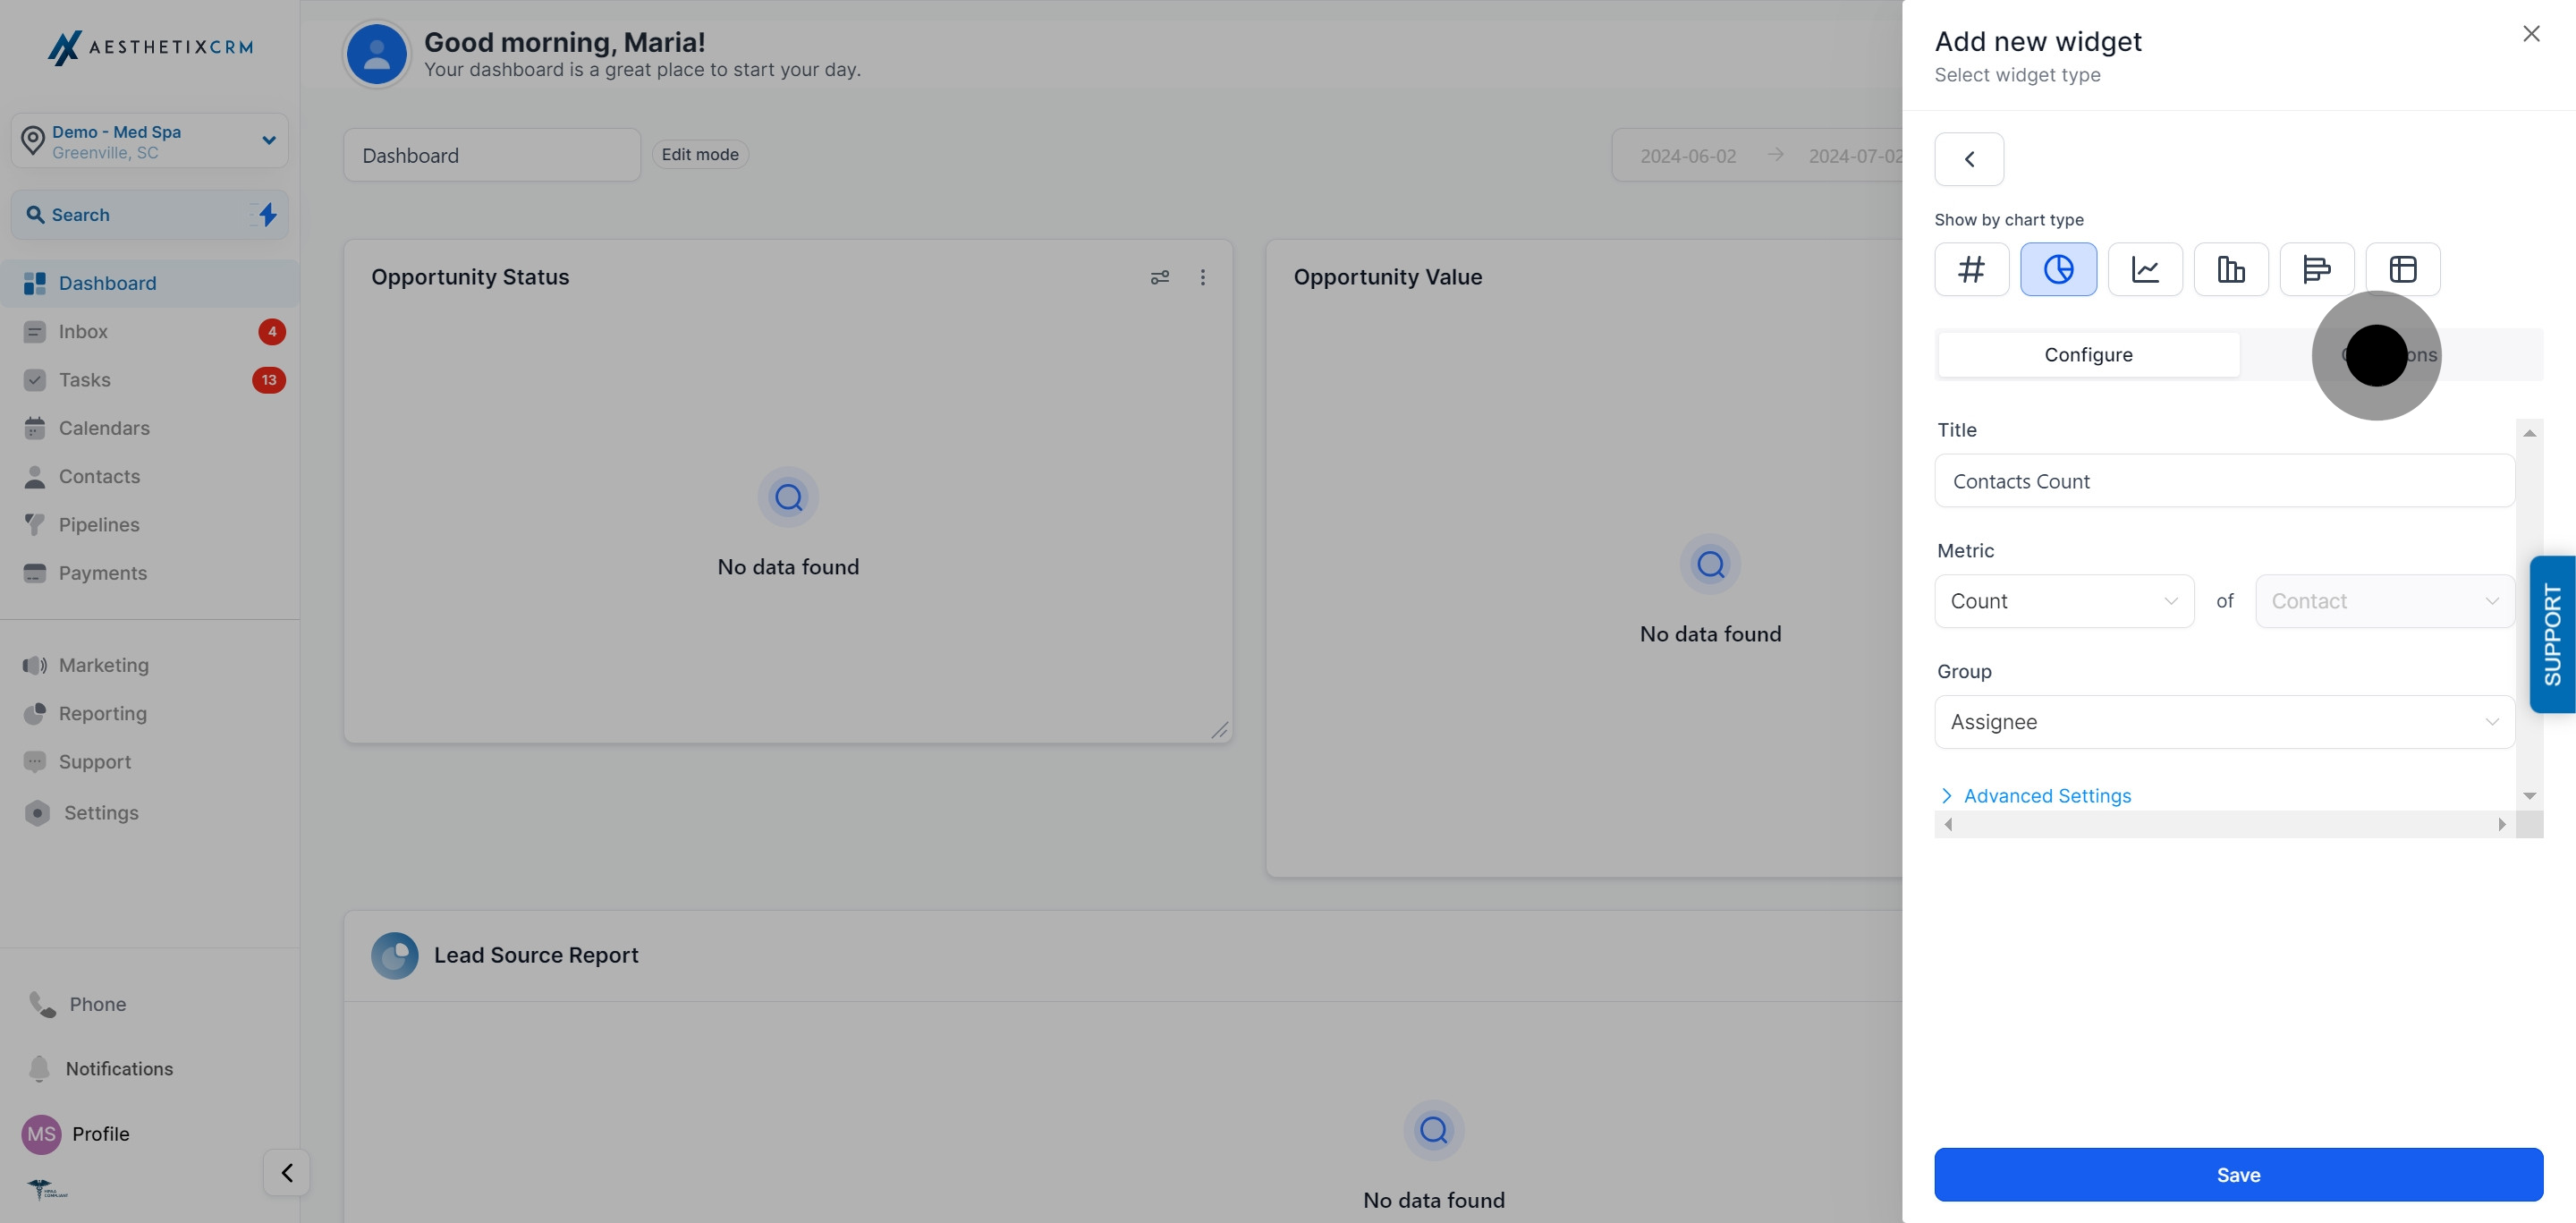
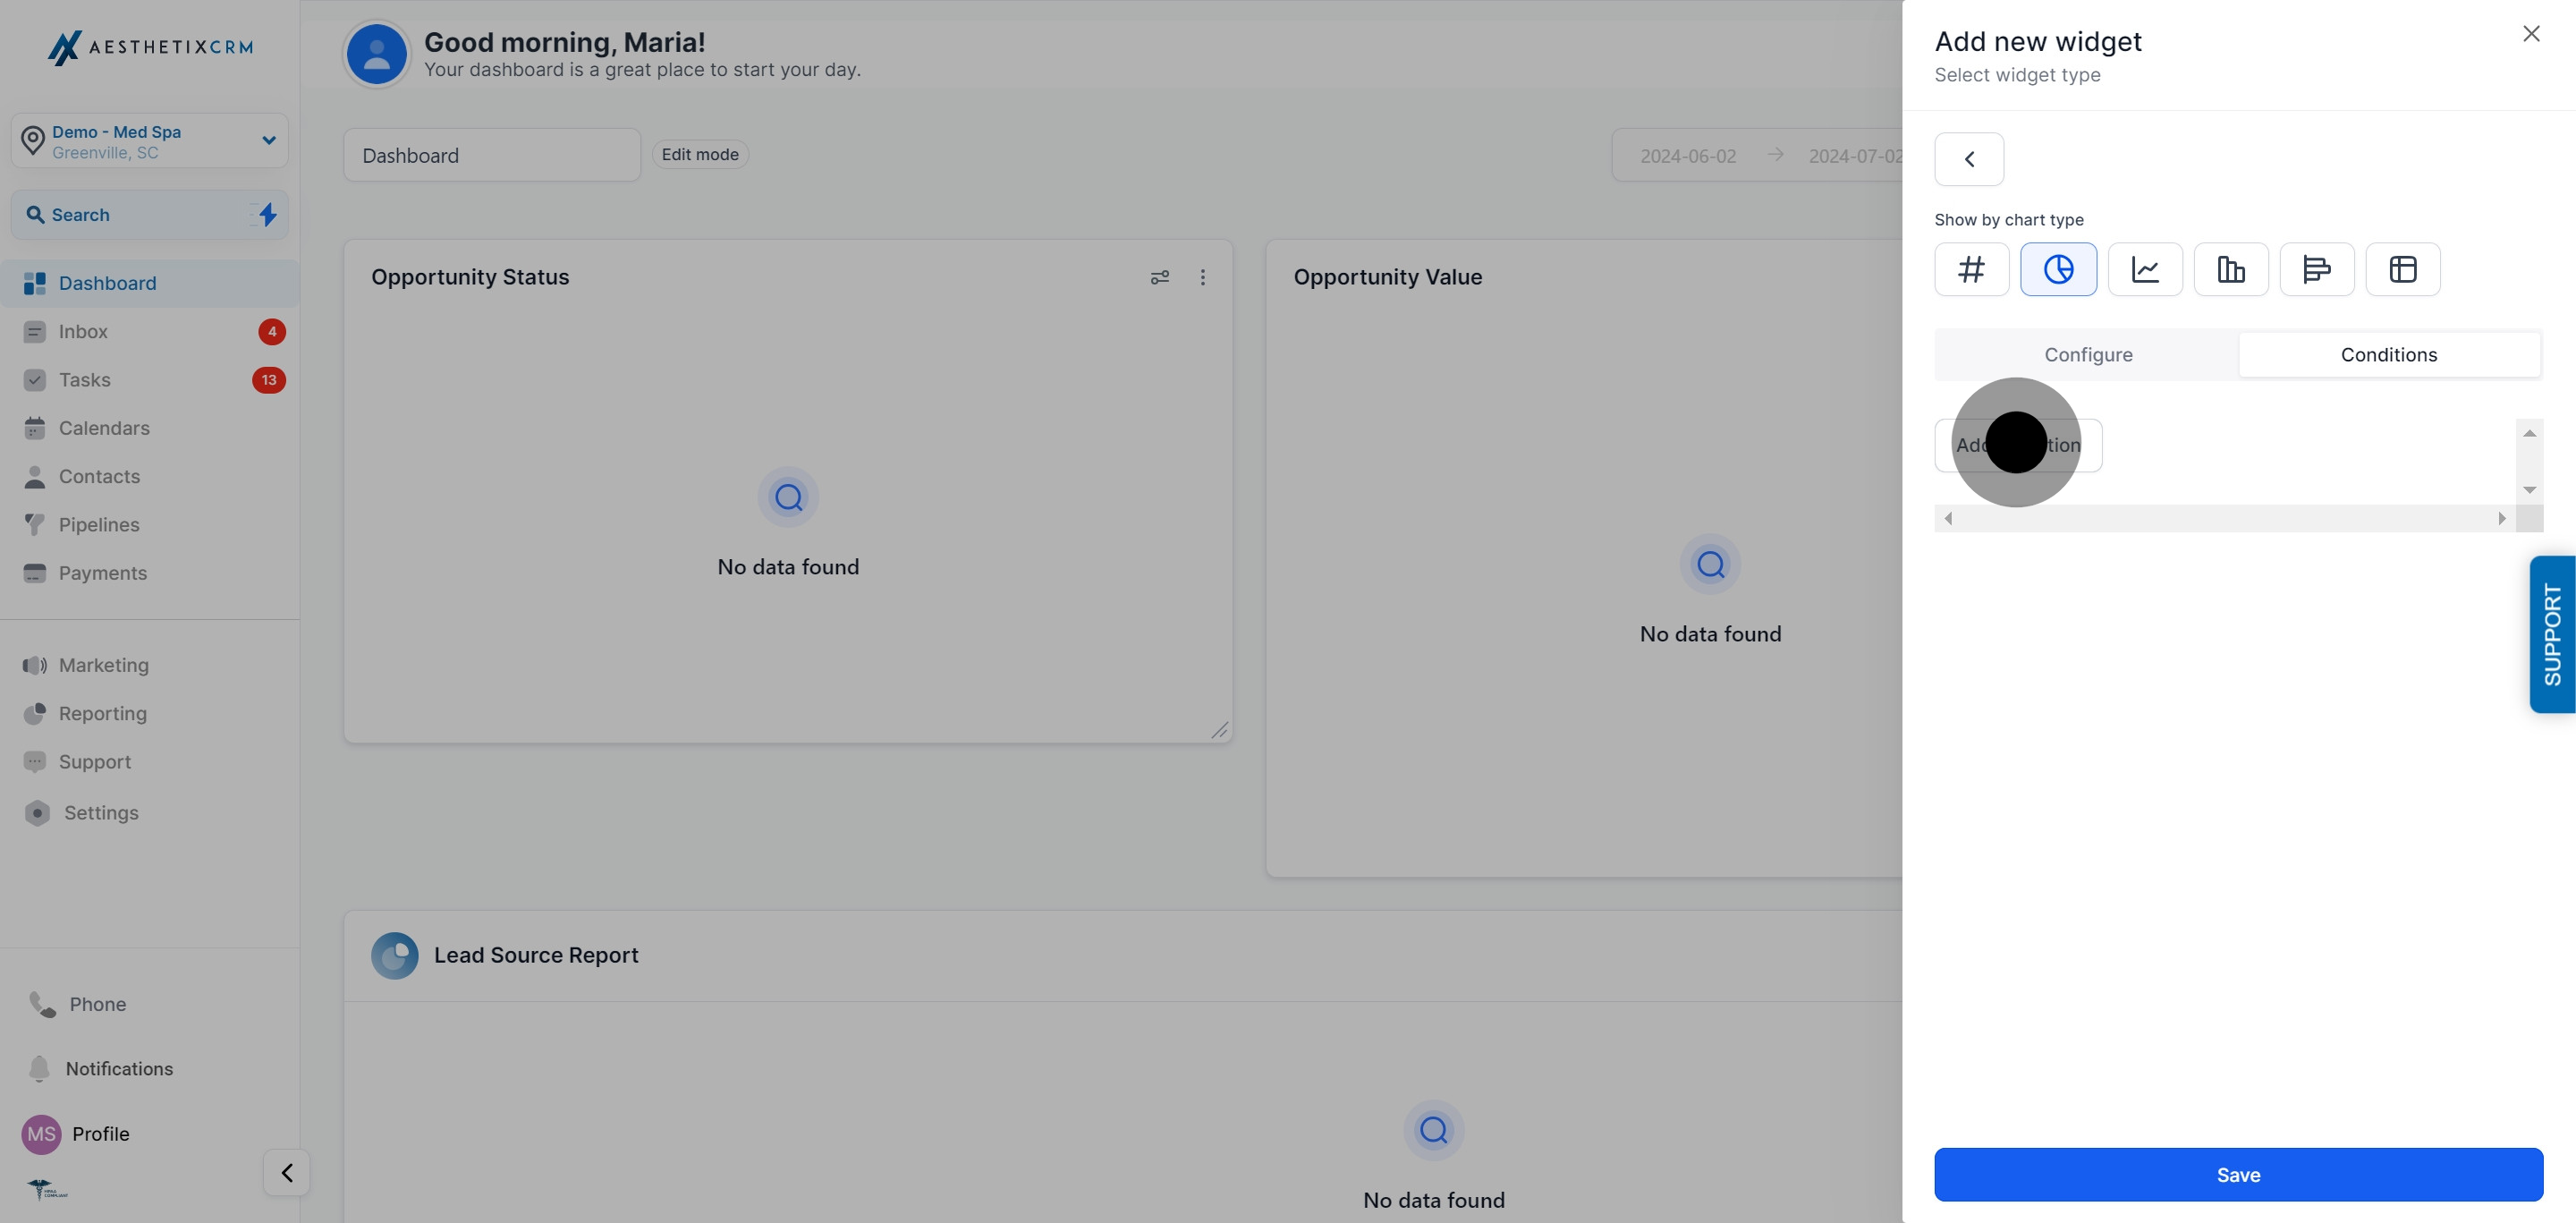
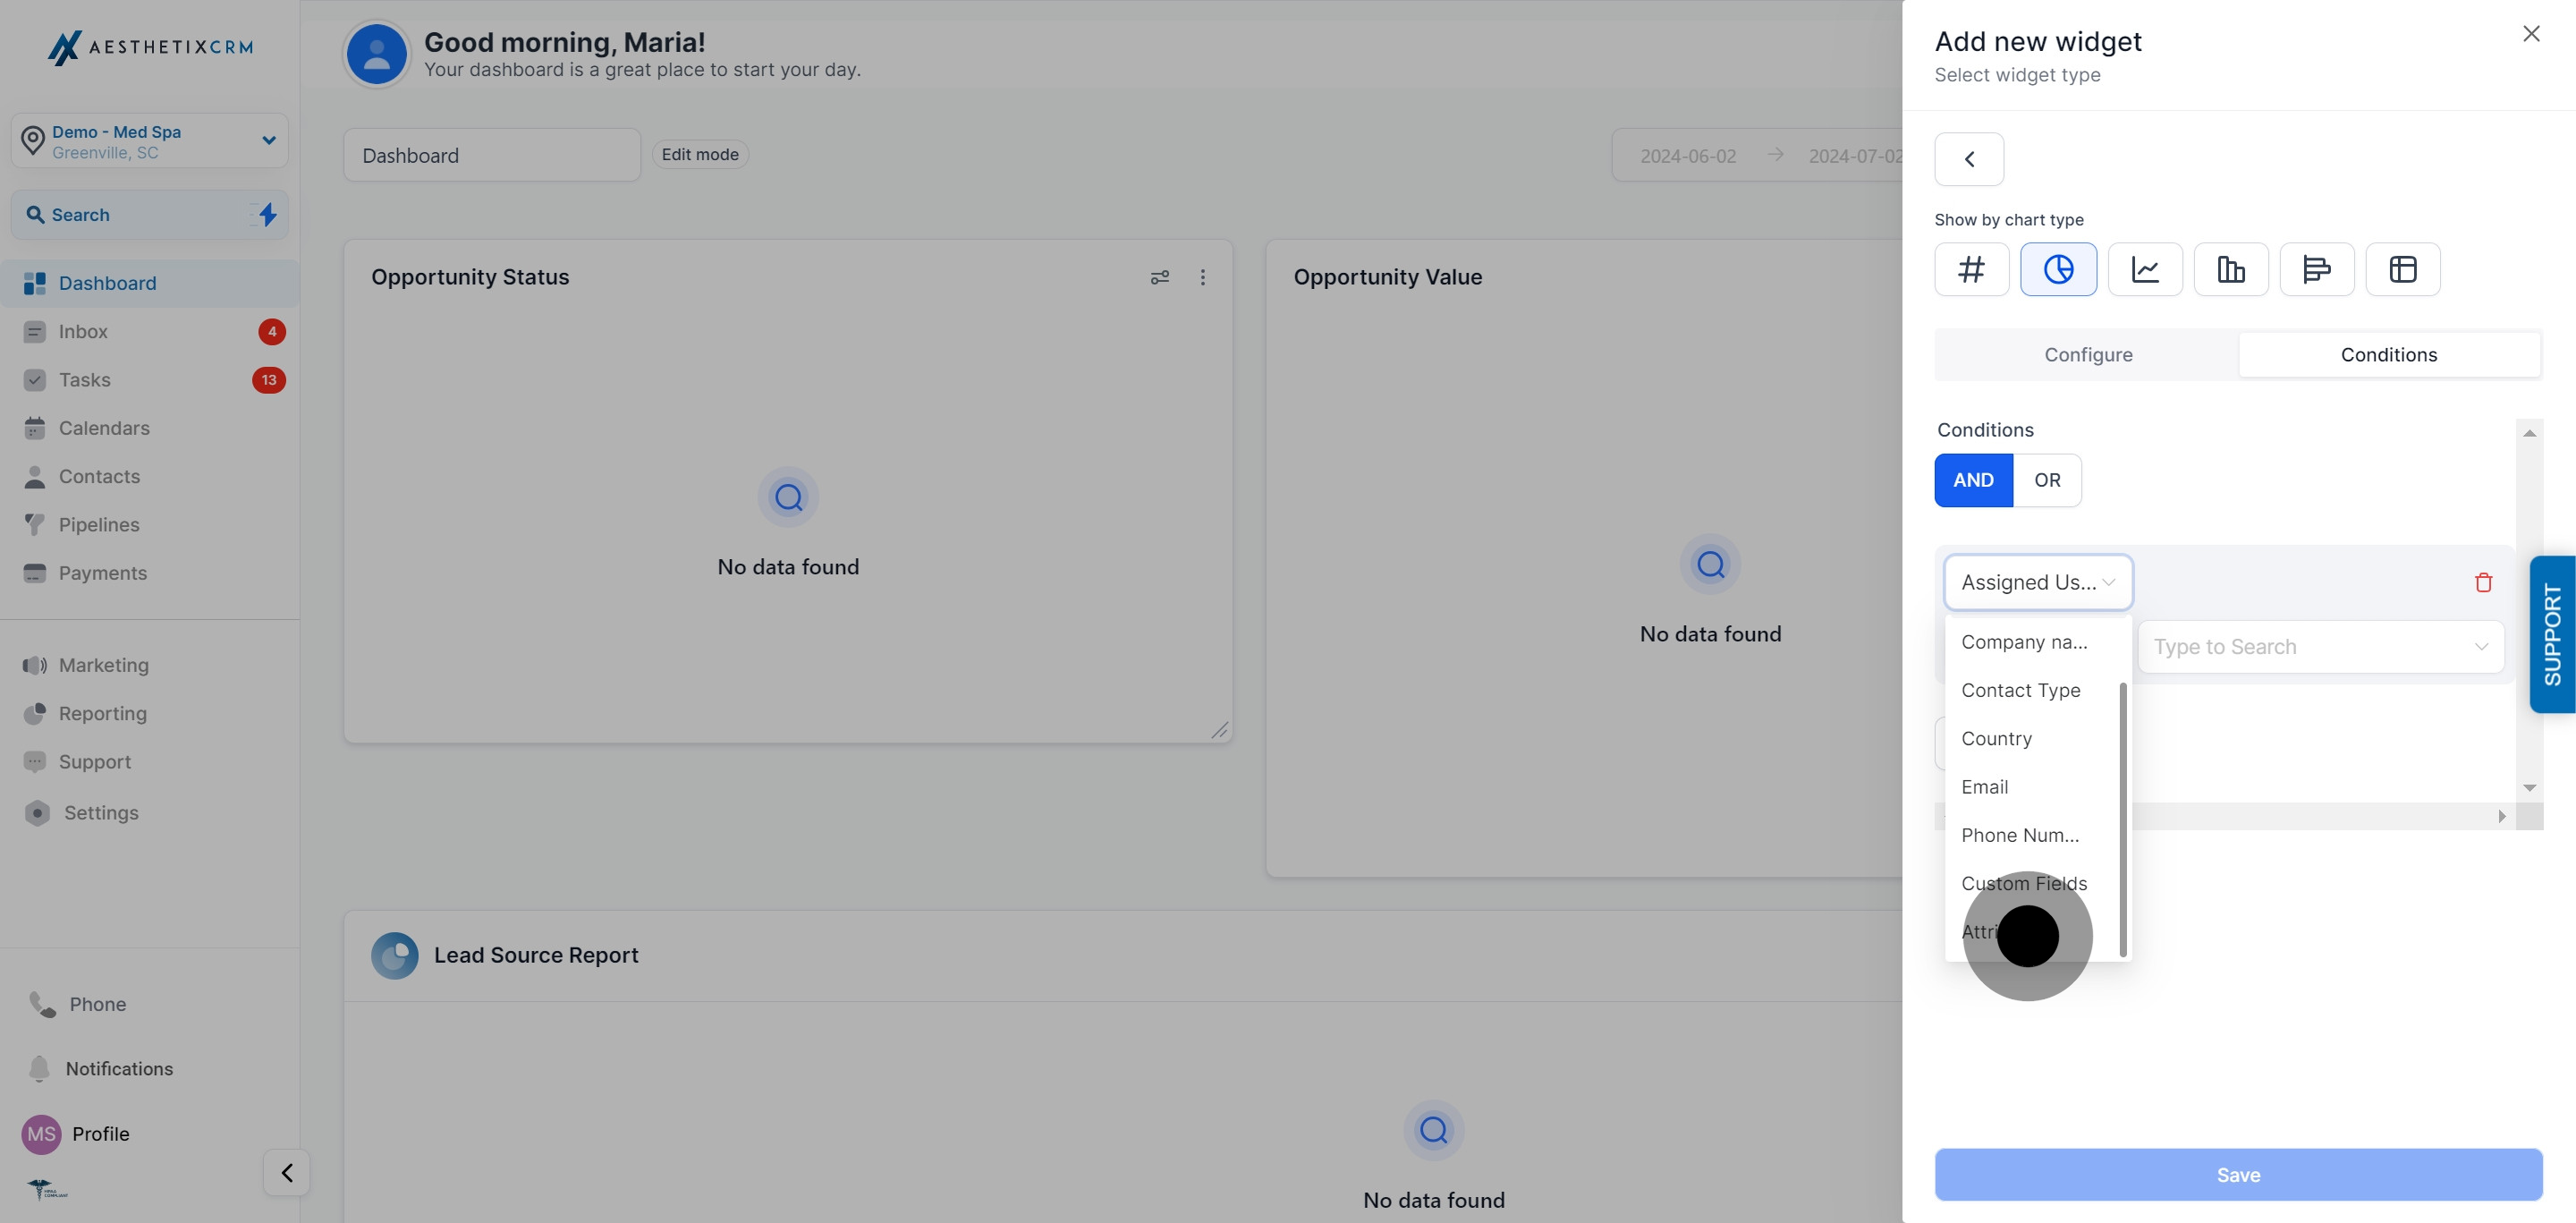
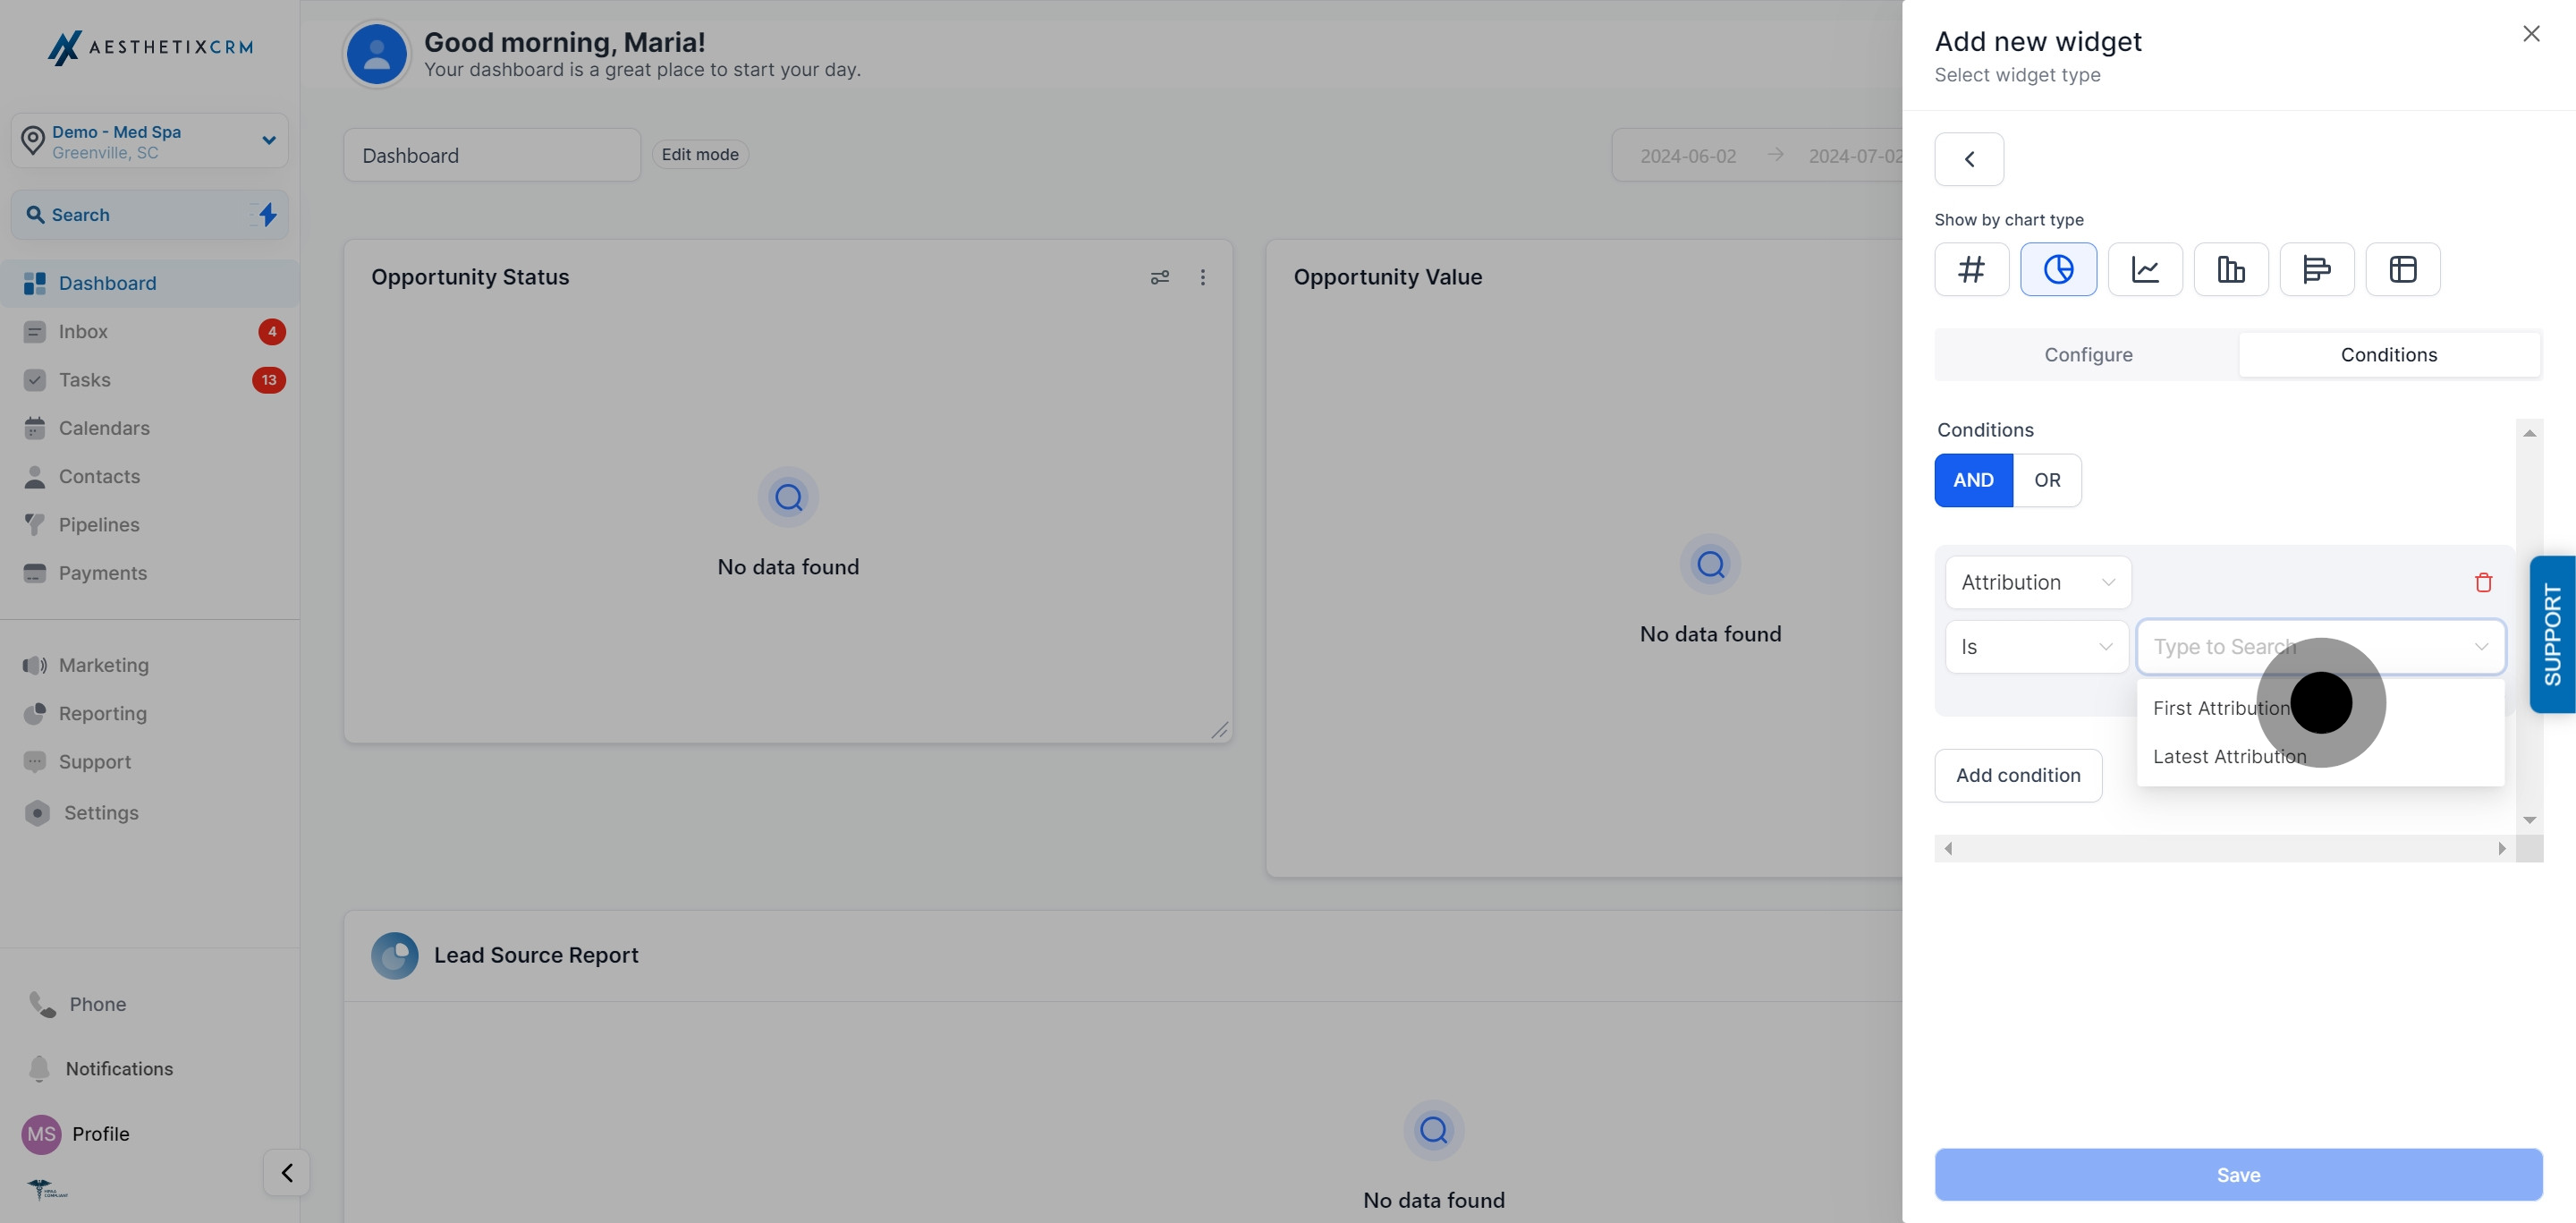
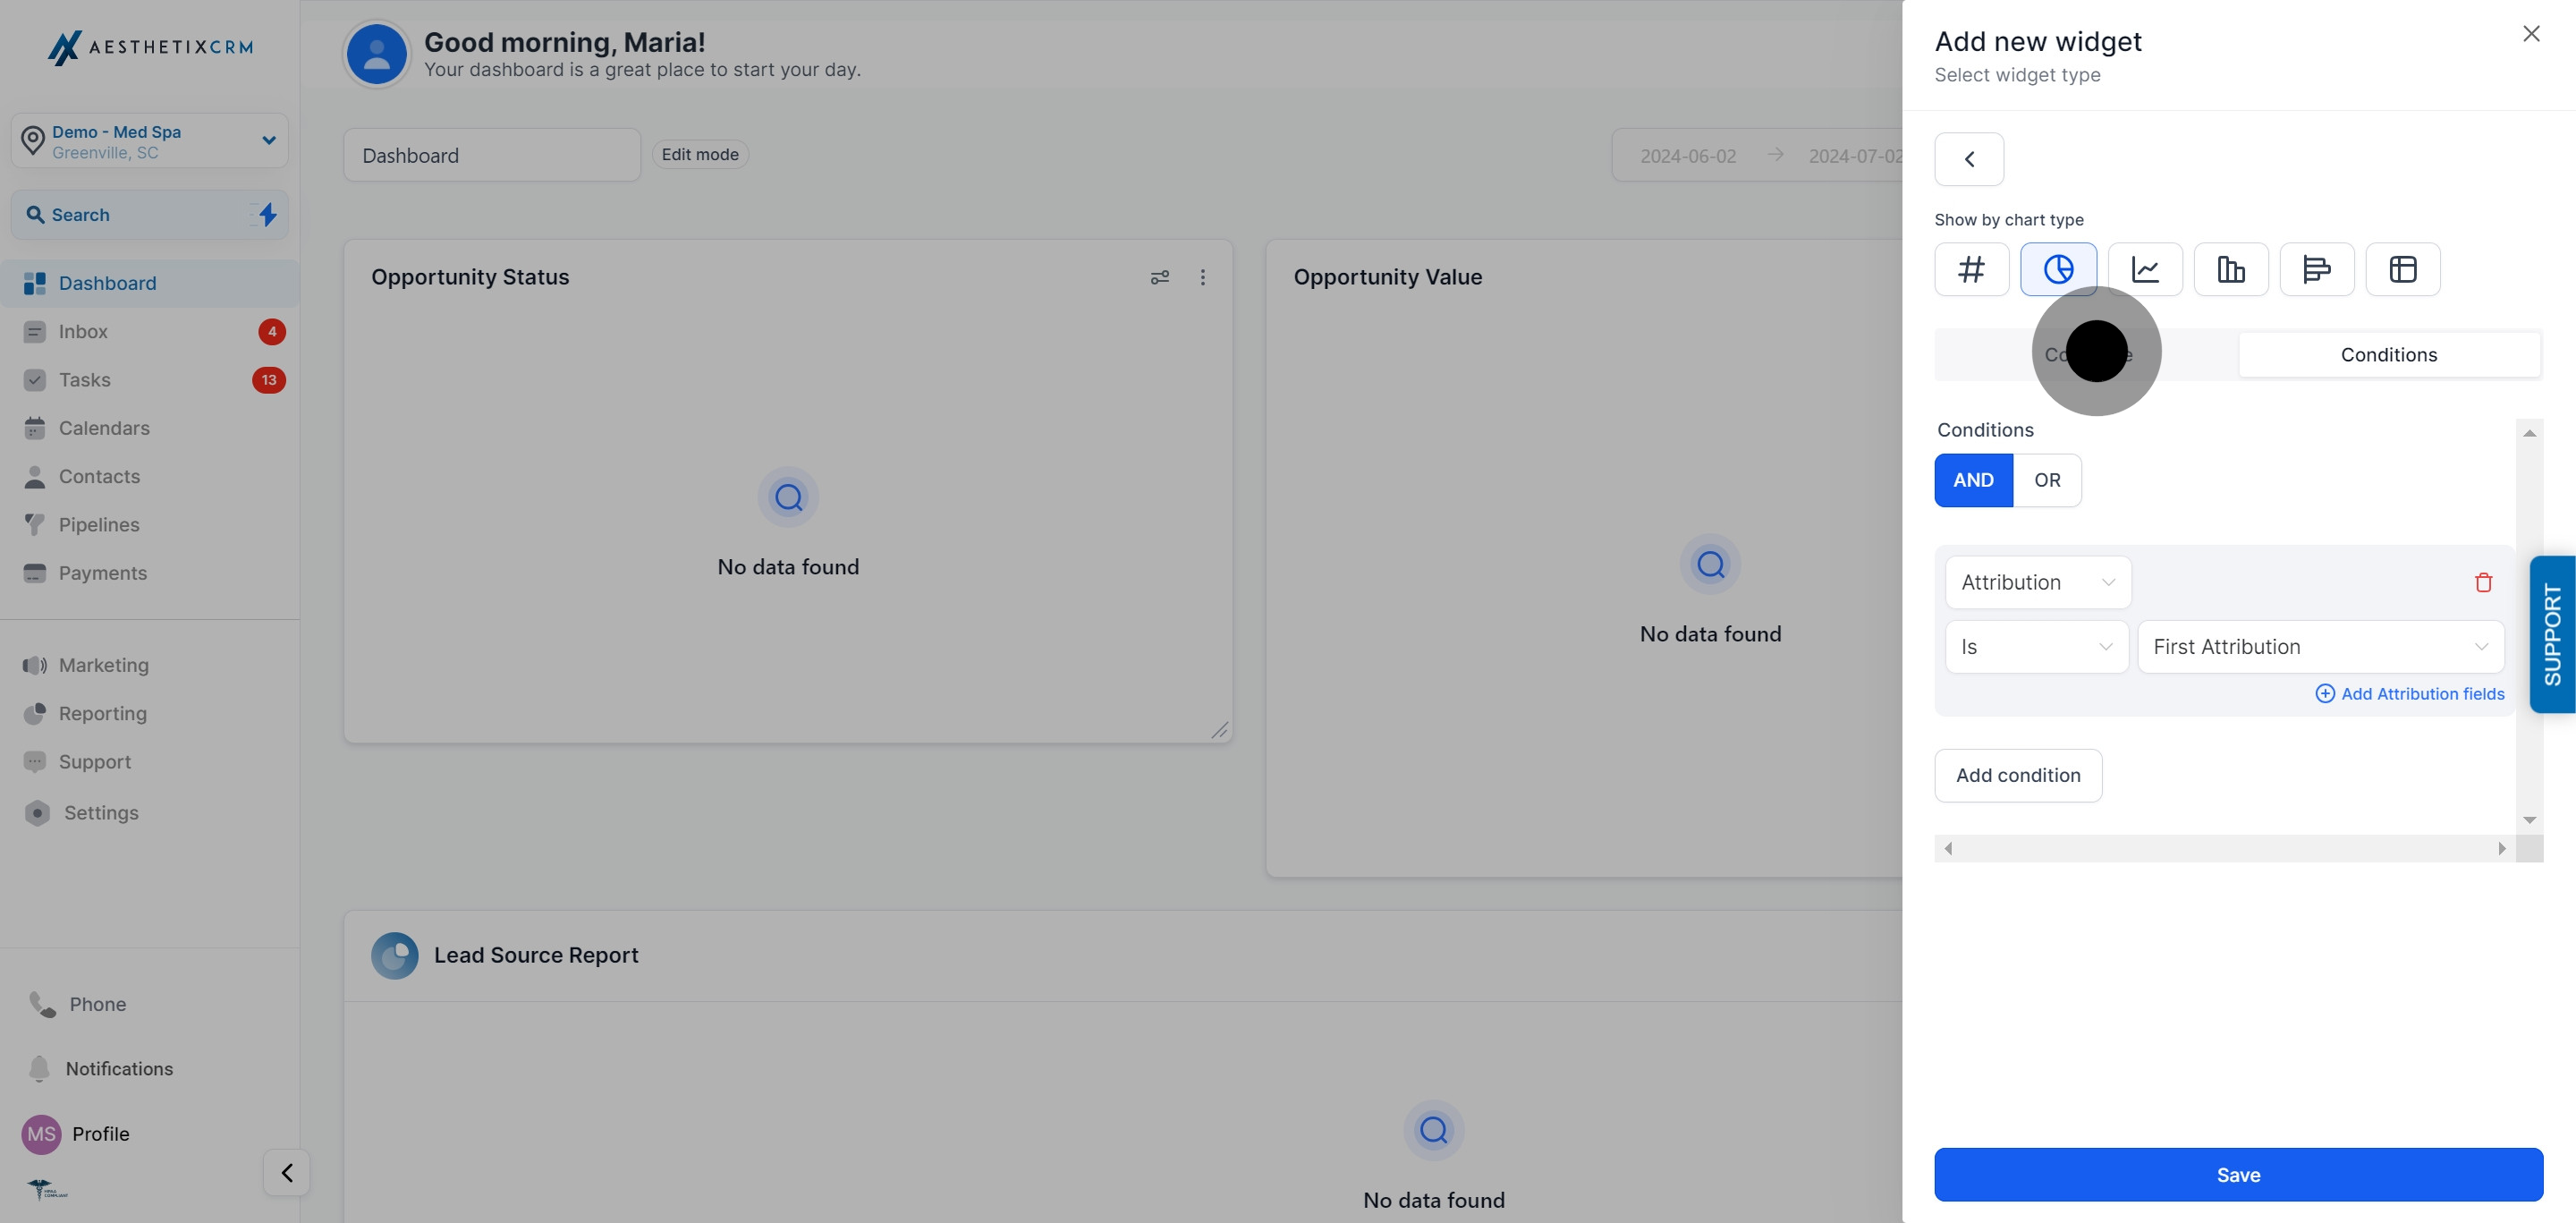
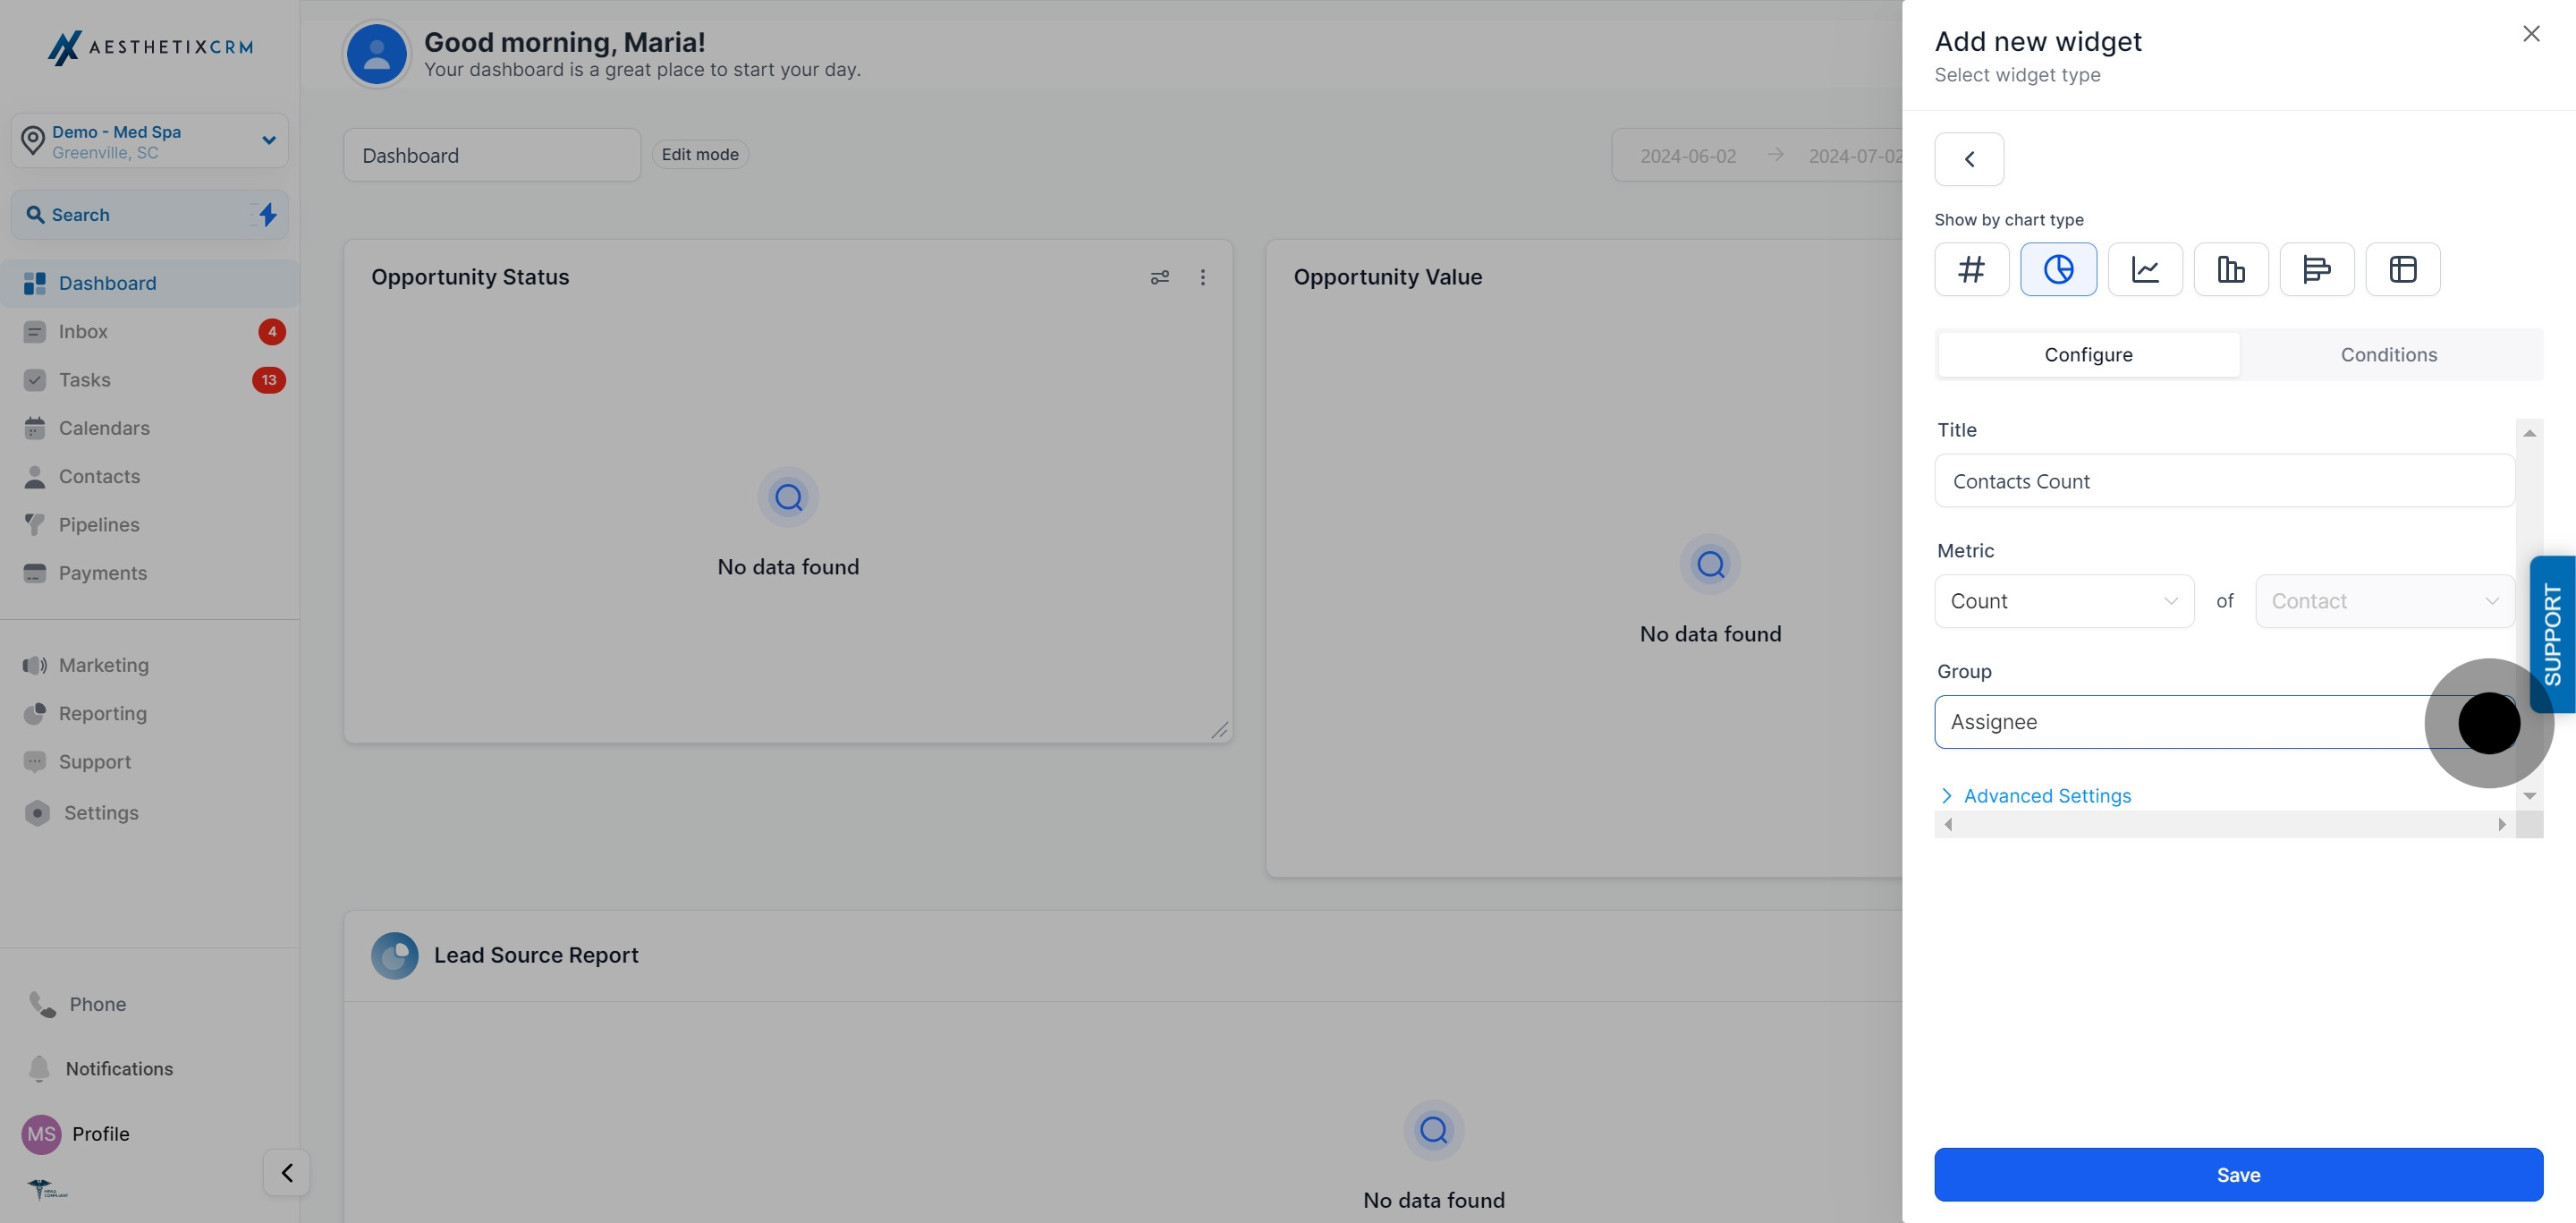
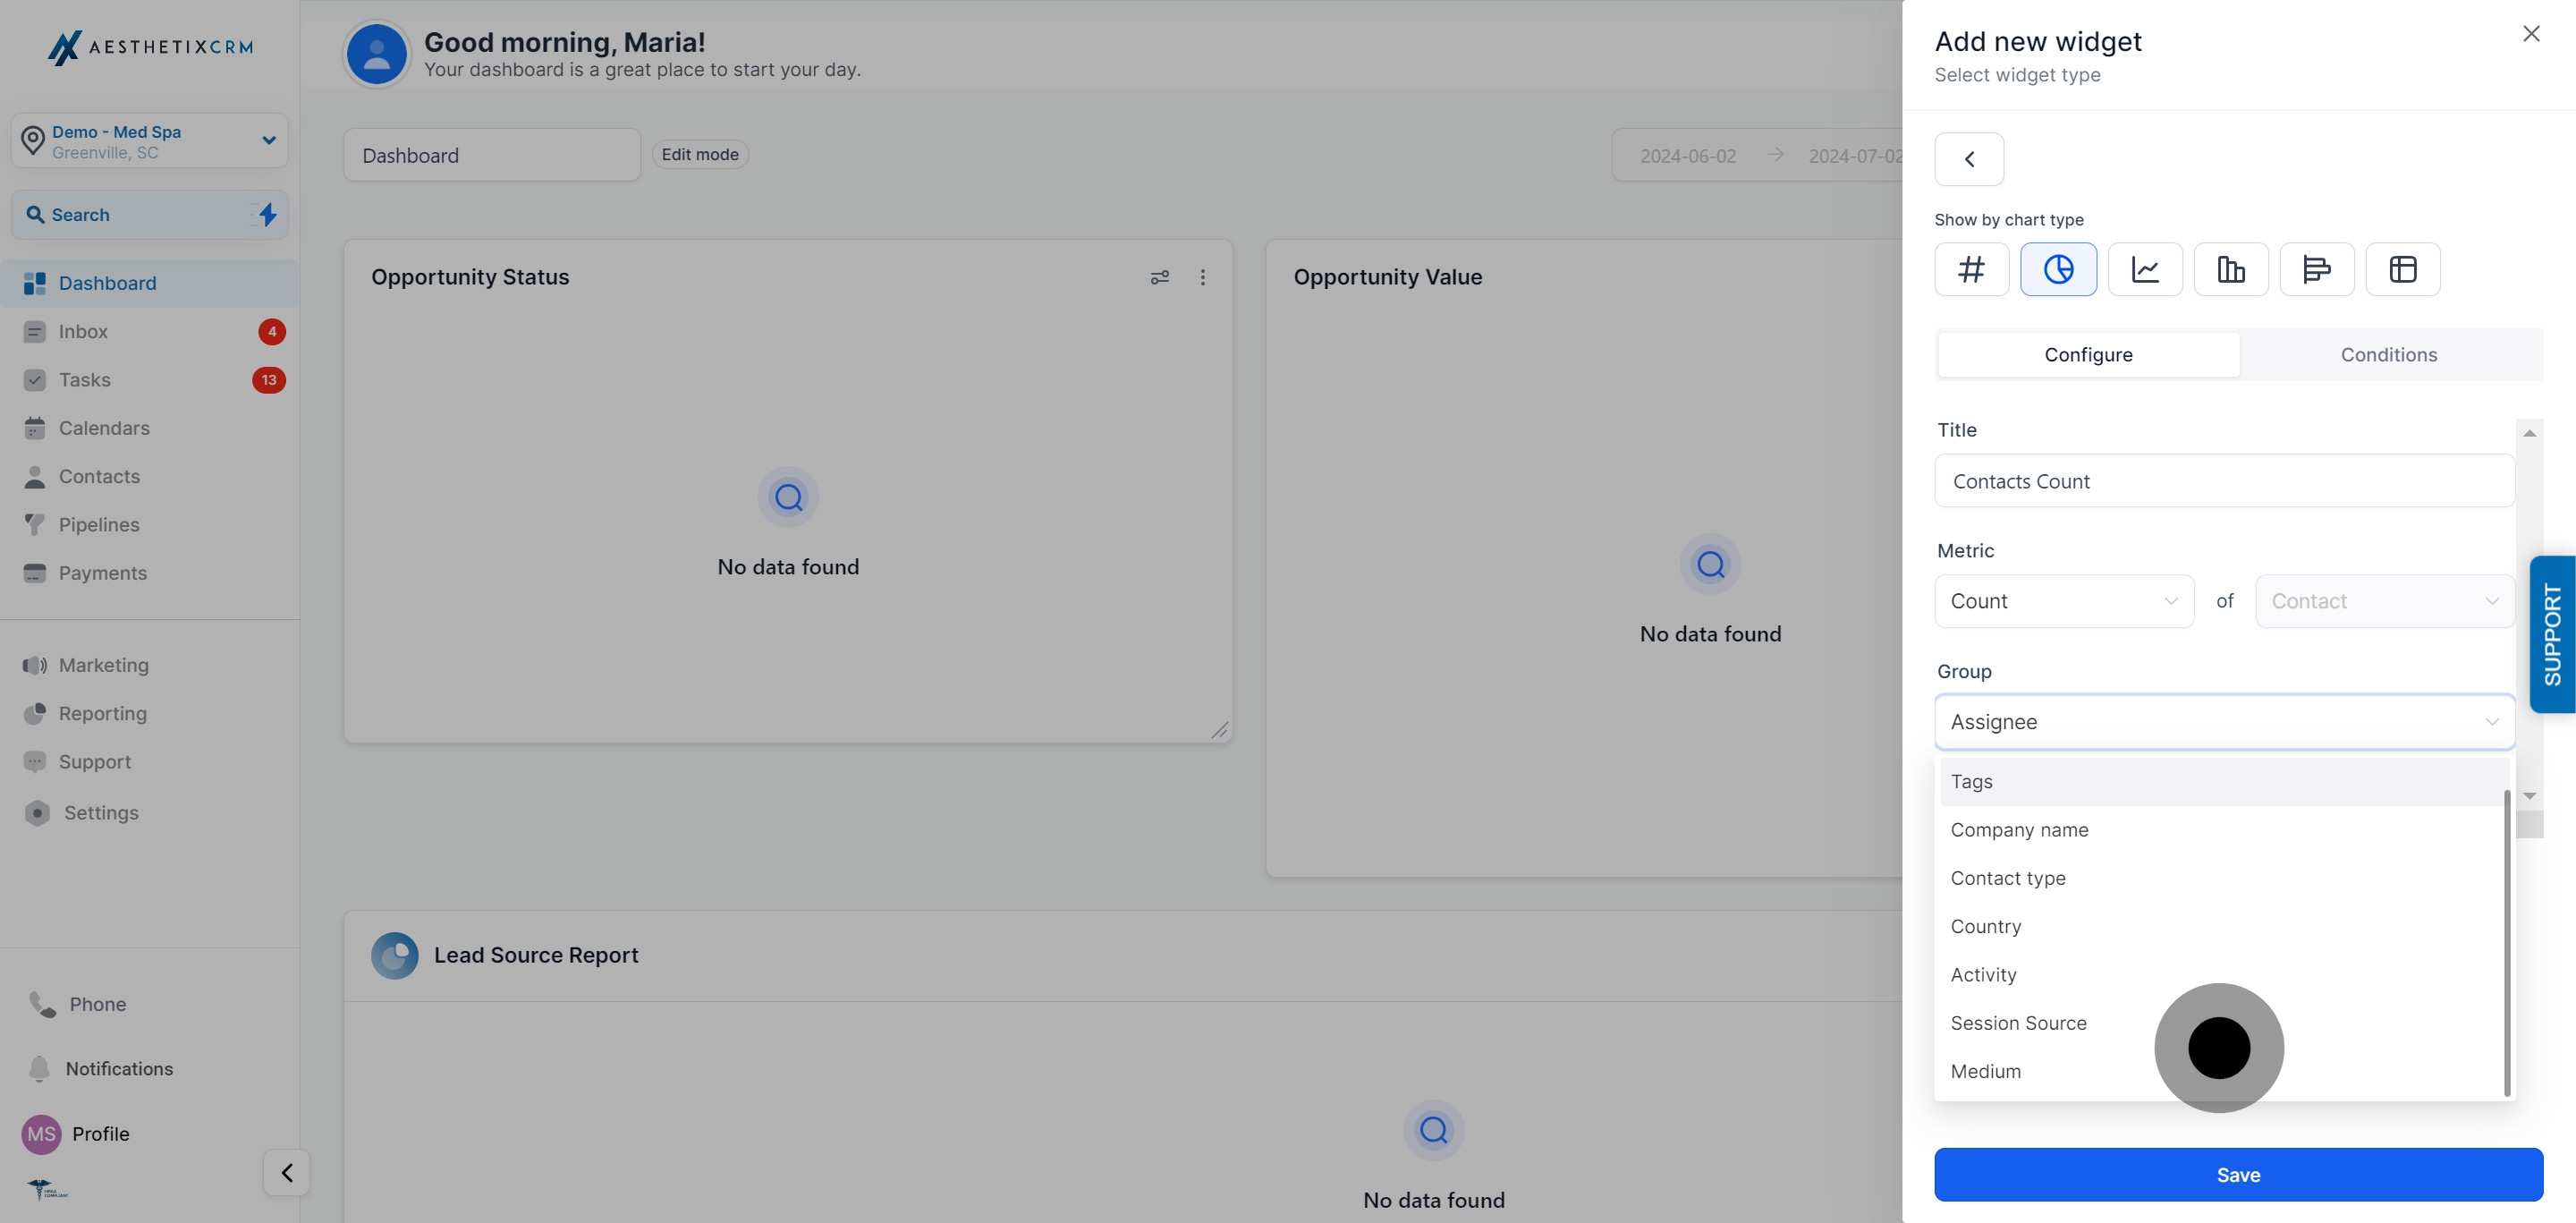
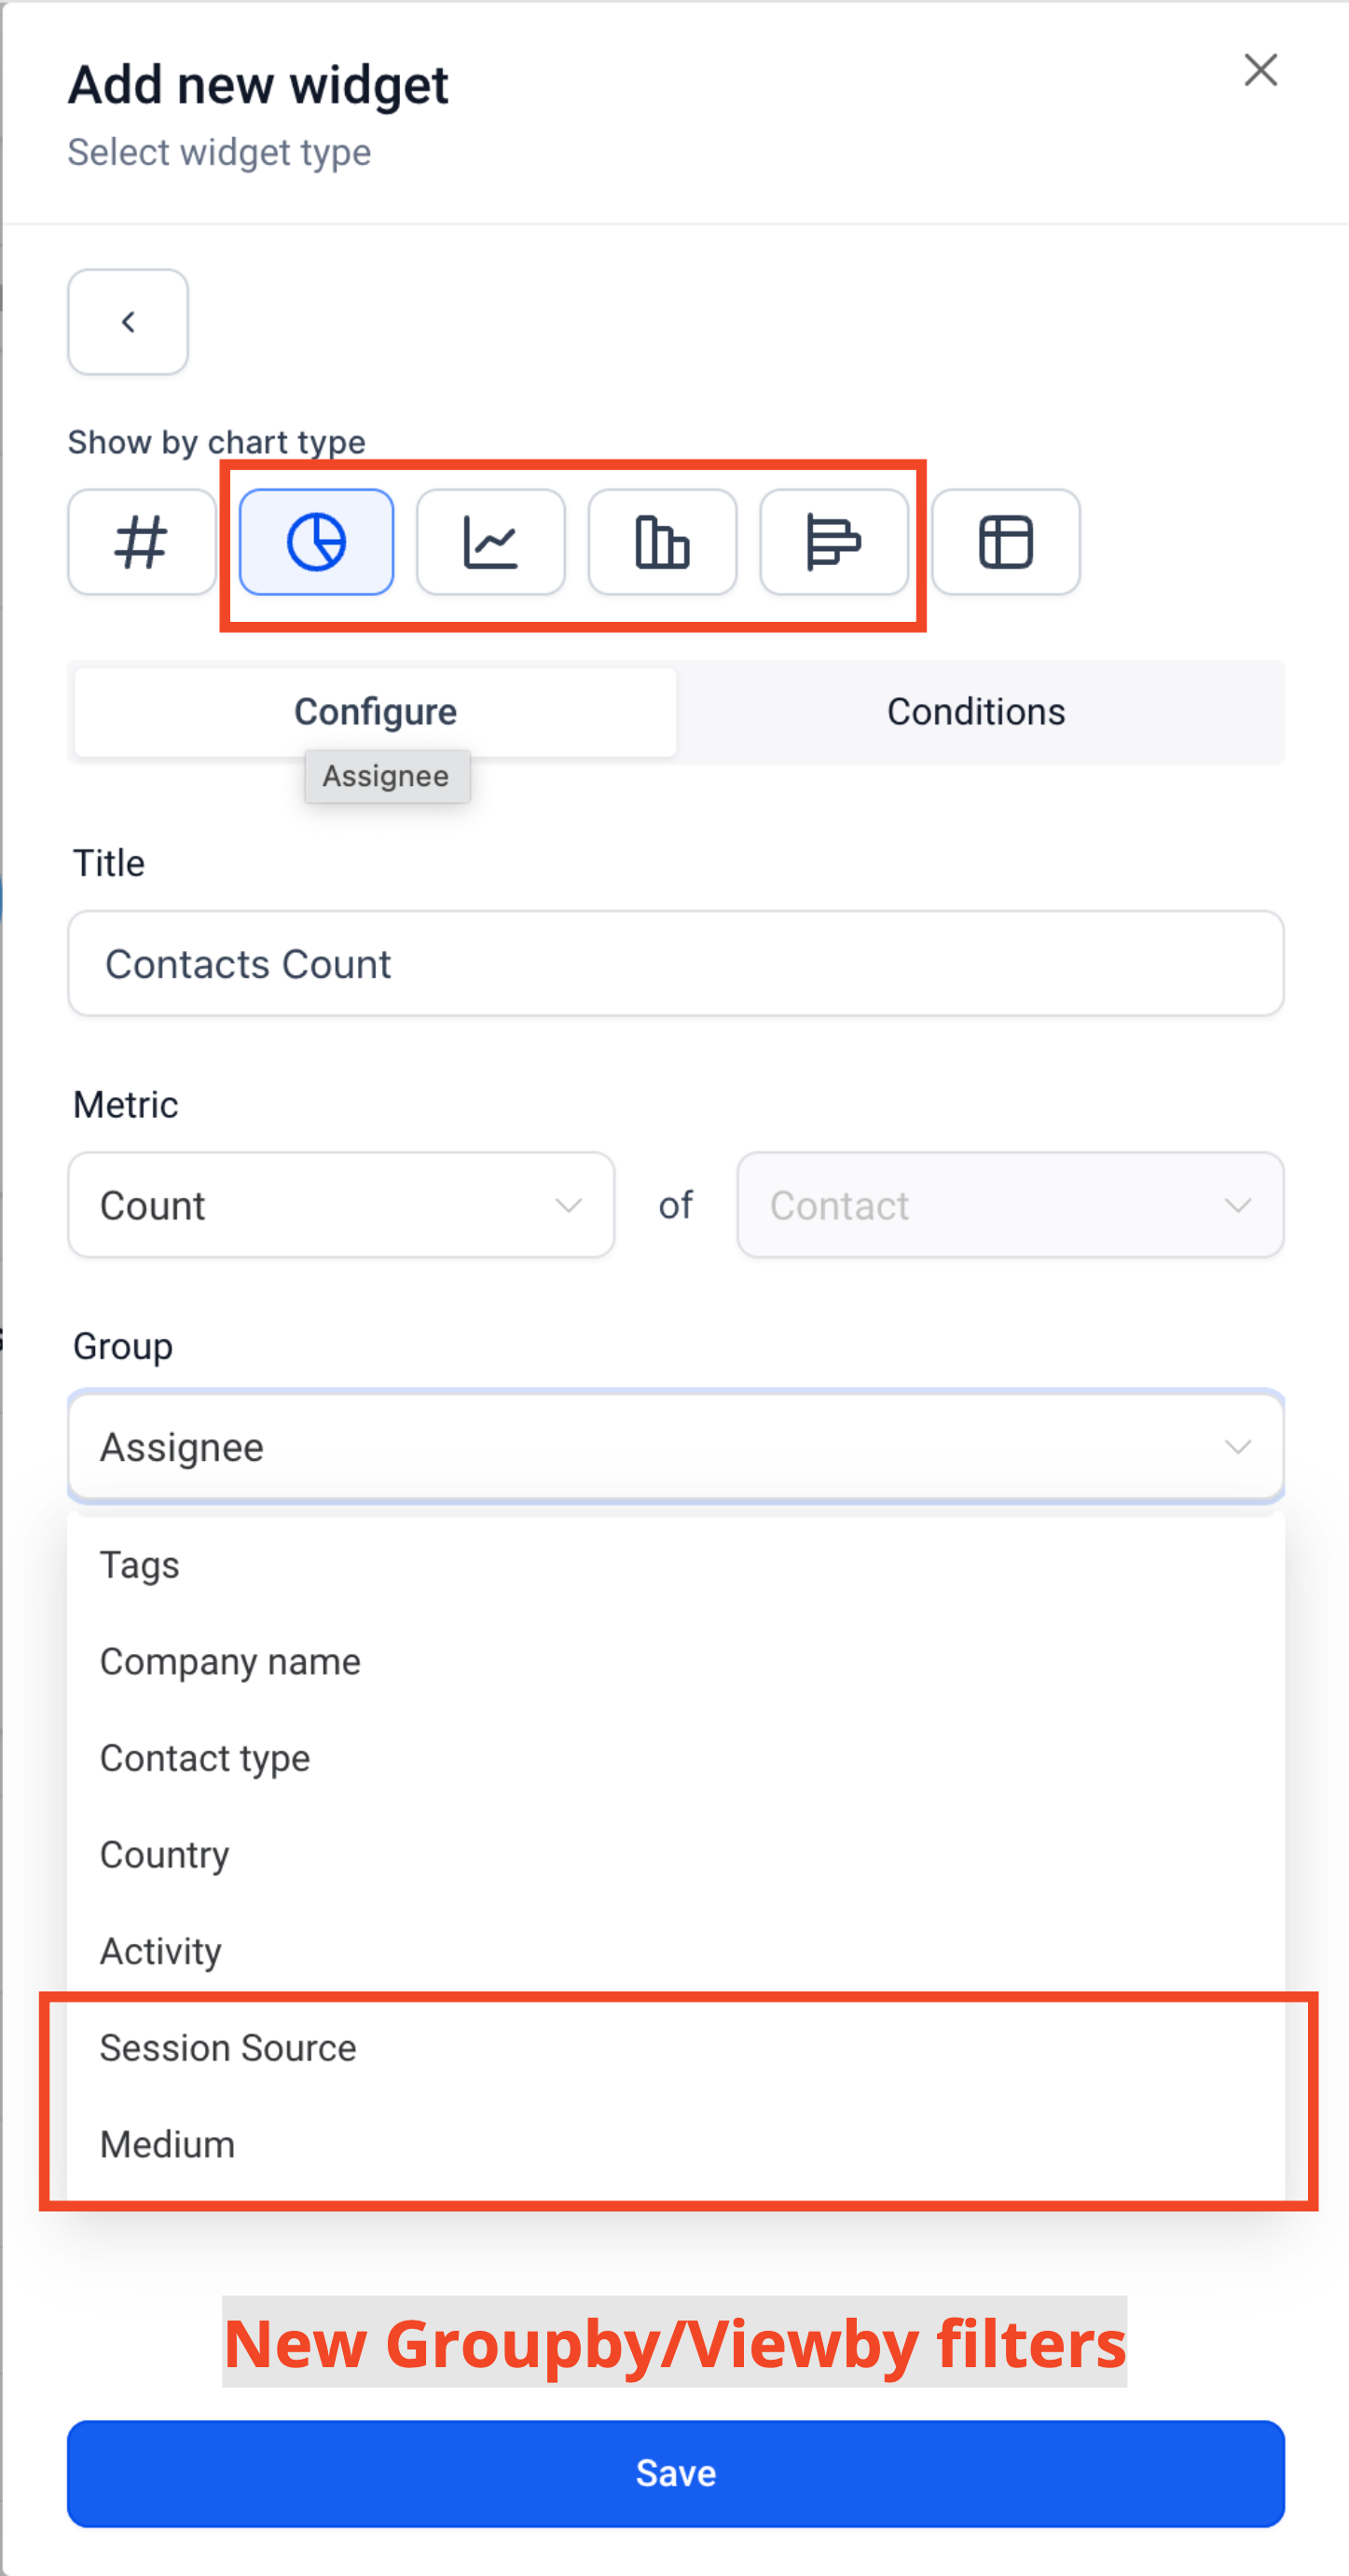
Session Source and Medium can only be selected here if you've already added an Attribution type (First or Latest) under Conditions in the previous step.
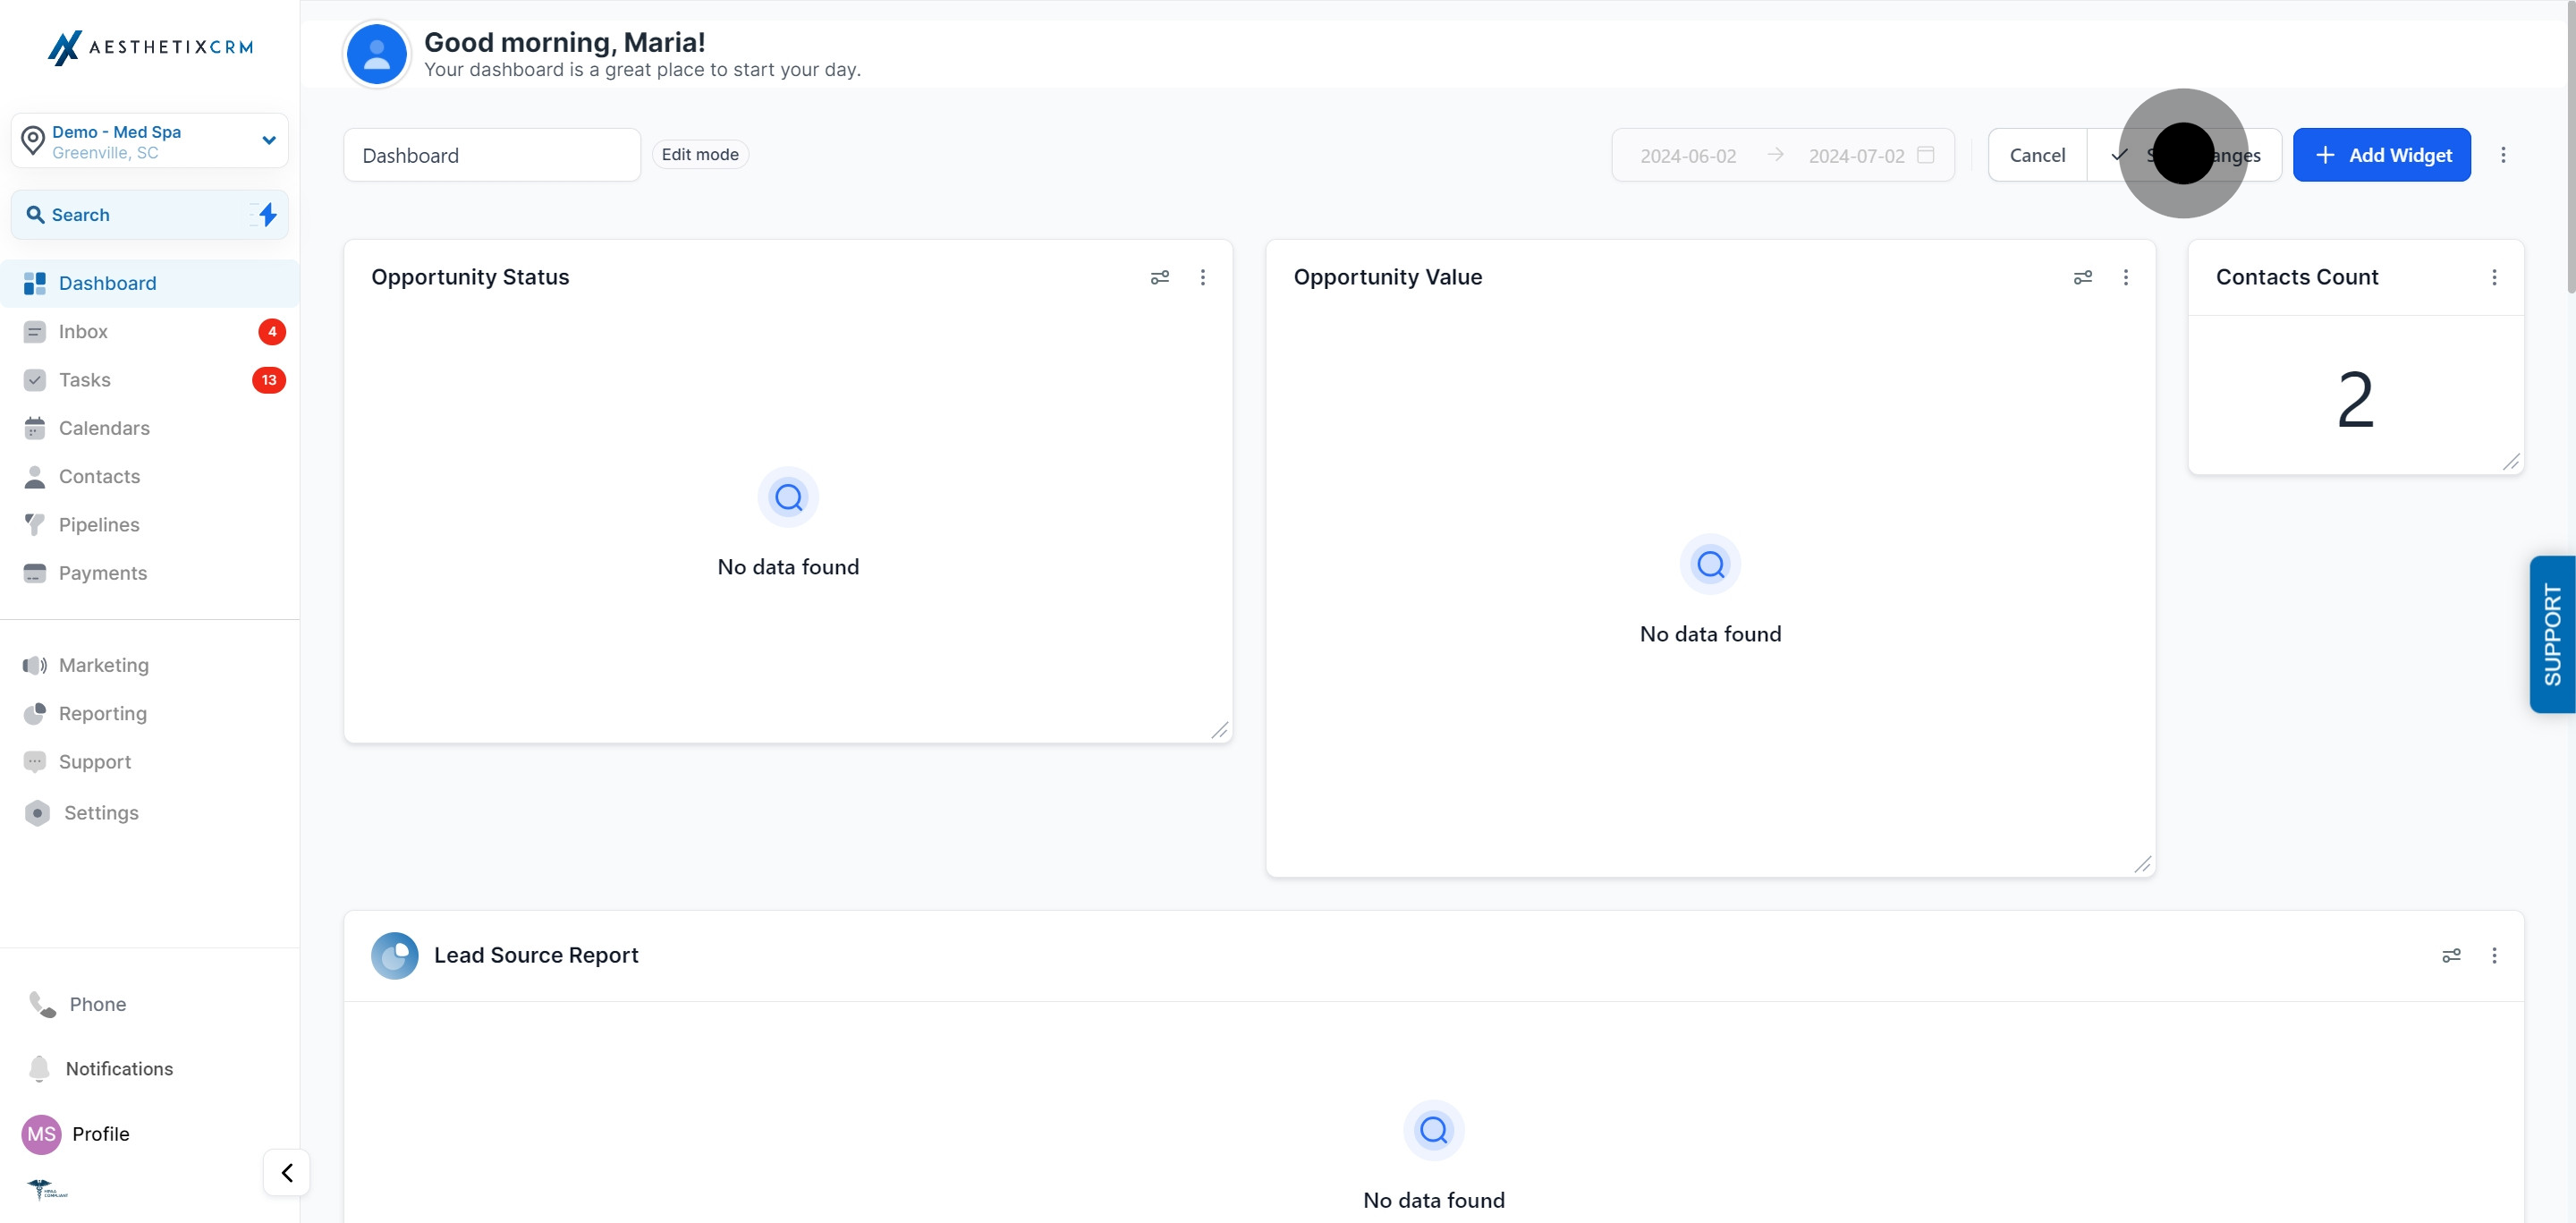
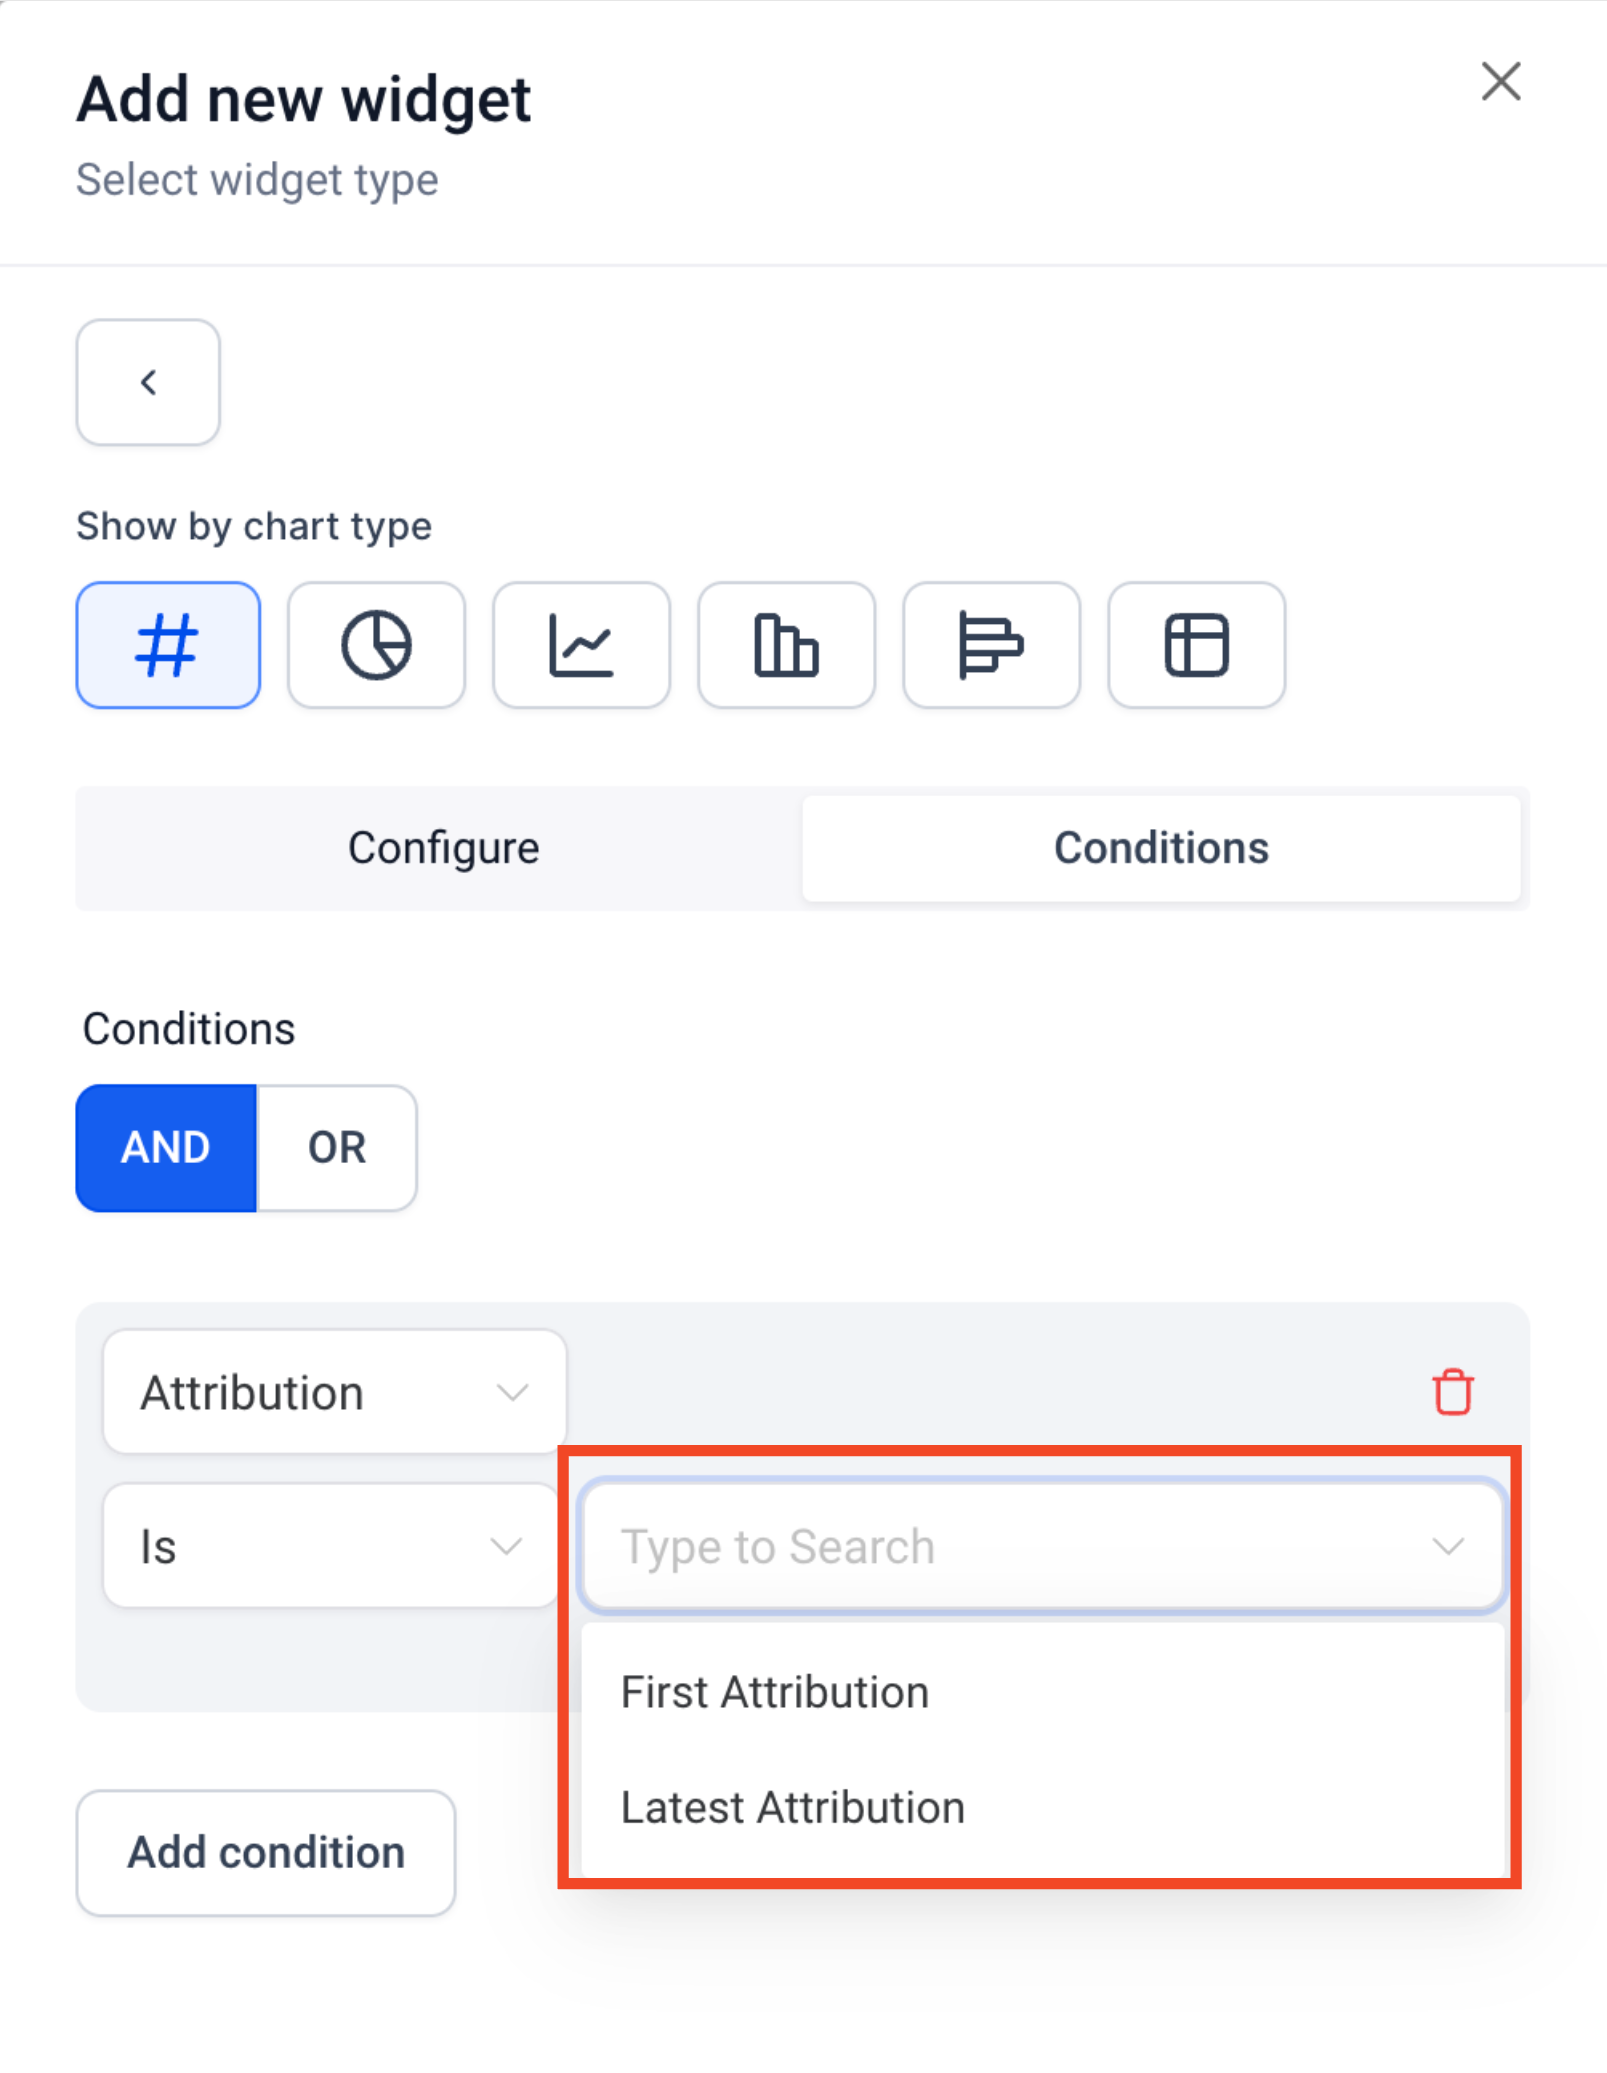
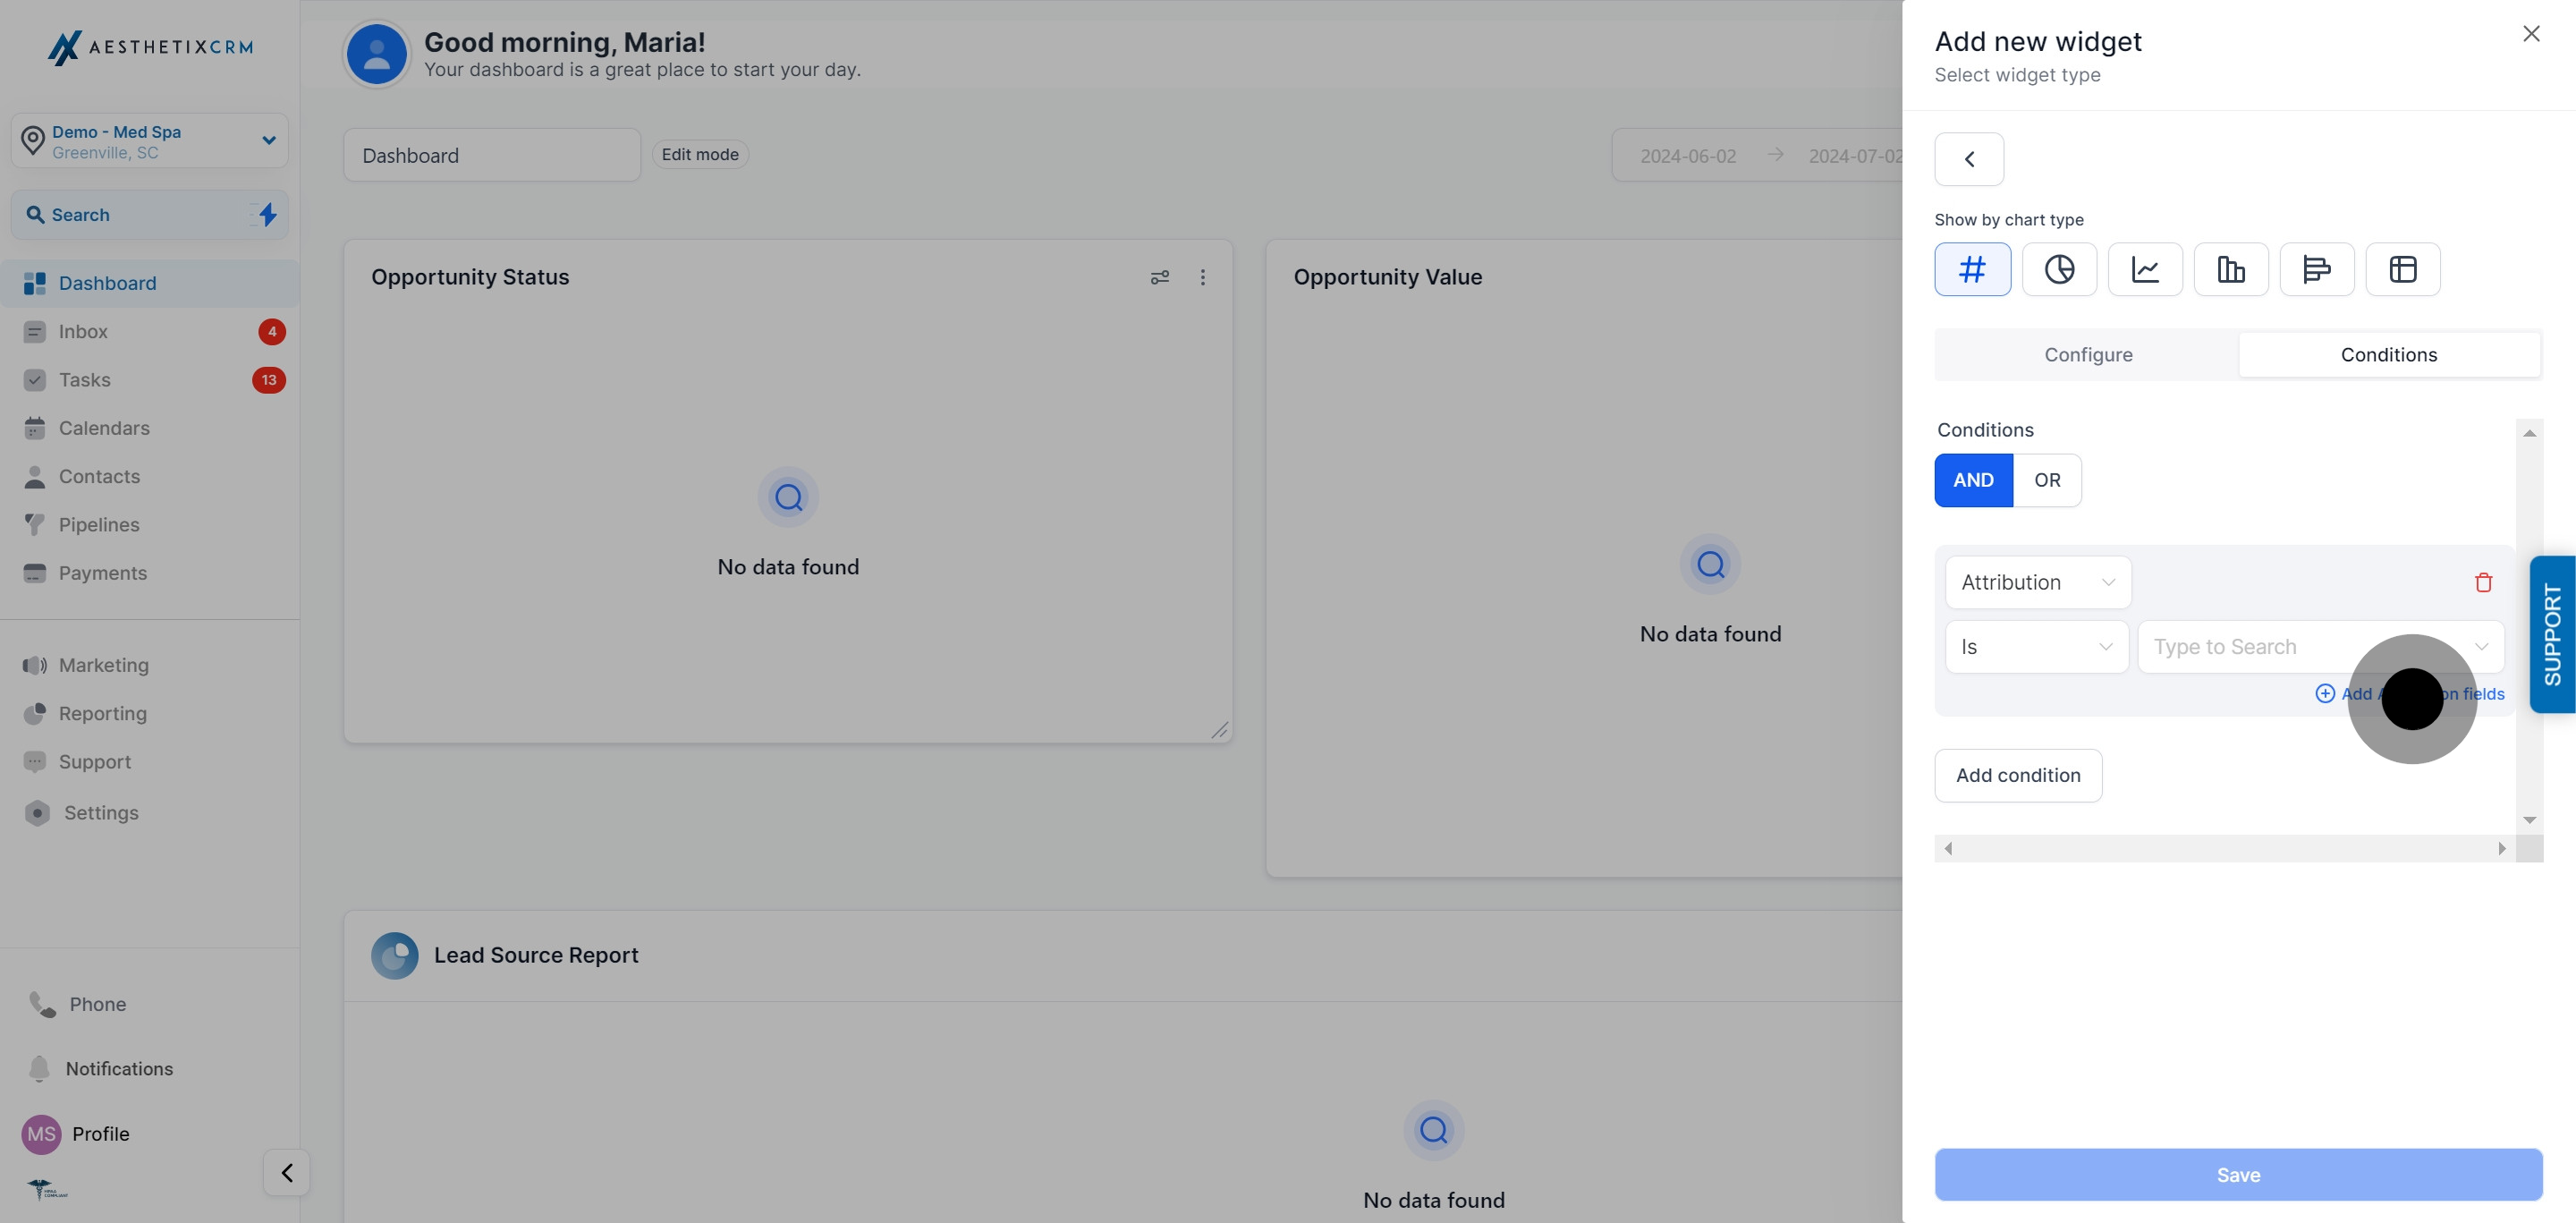
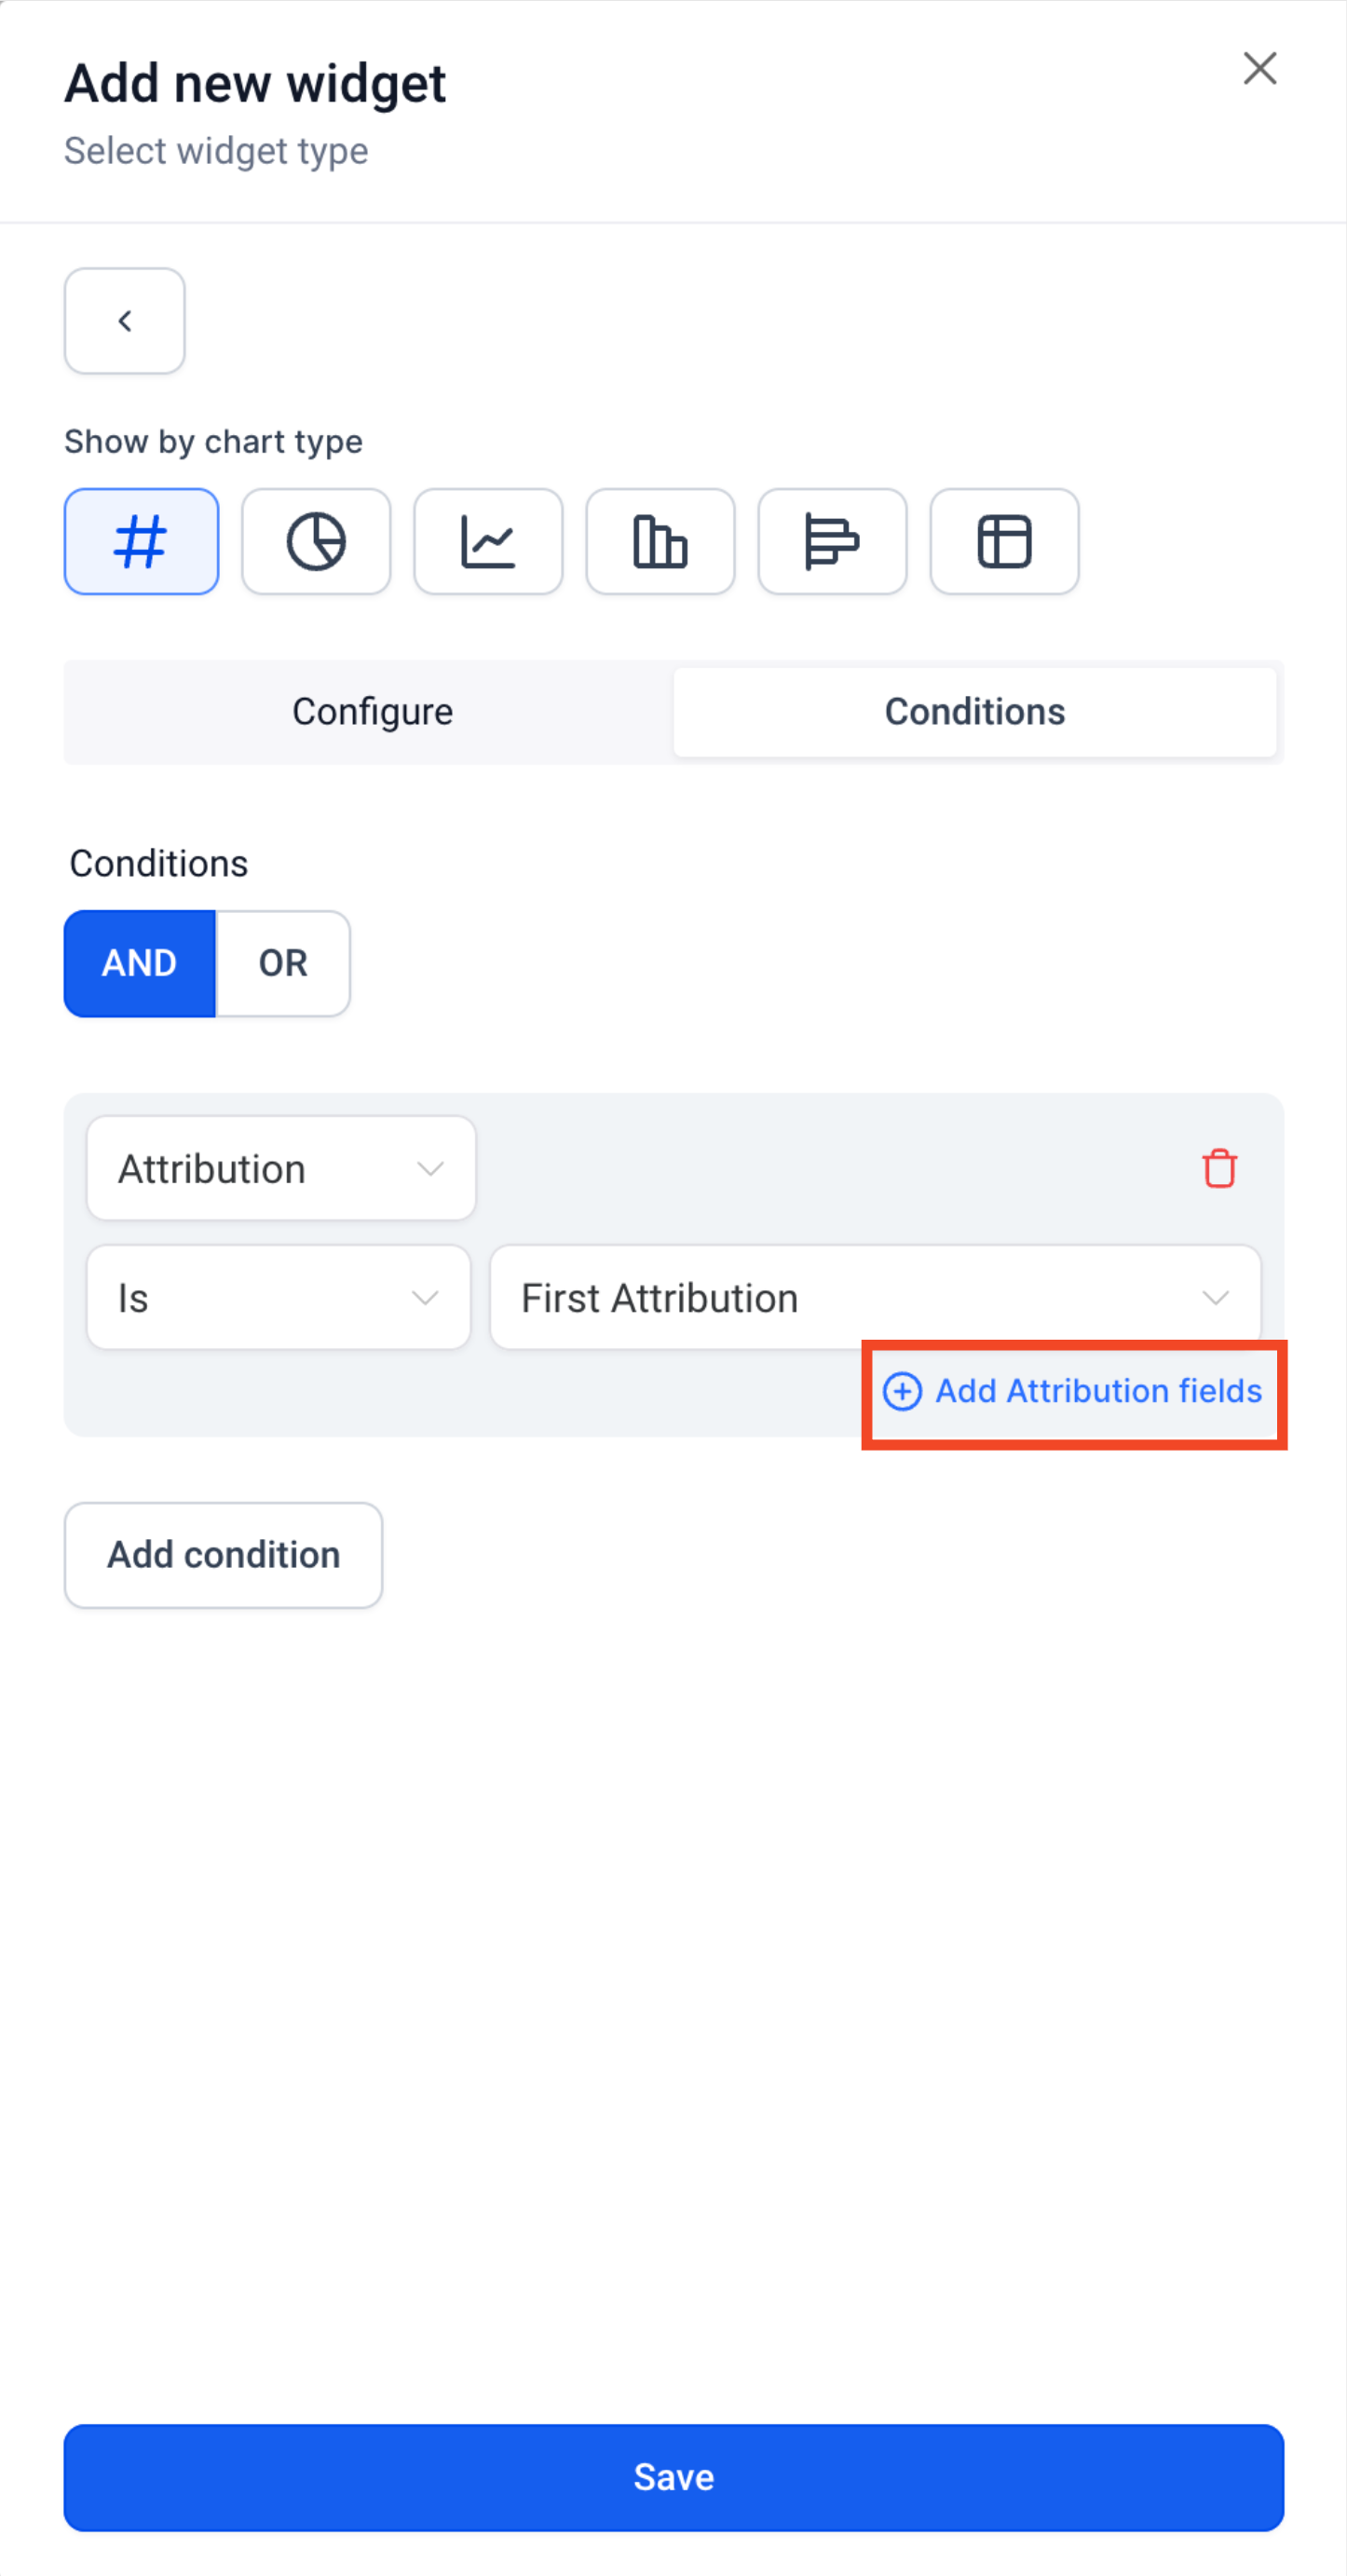
Use this when you want a widget, of any chart type, to only reflect patients or opportunities that came through a specific channel, campaign, or ad, for example a donut chart limited to leads from a single Instagram ad set.
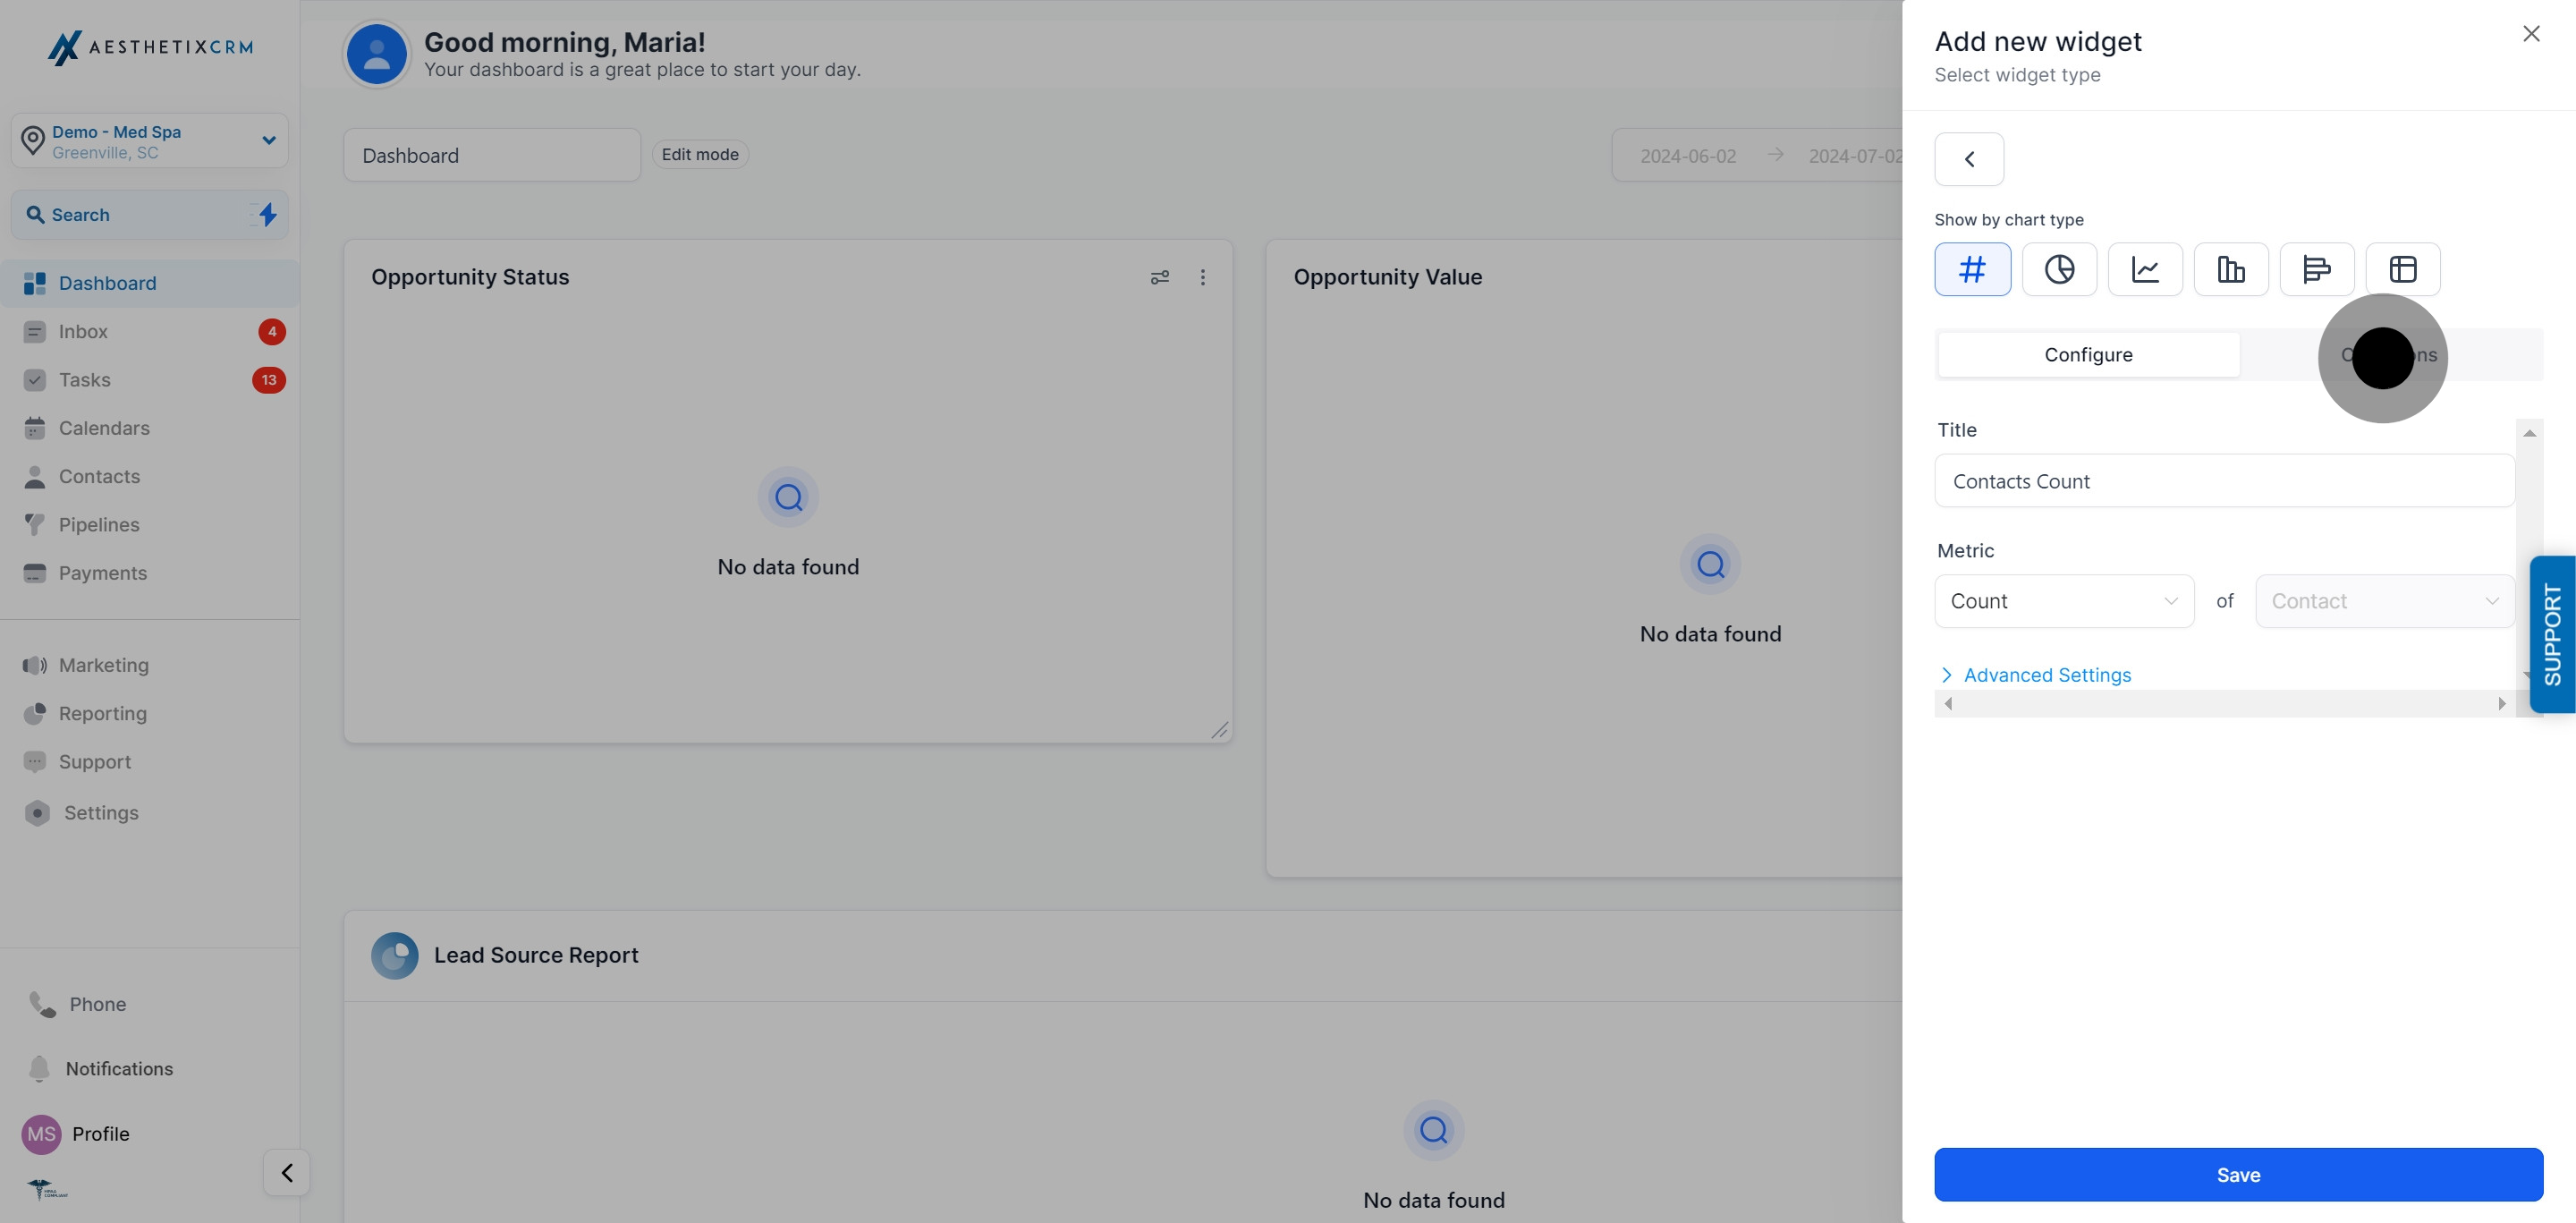
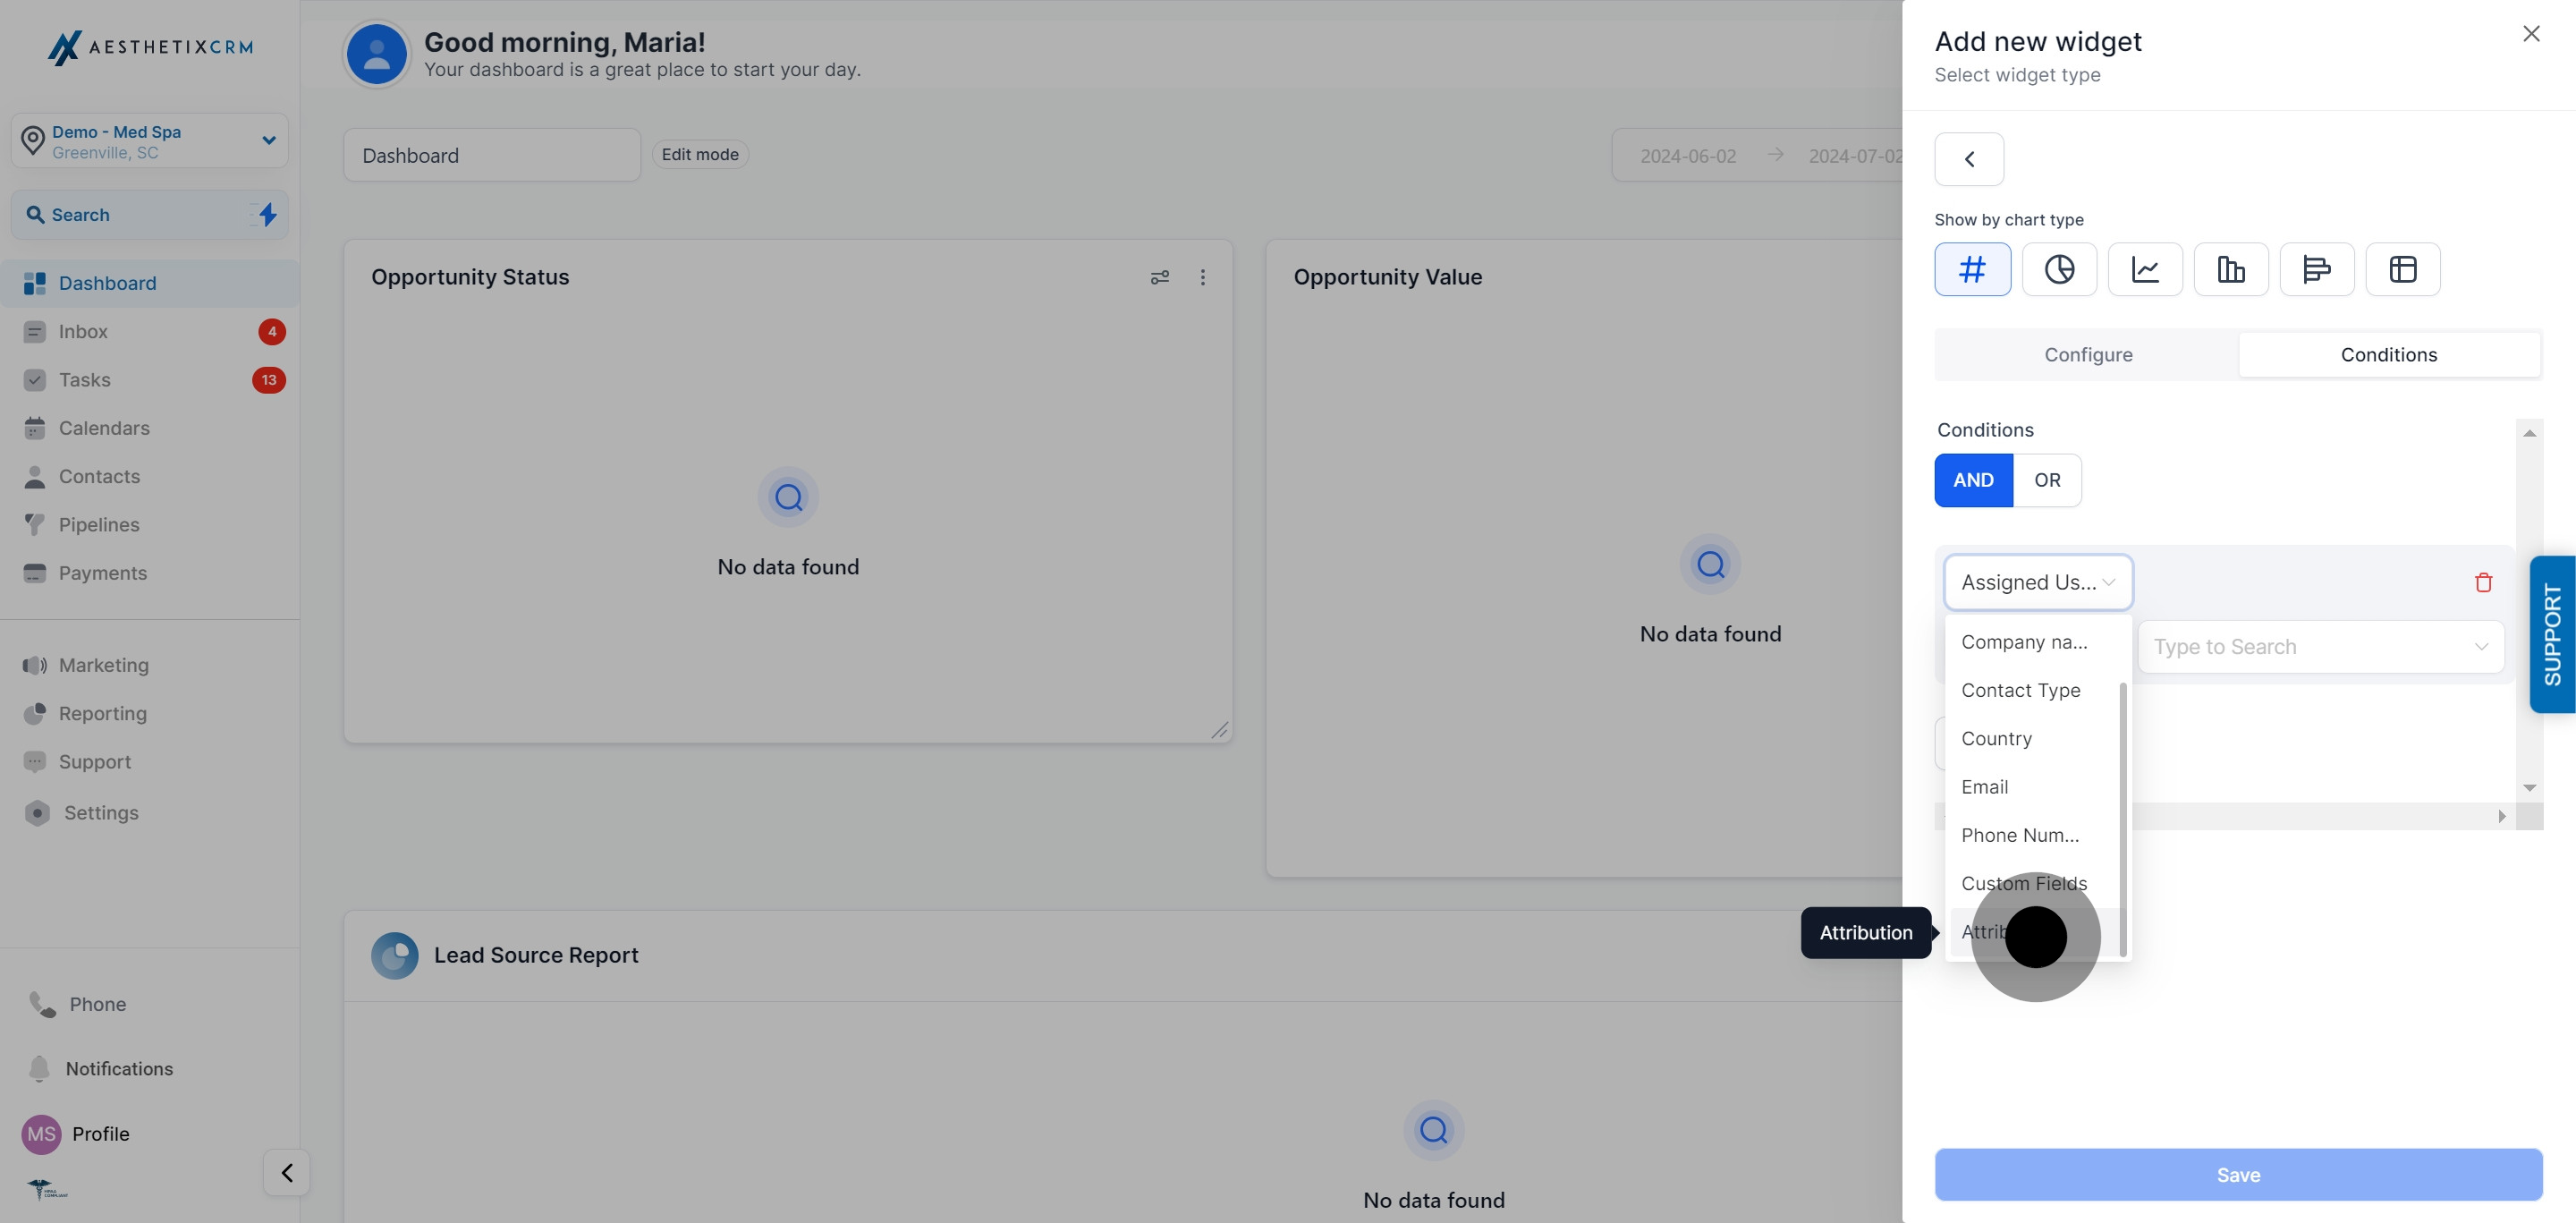
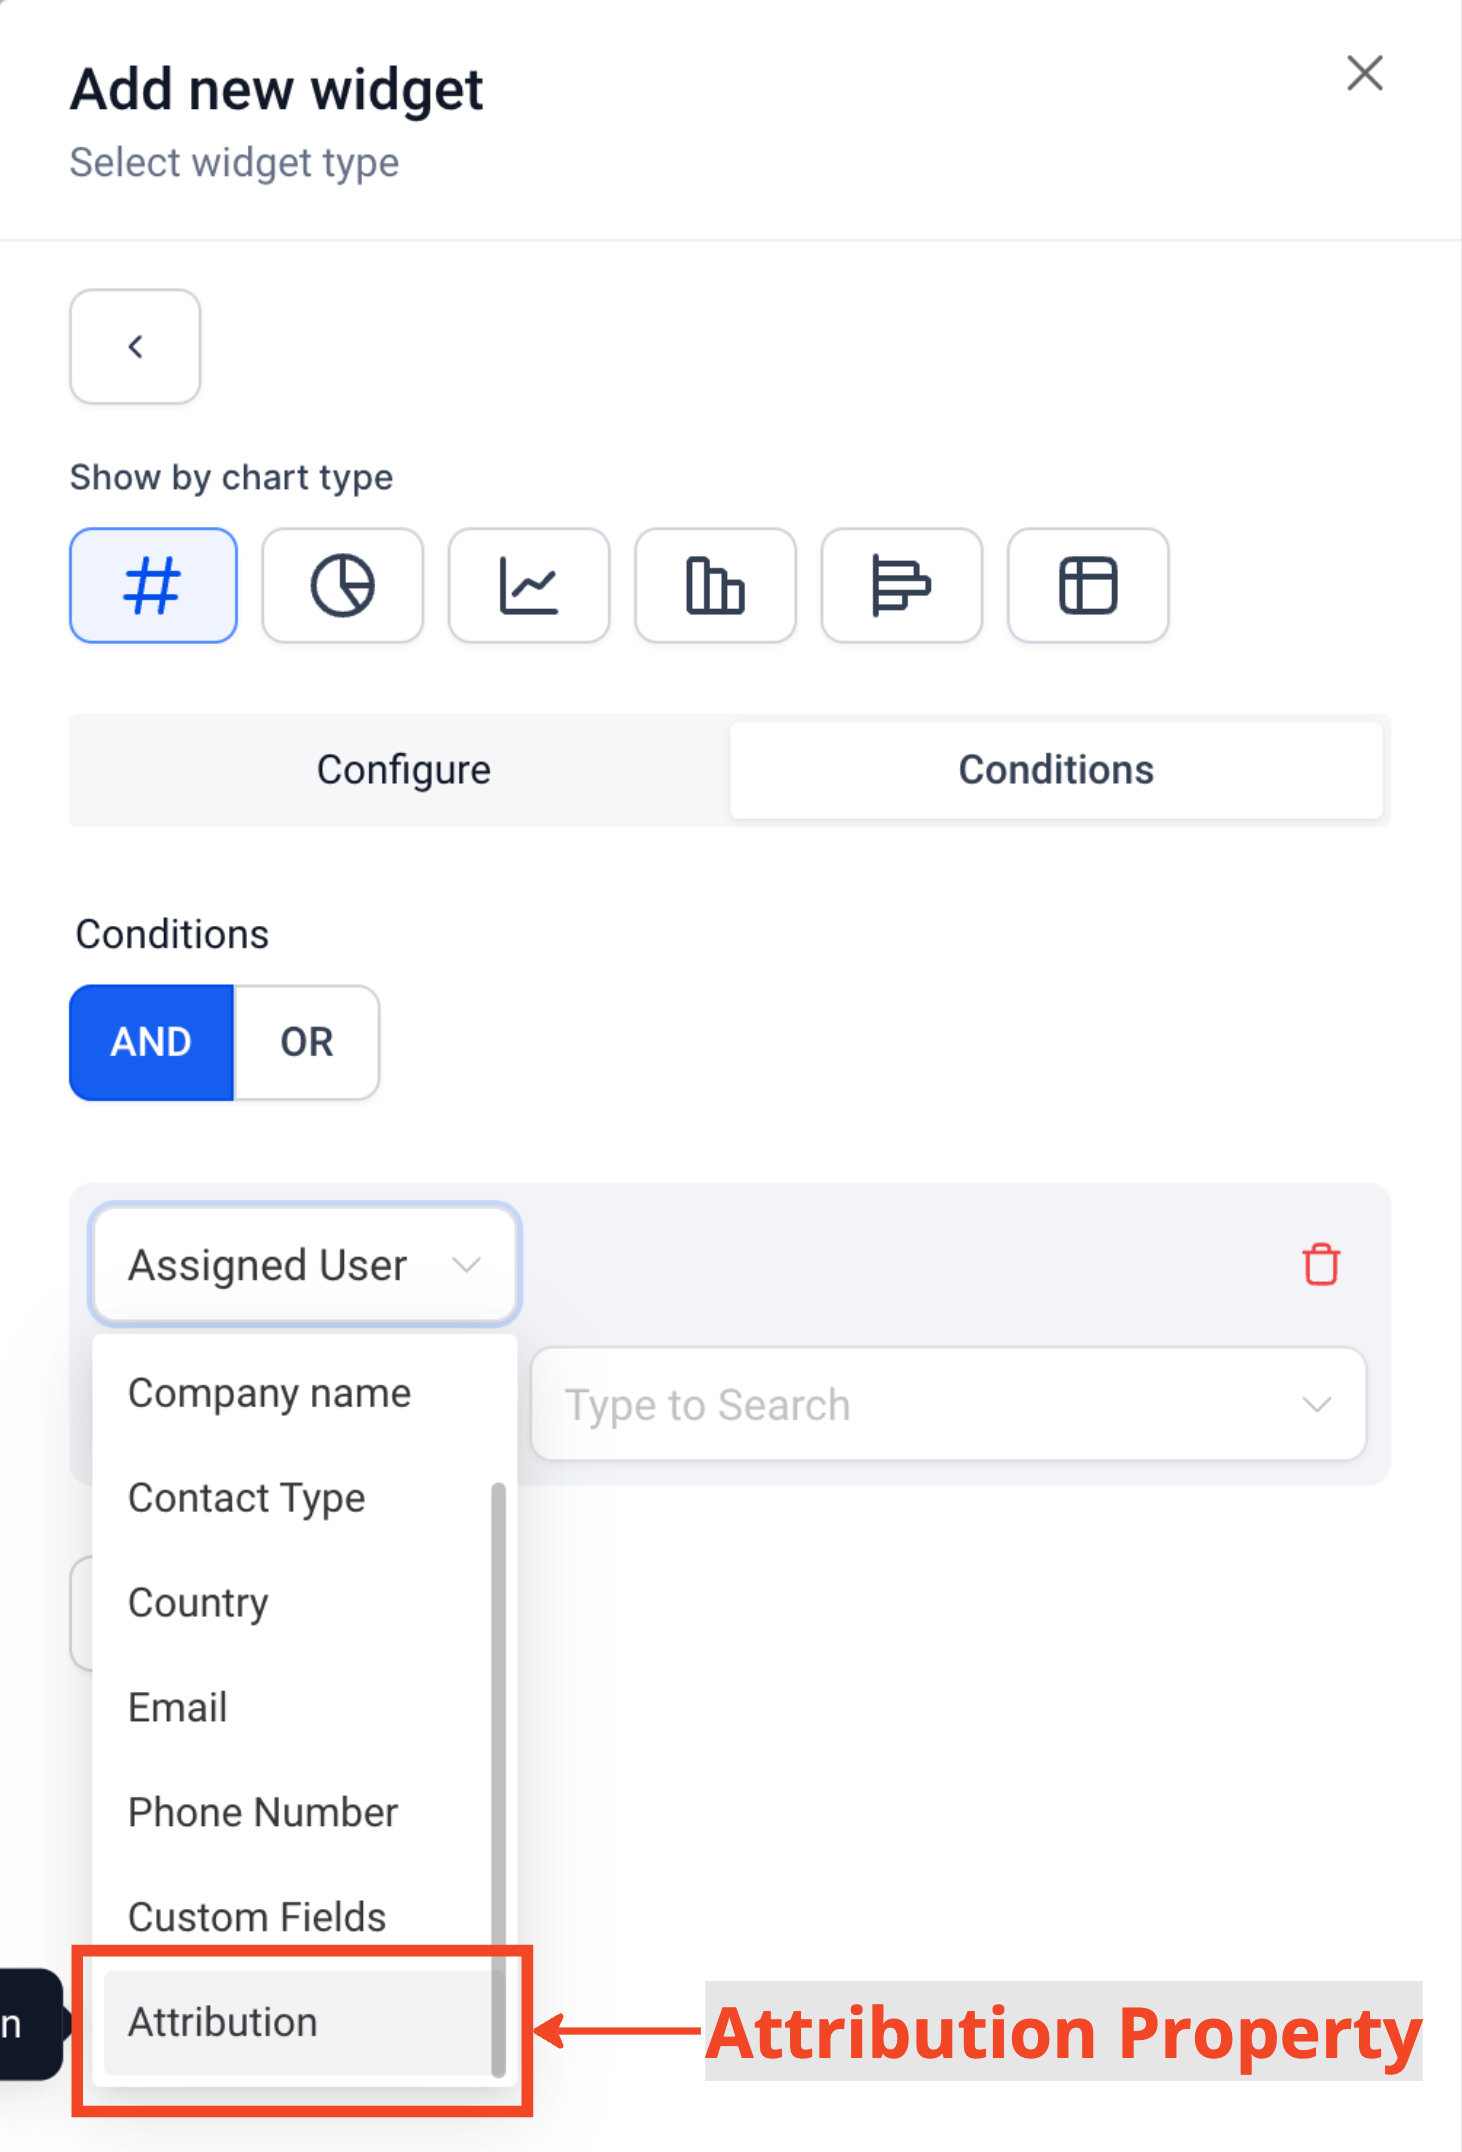
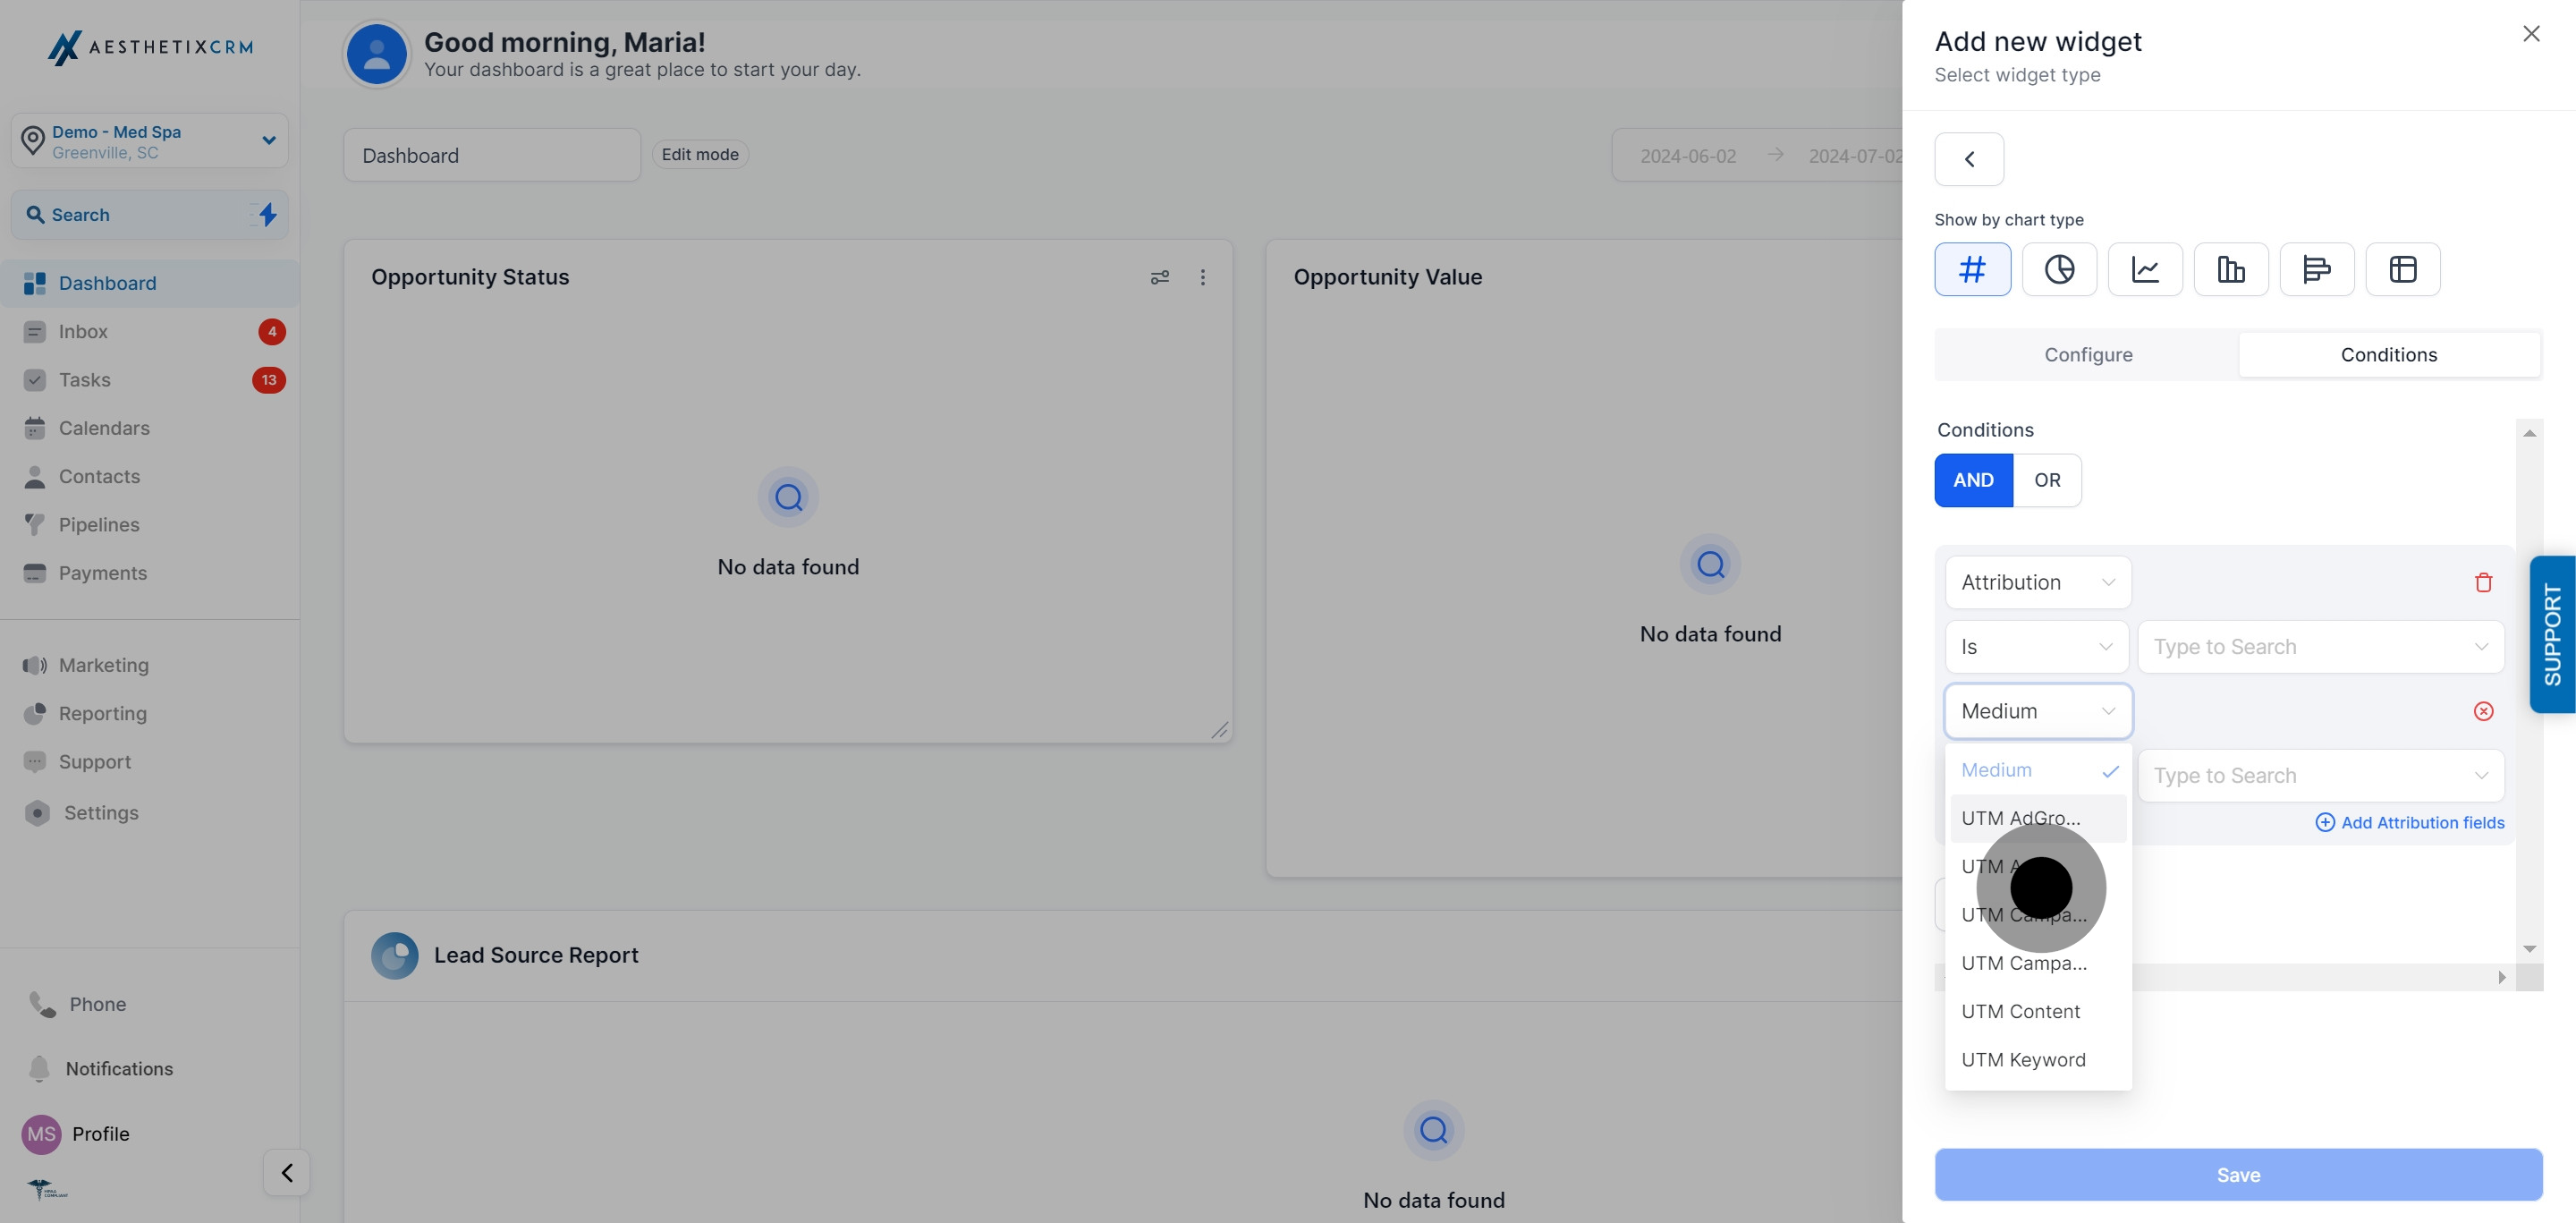
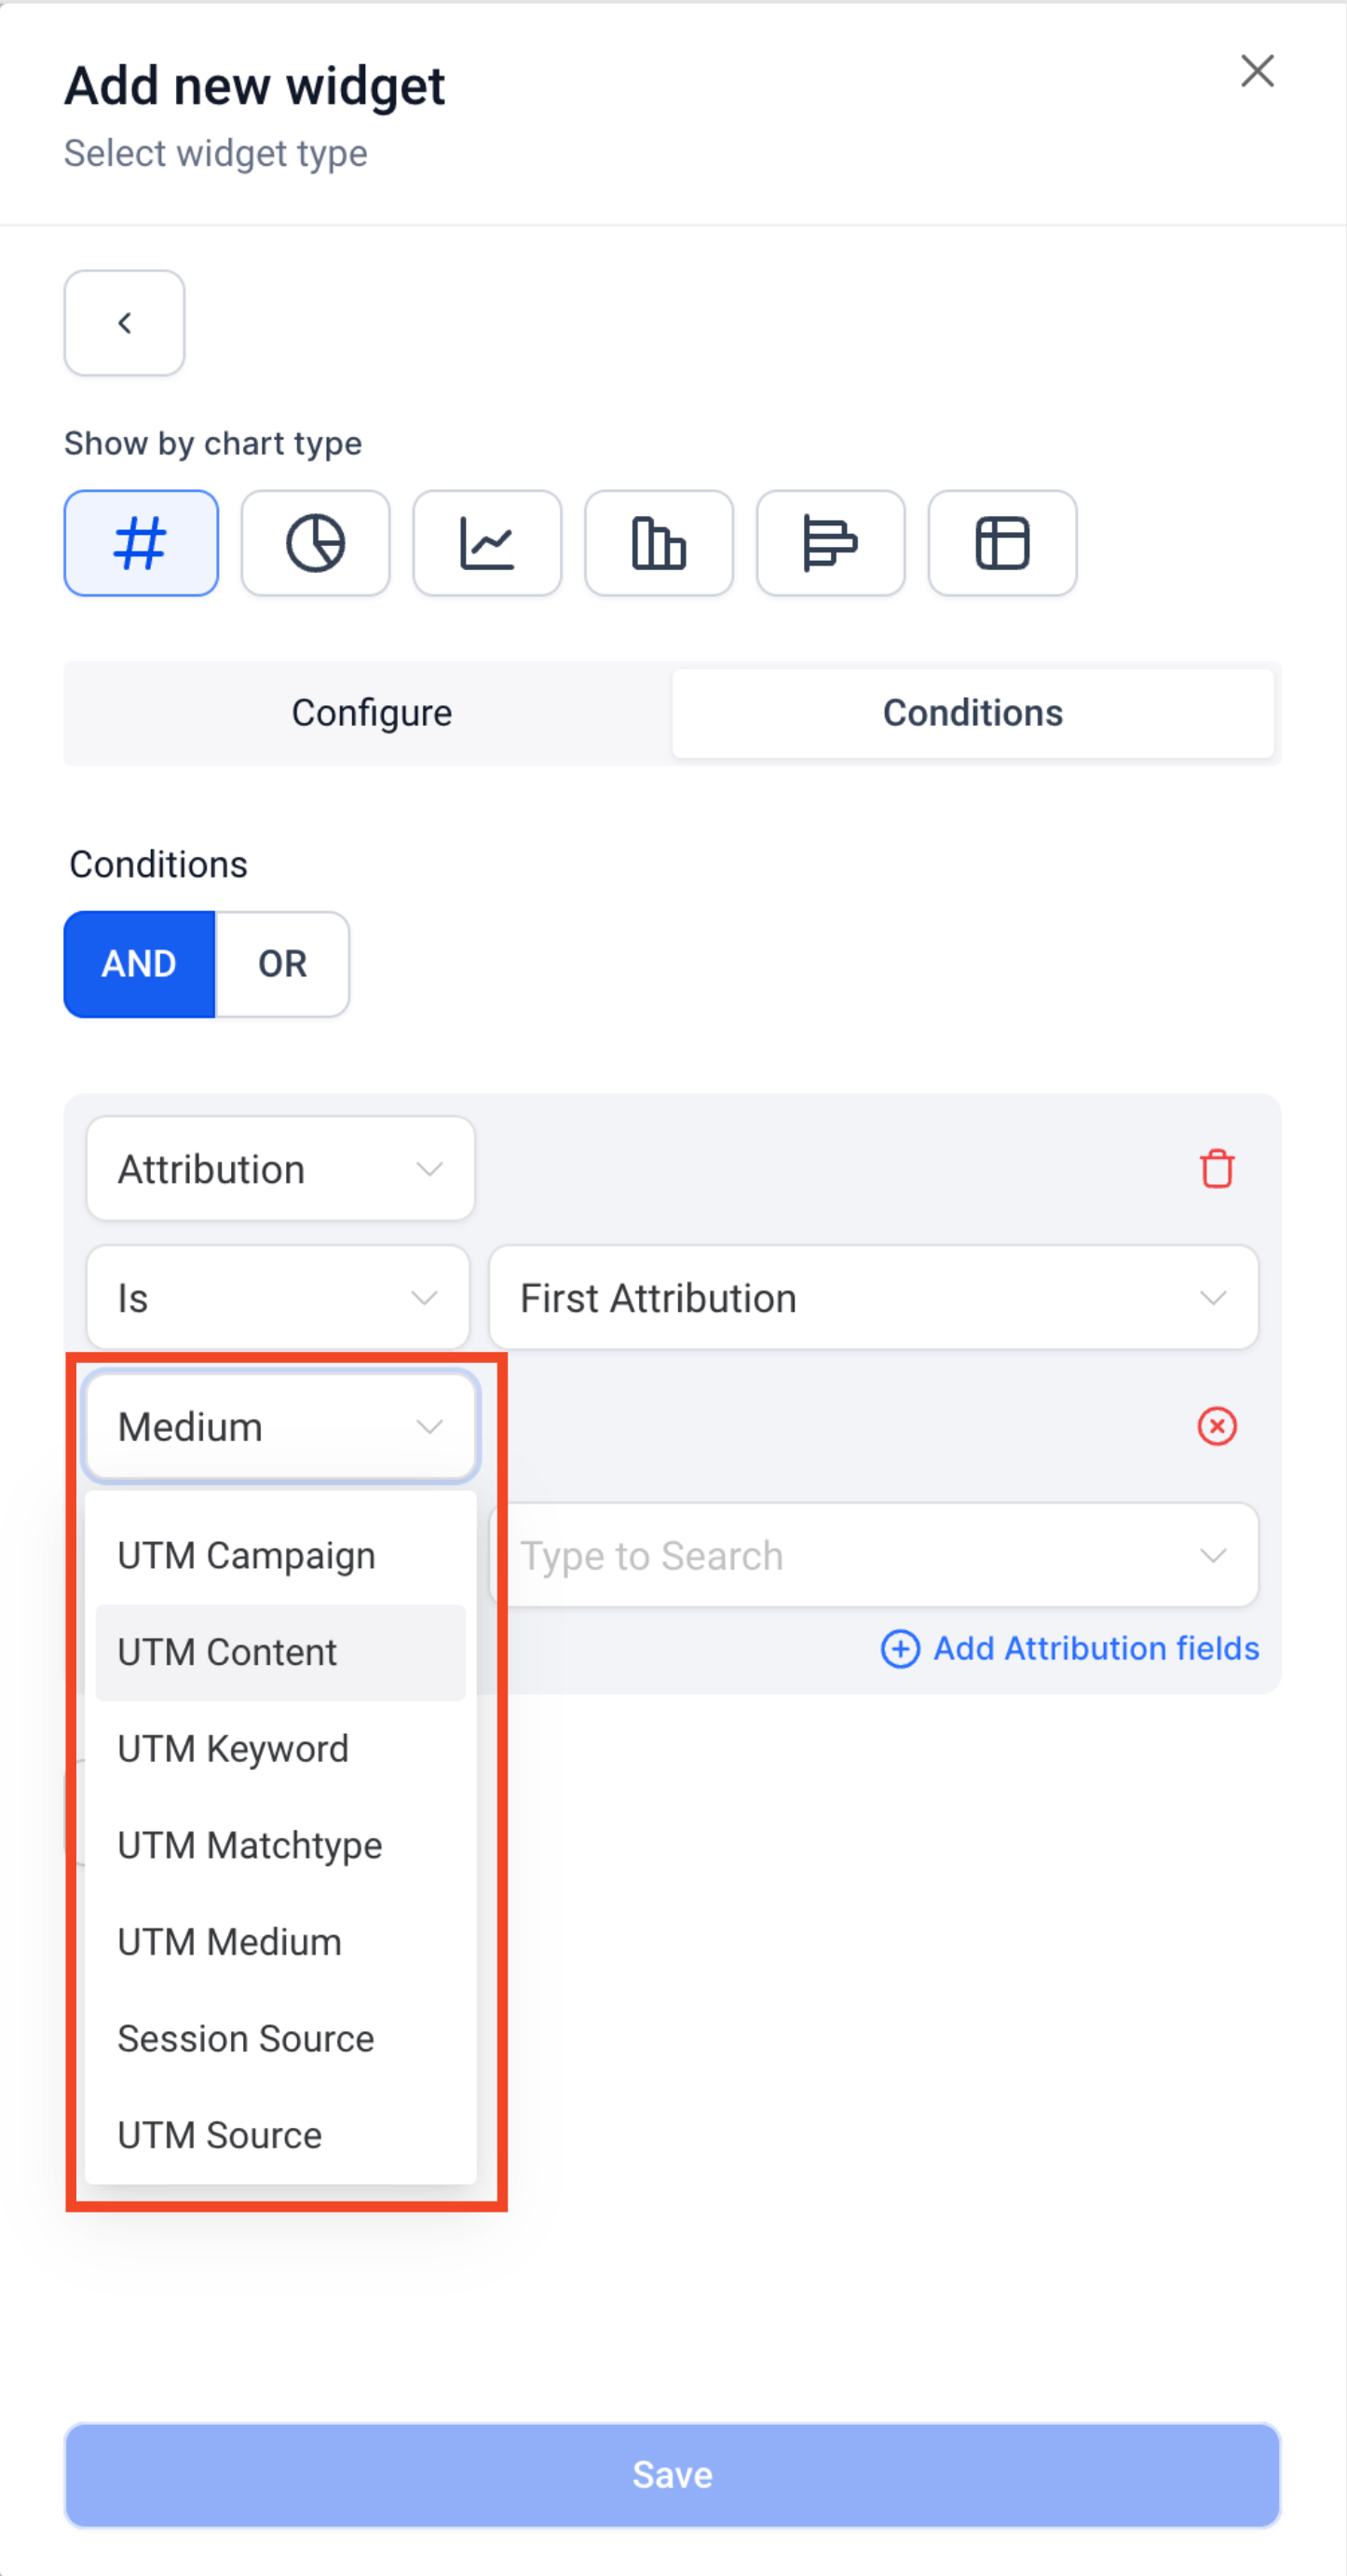
The following attribution and UTM properties are supported on custom widgets:
Property | What it captures |
|---|---|
UTM Source | Where the traffic originated (e.g. google, instagram, facebook) |
UTM Medium | The channel type (e.g. cpc, organic, email, referral) |
UTM Campaign | The campaign name |
UTM Campaign ID | The campaign's unique ID |
UTM Content | The specific ad or content variant clicked |
UTM Keyword | The search keyword that triggered a paid ad |
UTM Match Type | The keyword match type used in a paid search campaign |
UTM Ad ID | The specific ad's unique ID |
UTM Ad Group ID | The ad group's unique ID |
Session Source | The channel that generated the session (organic, paid, social, direct, referral) |
Medium | A simplified version of channel type, used for grouping donut and line charts |
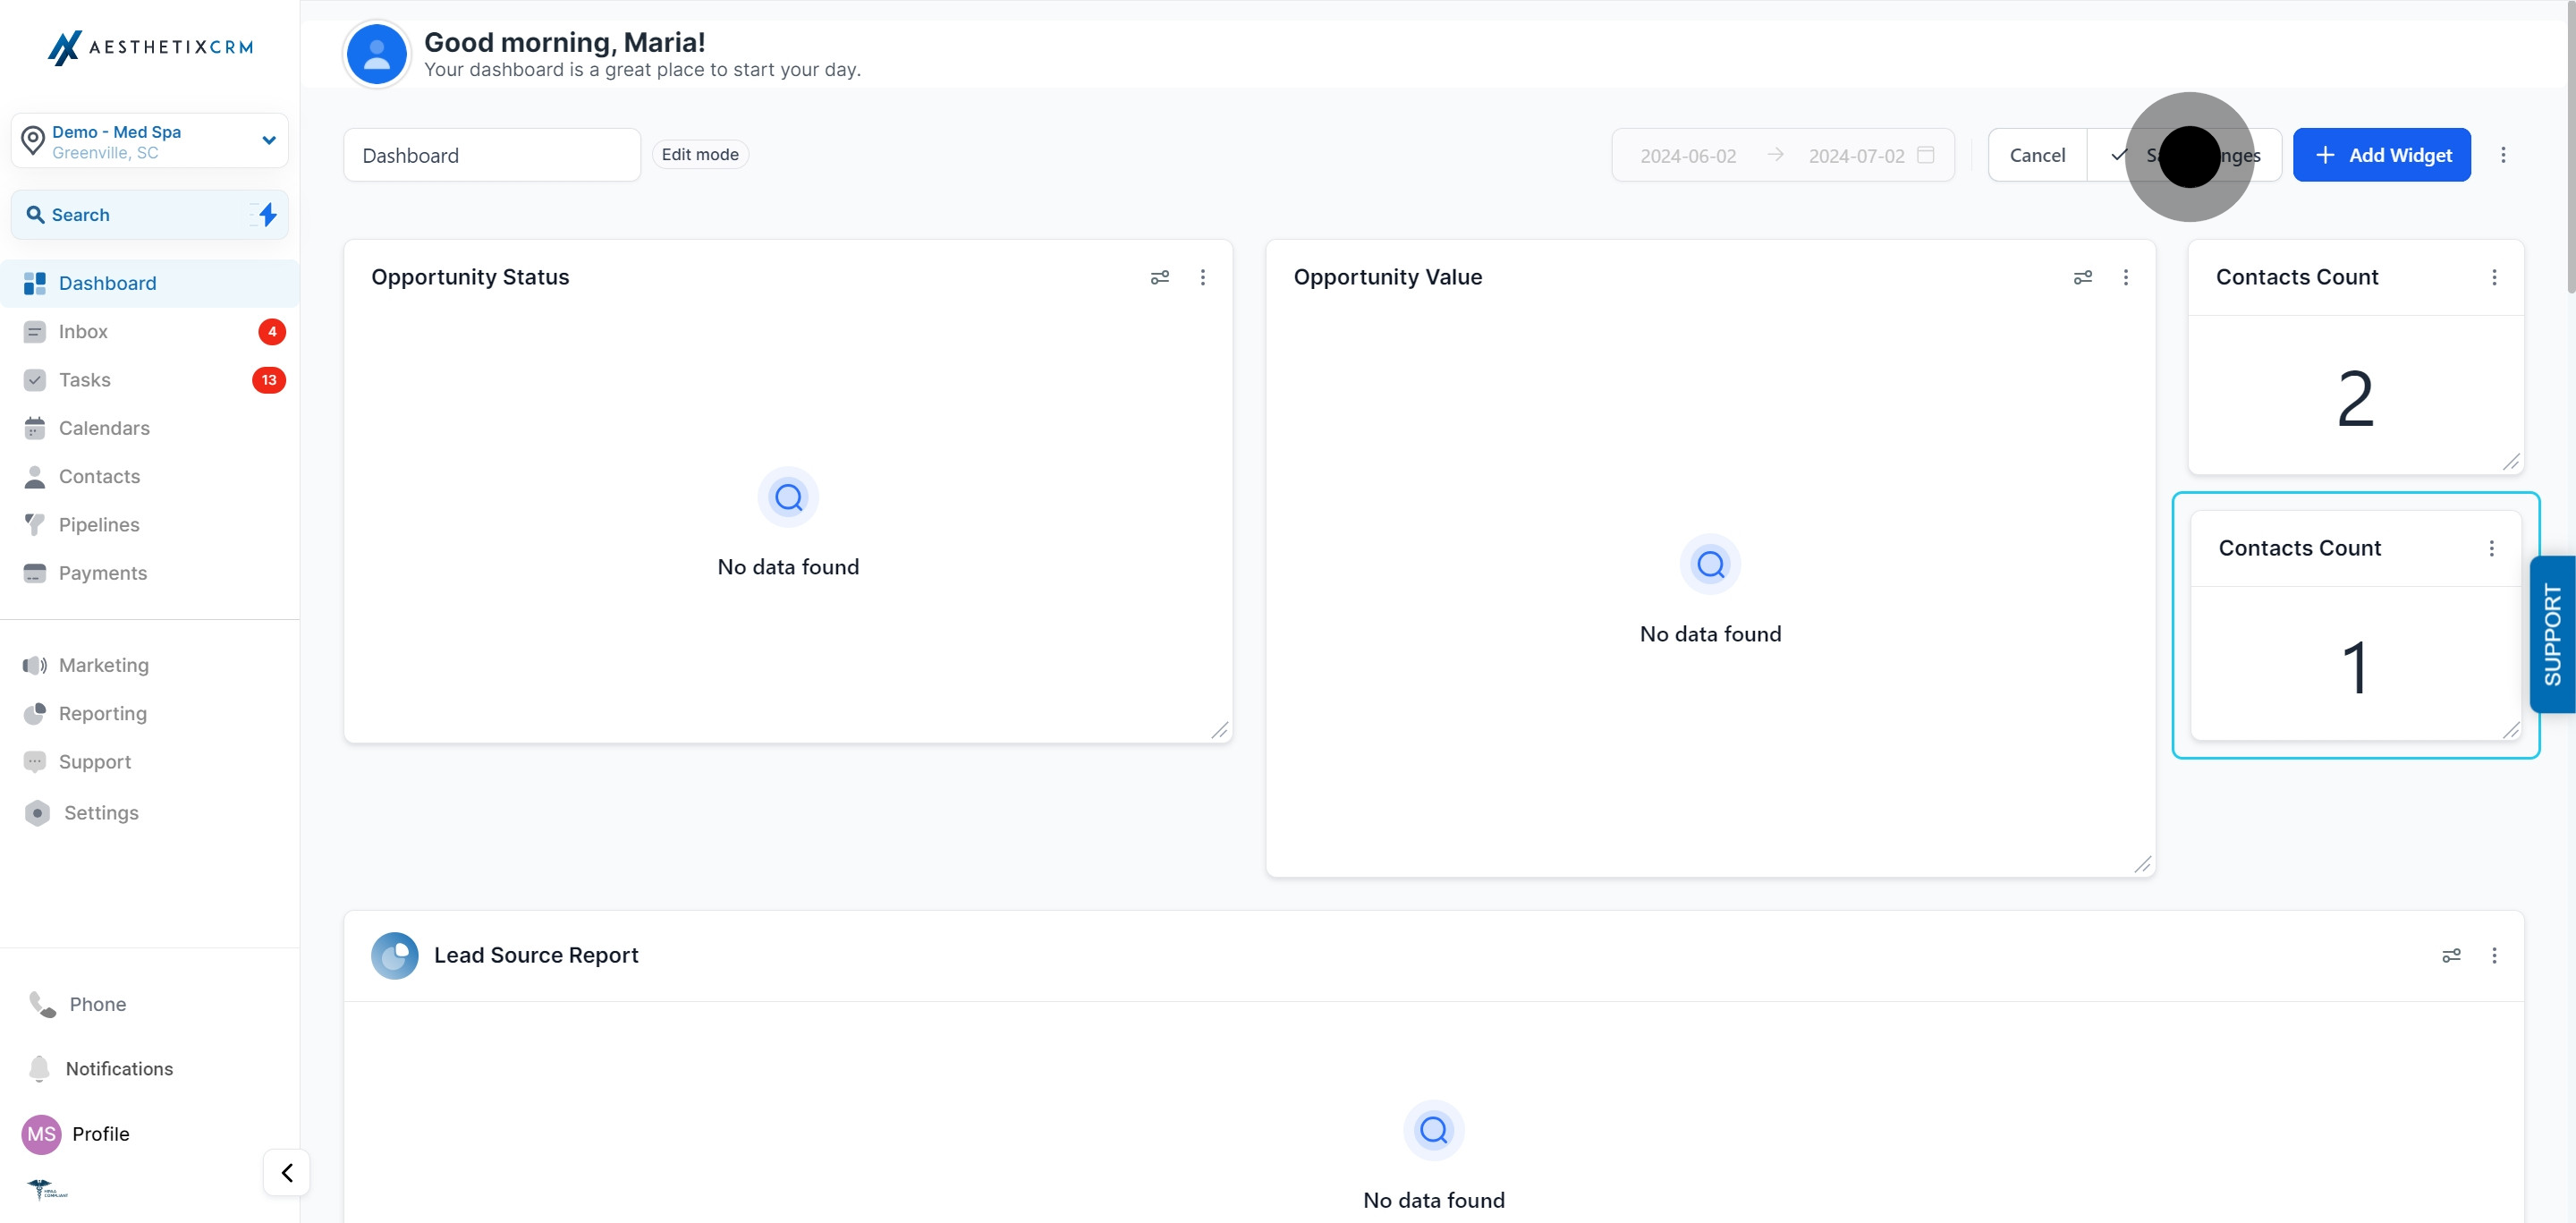
Attribution and UTM data only shows up on Contact and Opportunity widgets, not on other widget categories.
UTM columns and fields only appear on Table charts and in Granular Insights once an Attribution type (First or Latest) is added under the widget's Conditions.
Session Source and Medium can only be chosen as a Group/View By property once an Attribution type has been added under Conditions.
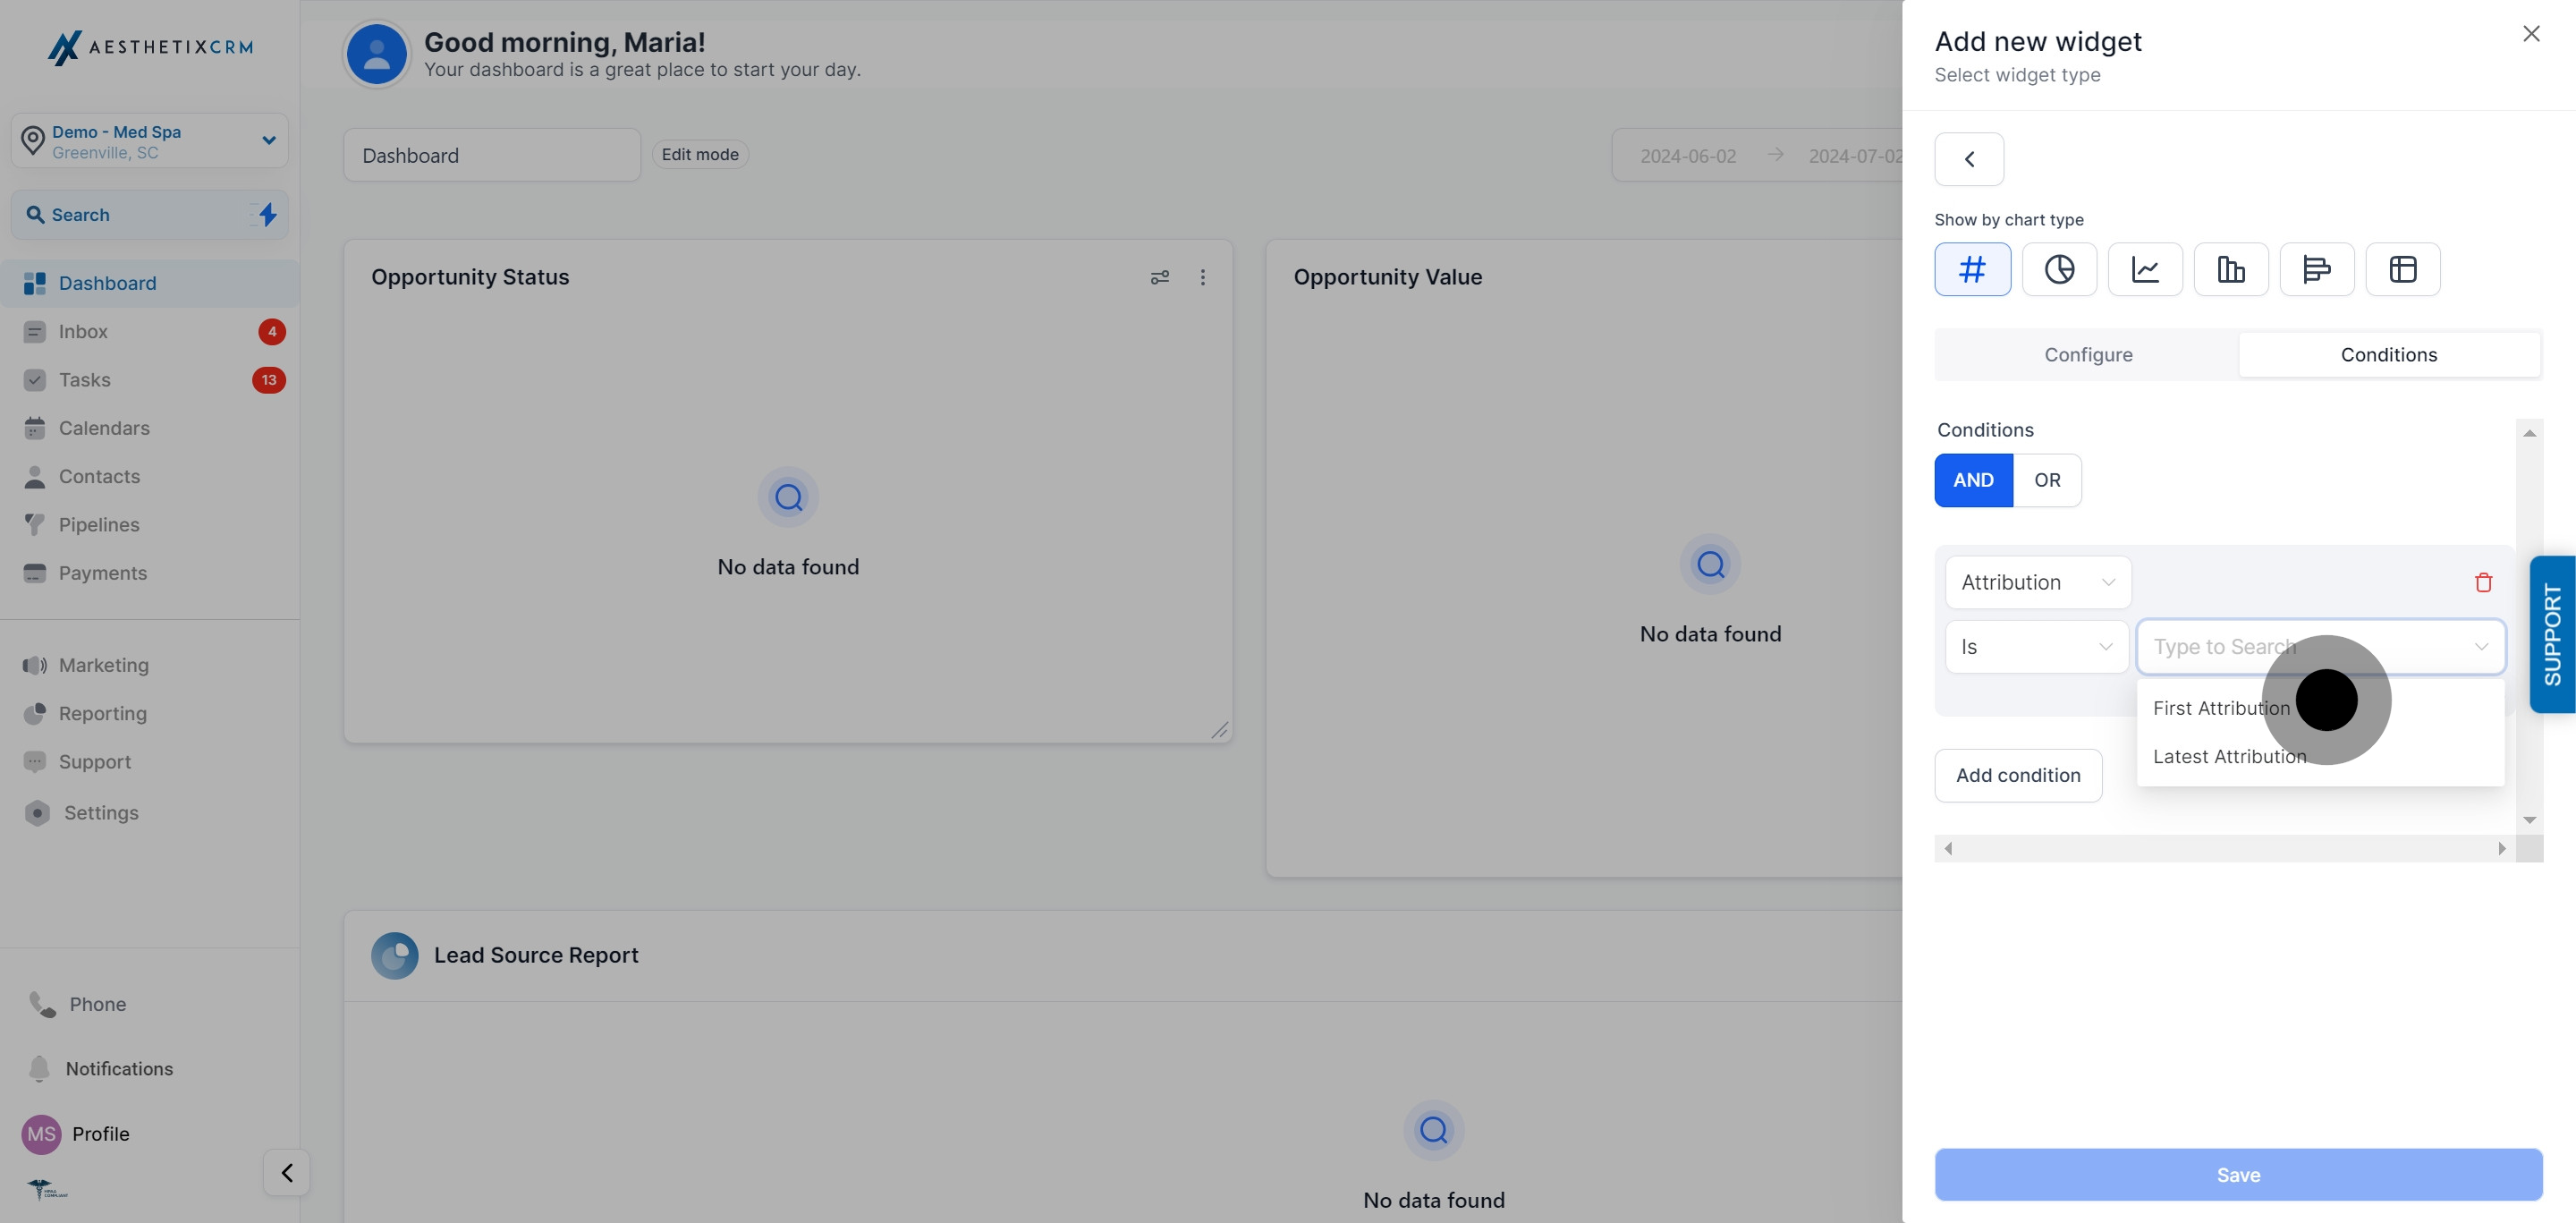
First Attribution reflects the channel that brought the contact in for the very first time; Latest Attribution reflects the most recent touchpoint before conversion. Use First Attribution to judge which channels generate new patients, and Latest Attribution to judge which channels close them.
For a broader walkthrough of setting up UTM tagging and campaign tracking across your practice's marketing channels, see the attribution guide in Essential Guides. Ad-specific performance numbers (spend, clicks, cost per lead) live in Ad Manager's reporting tools rather than on these dashboard widgets.
Why don't I see Attribution as an option when I add a condition? Attribution conditions are only available on Contact and Opportunity widgets. If you added a different widget category, switch the widget or start over from a Contact or Opportunity widget.
Why are my UTM columns missing from my Table chart even after I selected them? UTM columns only display once an Attribution type (First or Latest) has been added as a condition on that same widget. Add that condition, then your selected columns will populate.
What's the difference between First and Latest Attribution? First Attribution shows the channel that brought the contact into your system the very first time. Latest Attribution shows the most recent channel that touched the contact before they converted. Both are useful: First tells you what's generating new patients, Latest tells you what's closing them.
Can I group a bar chart by Session Source, or only donut and line charts? The Group/View By property for Session Source and Medium is available on donut and line chart types. Other chart types may support different grouping options depending on the widget category selected.
Do I need a specific plan to use attribution and UTM tracking on dashboards? No, attribution and UTM tracking is a standard part of Contact and Opportunity dashboard widgets in Aesthetix CRM.
Will this attribution data show which specific ad a patient clicked? Yes, if you add UTM Ad ID or UTM Ad Group ID as a column or filter, and your ad links were tagged with UTM parameters when the campaign was set up. Untagged links or organic visits will show as Session Source/Medium only, without ad-level detail.
Can I filter a widget down to just one channel, like Instagram? Yes. Add an Attribution condition, choose Session Source (or UTM Source) as the attribution field, and set the value to the channel you want, then save the widget. It will only reflect contacts or opportunities matching that source.
Why does my donut chart show "Direct" or "Unknown" for a lot of contacts? Contacts land in Direct or Unknown when no UTM parameters or referring session data were captured, for example if a patient typed your website address directly, came from an untagged link, or was manually added to your account.
Does this attribution data include EMR-booked appointments? No. Session Source, Medium, and UTM attribution track how a contact reached Aesthetix CRM through forms, funnels, and websites. Appointments booked or managed through your EMR won't carry the same UTM/session attribution data.
Can I export the attribution data shown in a Table chart? Yes, Table charts and Granular Insights views support CSV export, which will include any attribution and UTM columns you've added to the widget.
