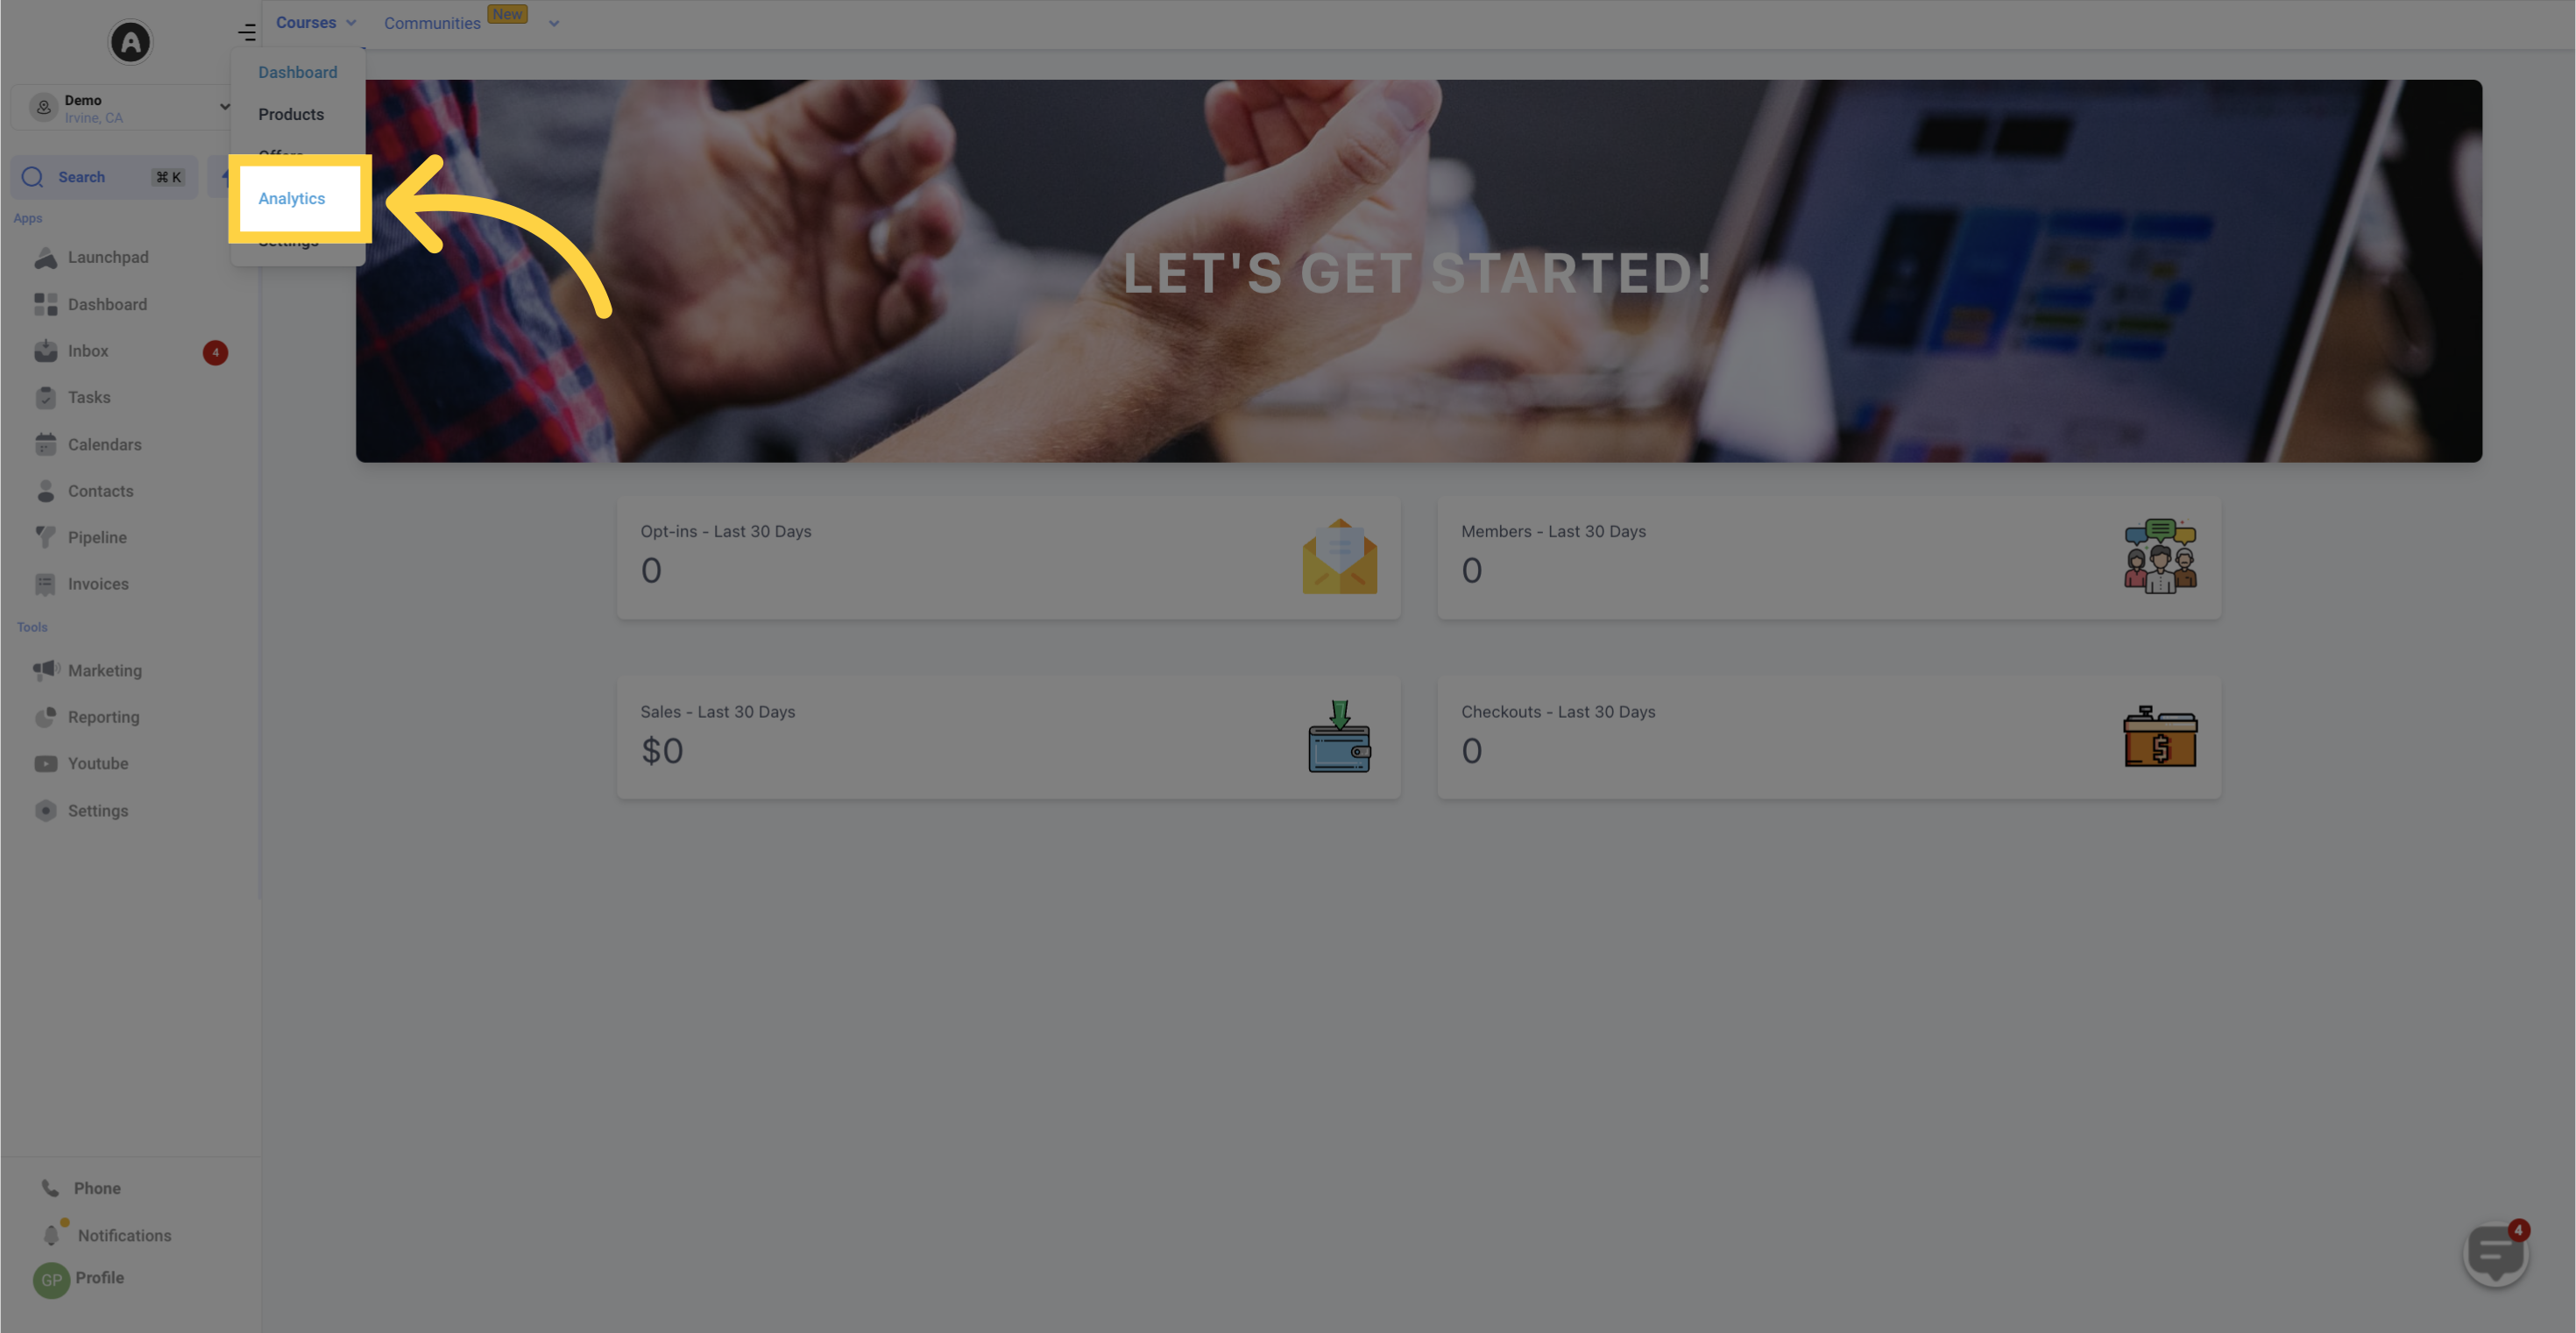
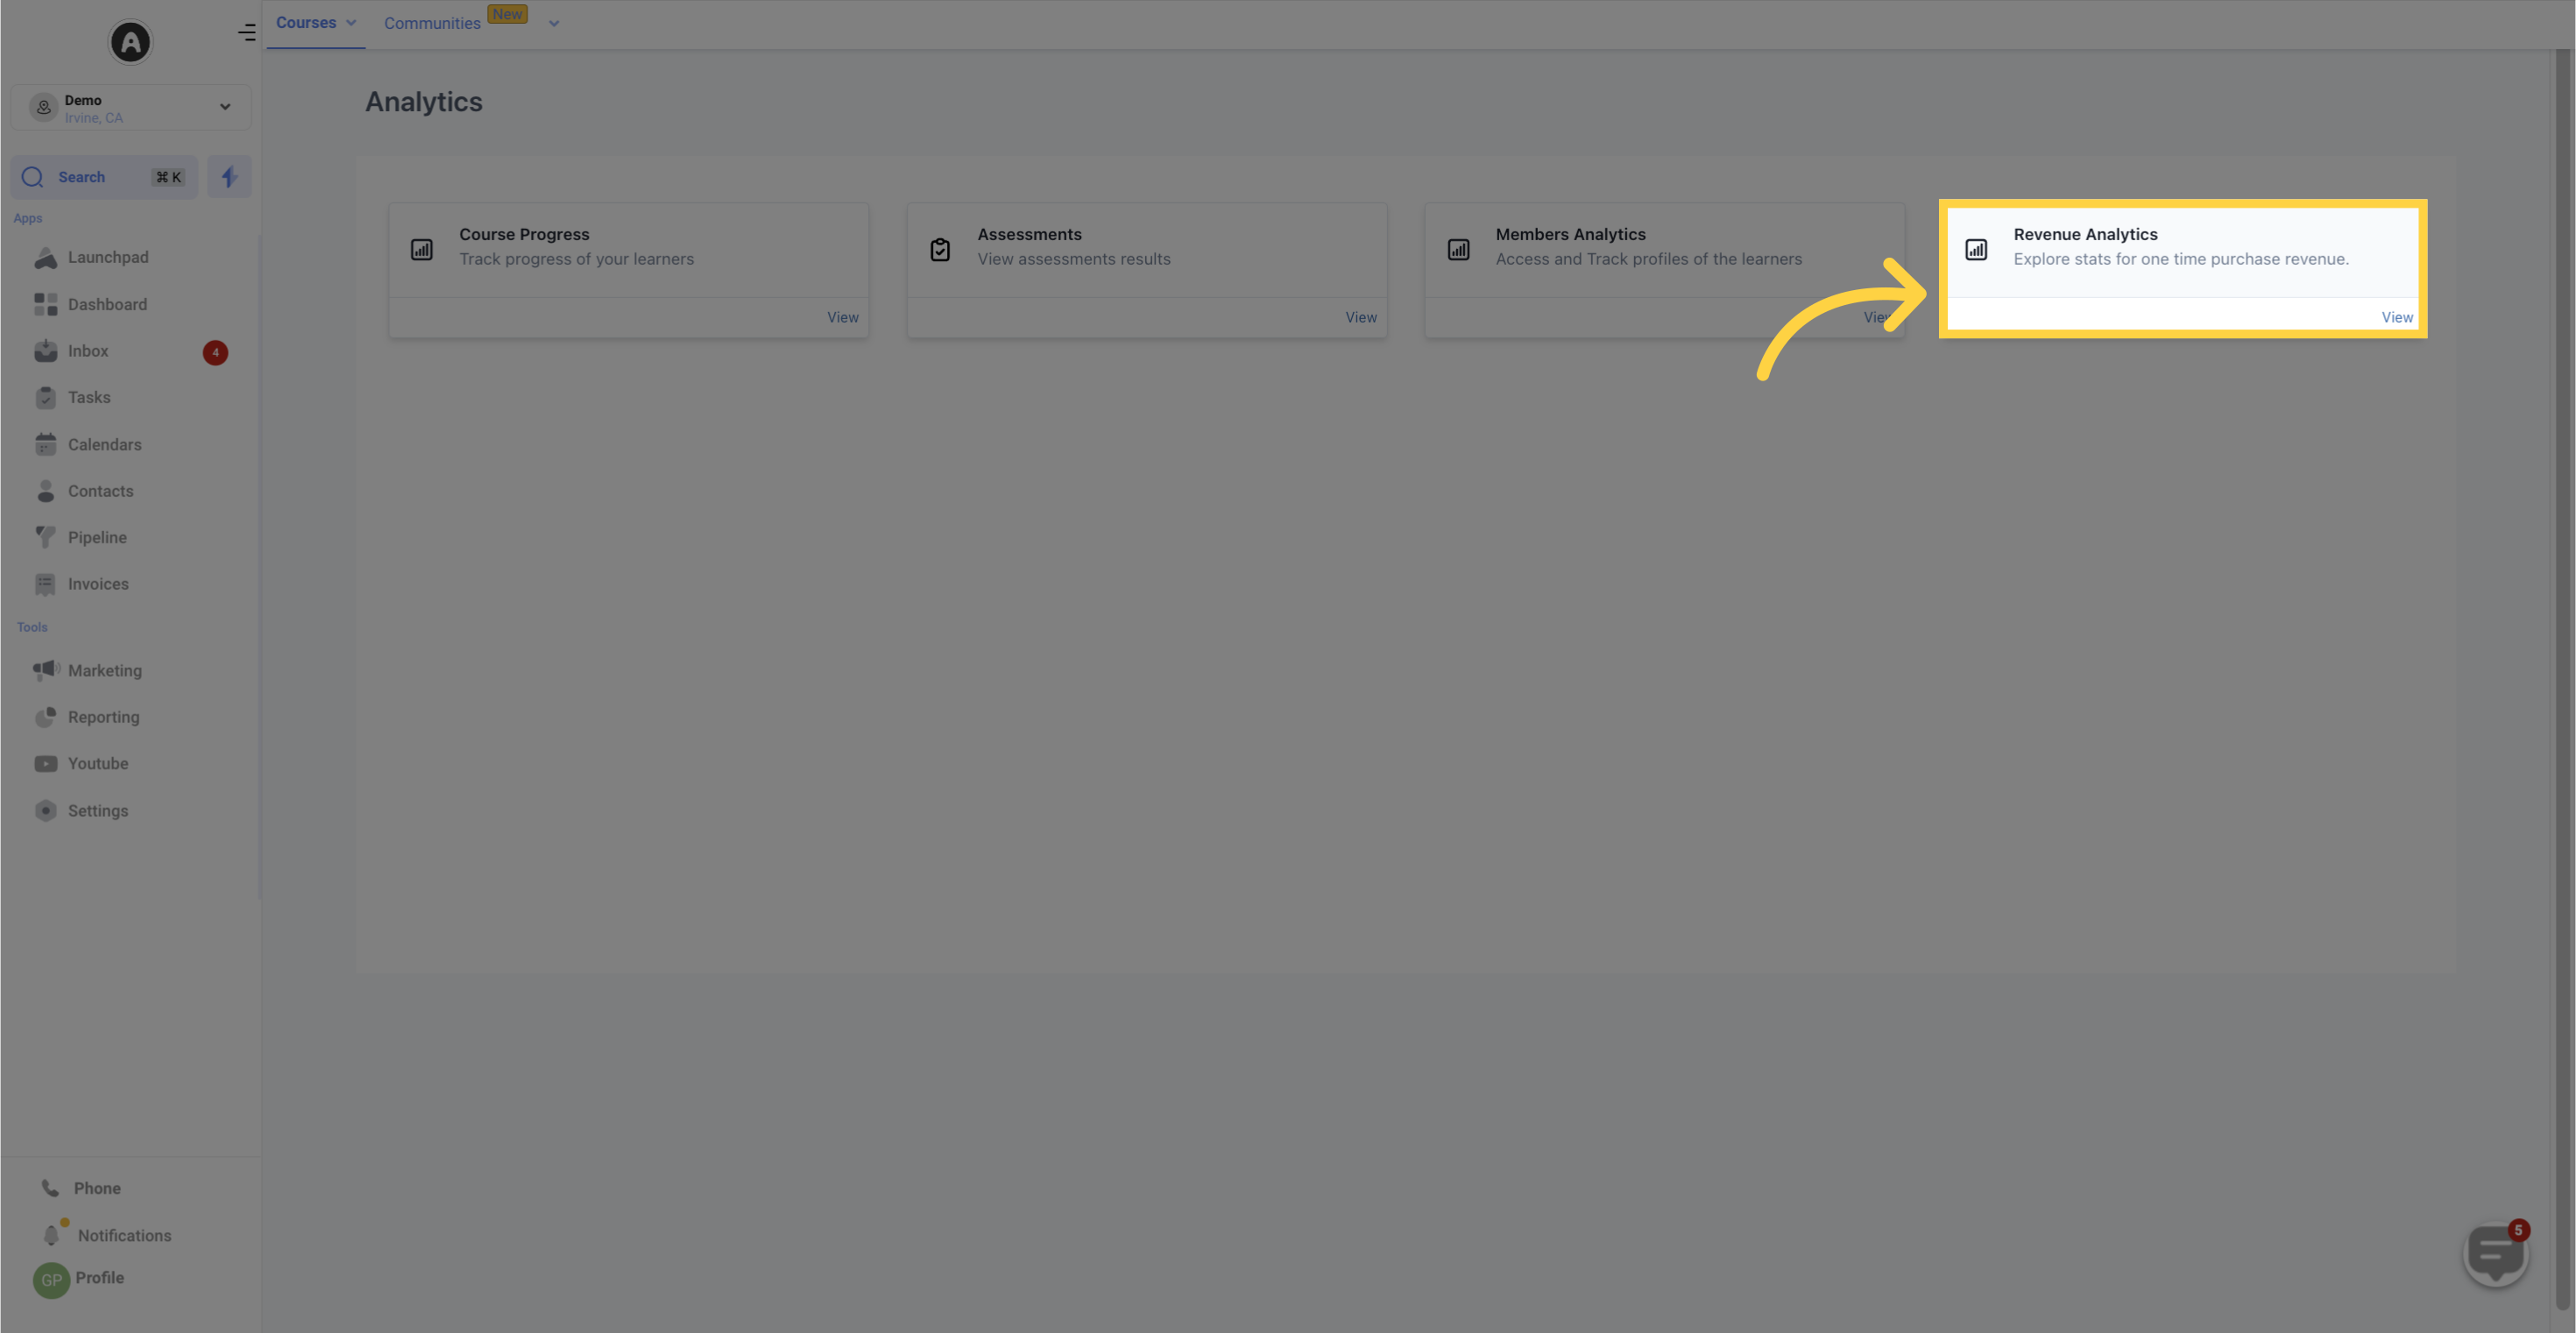
The Revenue Analytics feature is a powerful tool that provides businesses with detailed insights into their revenue data to help them make informed decisions about their marketing strategies. It offers a granular view of revenue distribution across different purchase channels and offers, allowing businesses to track one-time purchase revenue. By filtering the data by date and purchase channel, businesses can gain valuable insights into the revenue generated from various sources.
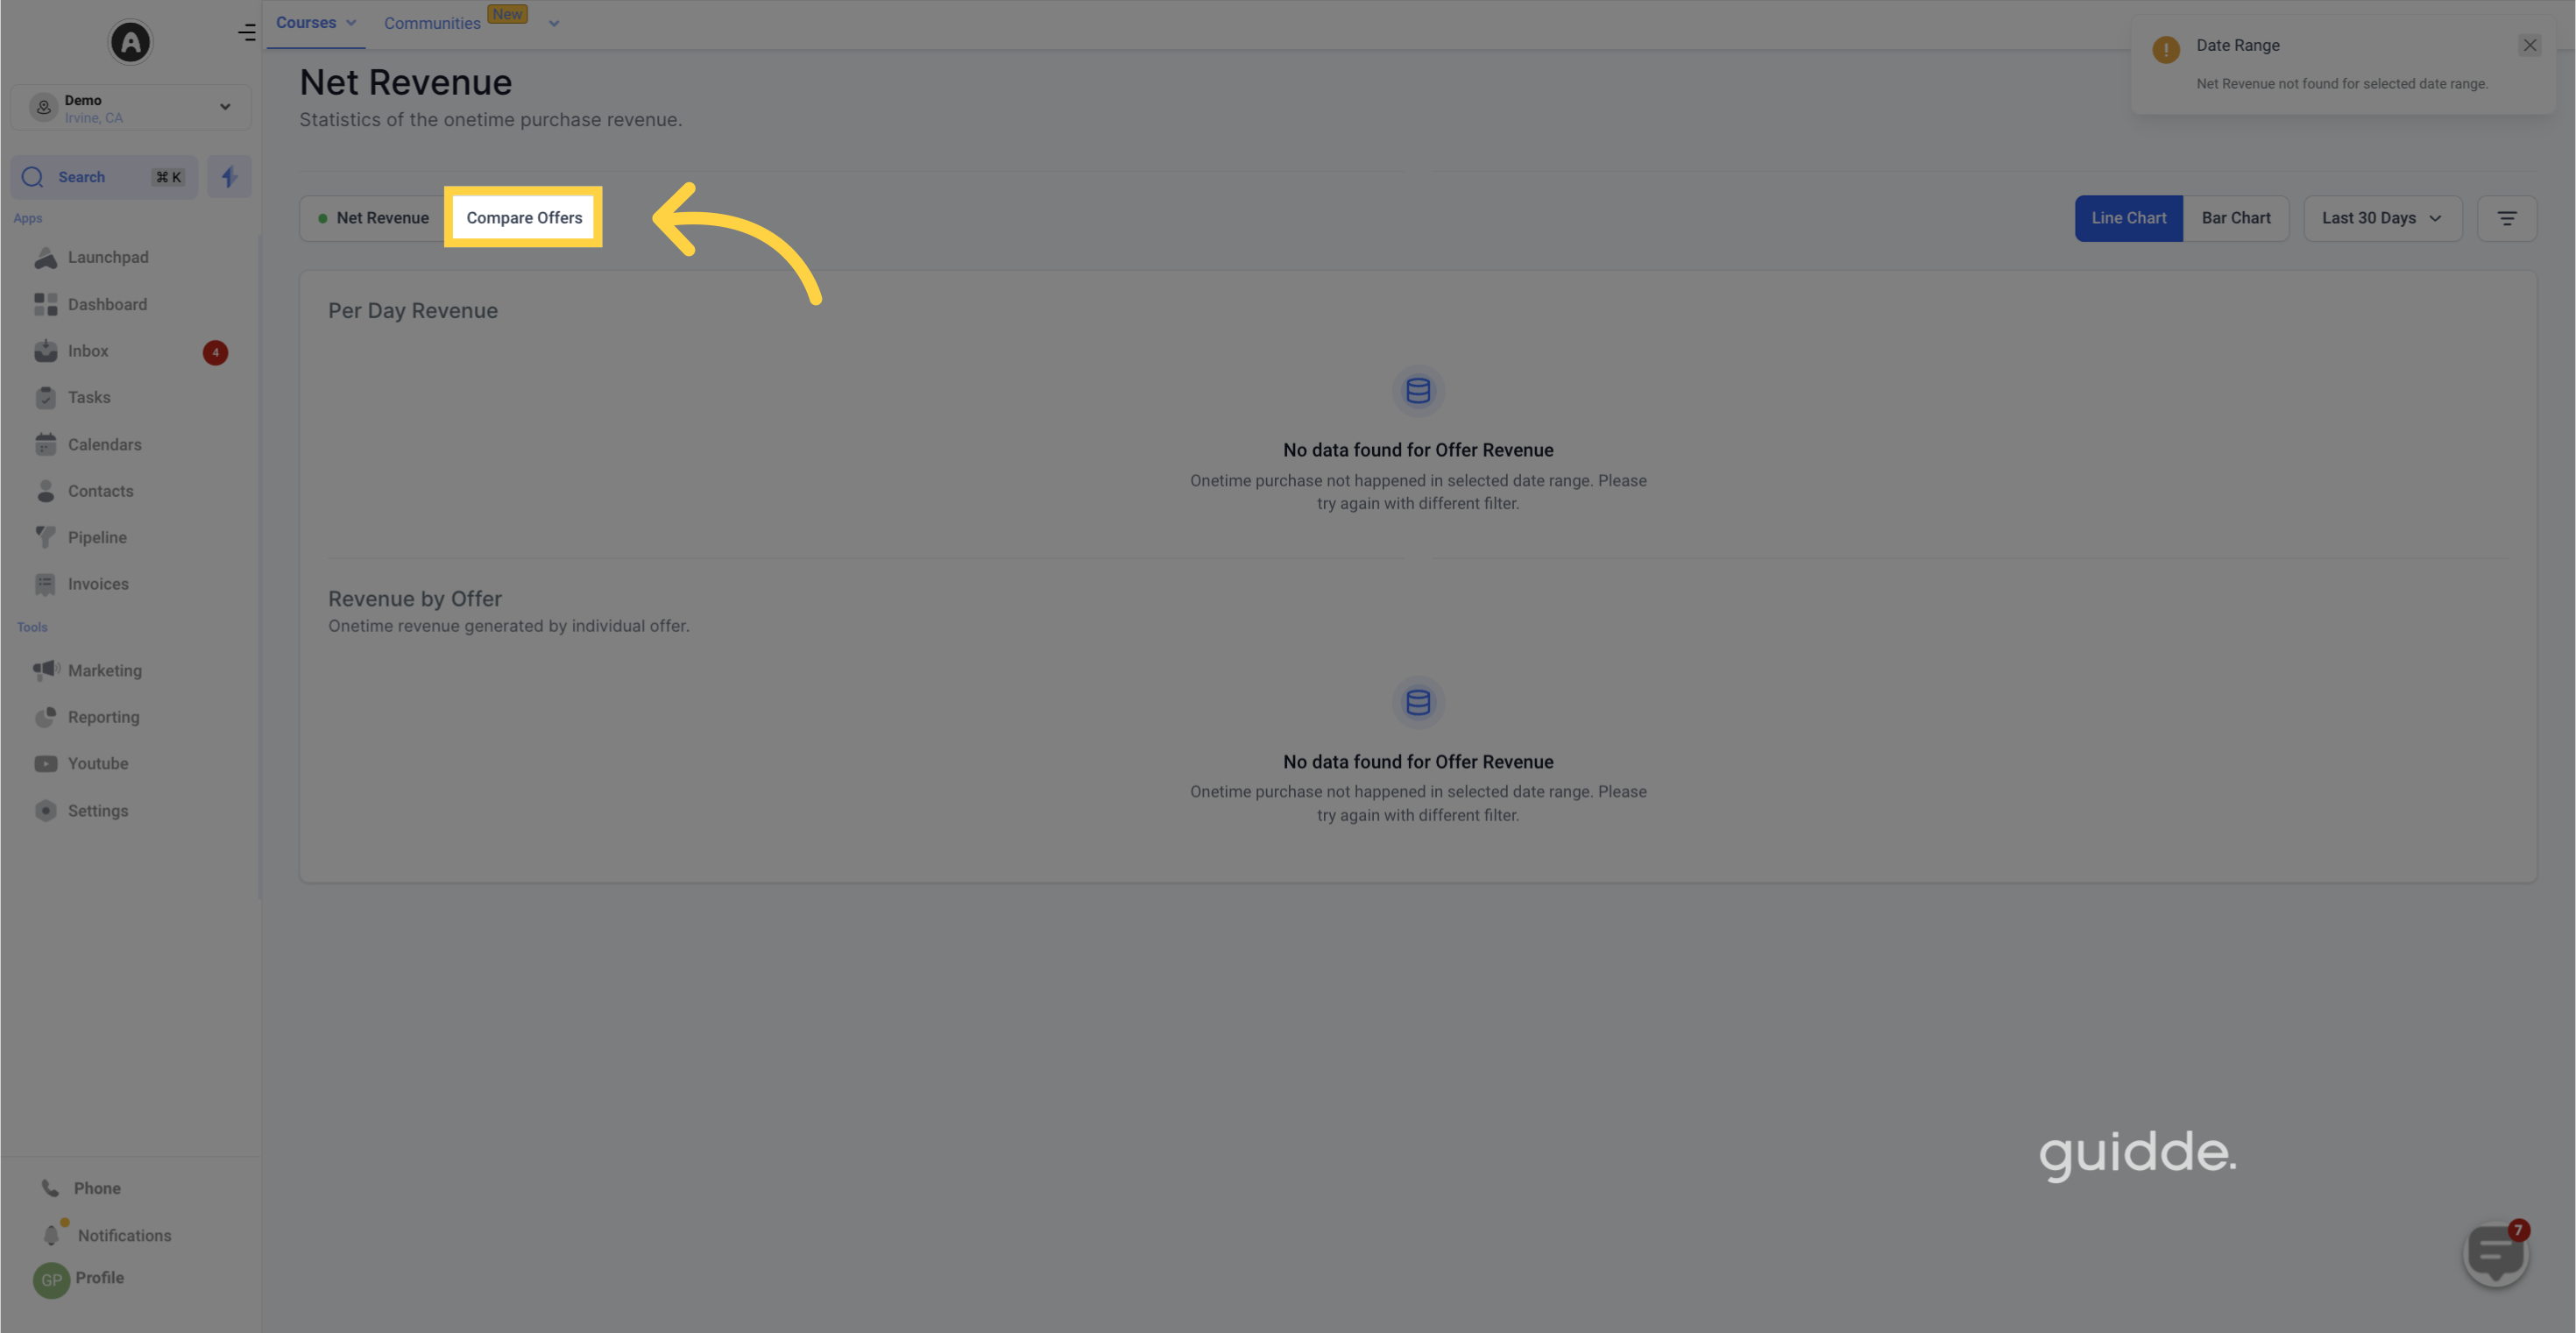
With the Net Revenue and Revenue by Offer charts, businesses can easily assess their revenue performance, including the total units sold, total revenue, and the distribution of the top four offers. This information helps businesses identify their top-performing offers and optimize their marketing strategies to promote them effectively. The Compare Offers feature allows businesses to analyze the performance of different offers across different channels, enabling them to refine their marketing strategies and promote their best-performing offers across all channels.
By utilizing the ability to filter data by date and purchase channel, businesses can delve deeper into revenue trends over time and identify the most profitable channels and offers. These insights empower businesses to make data-driven decisions when allocating resources and optimizing their marketing strategies, ultimately leading to increased profitability and improved operational efficiency.
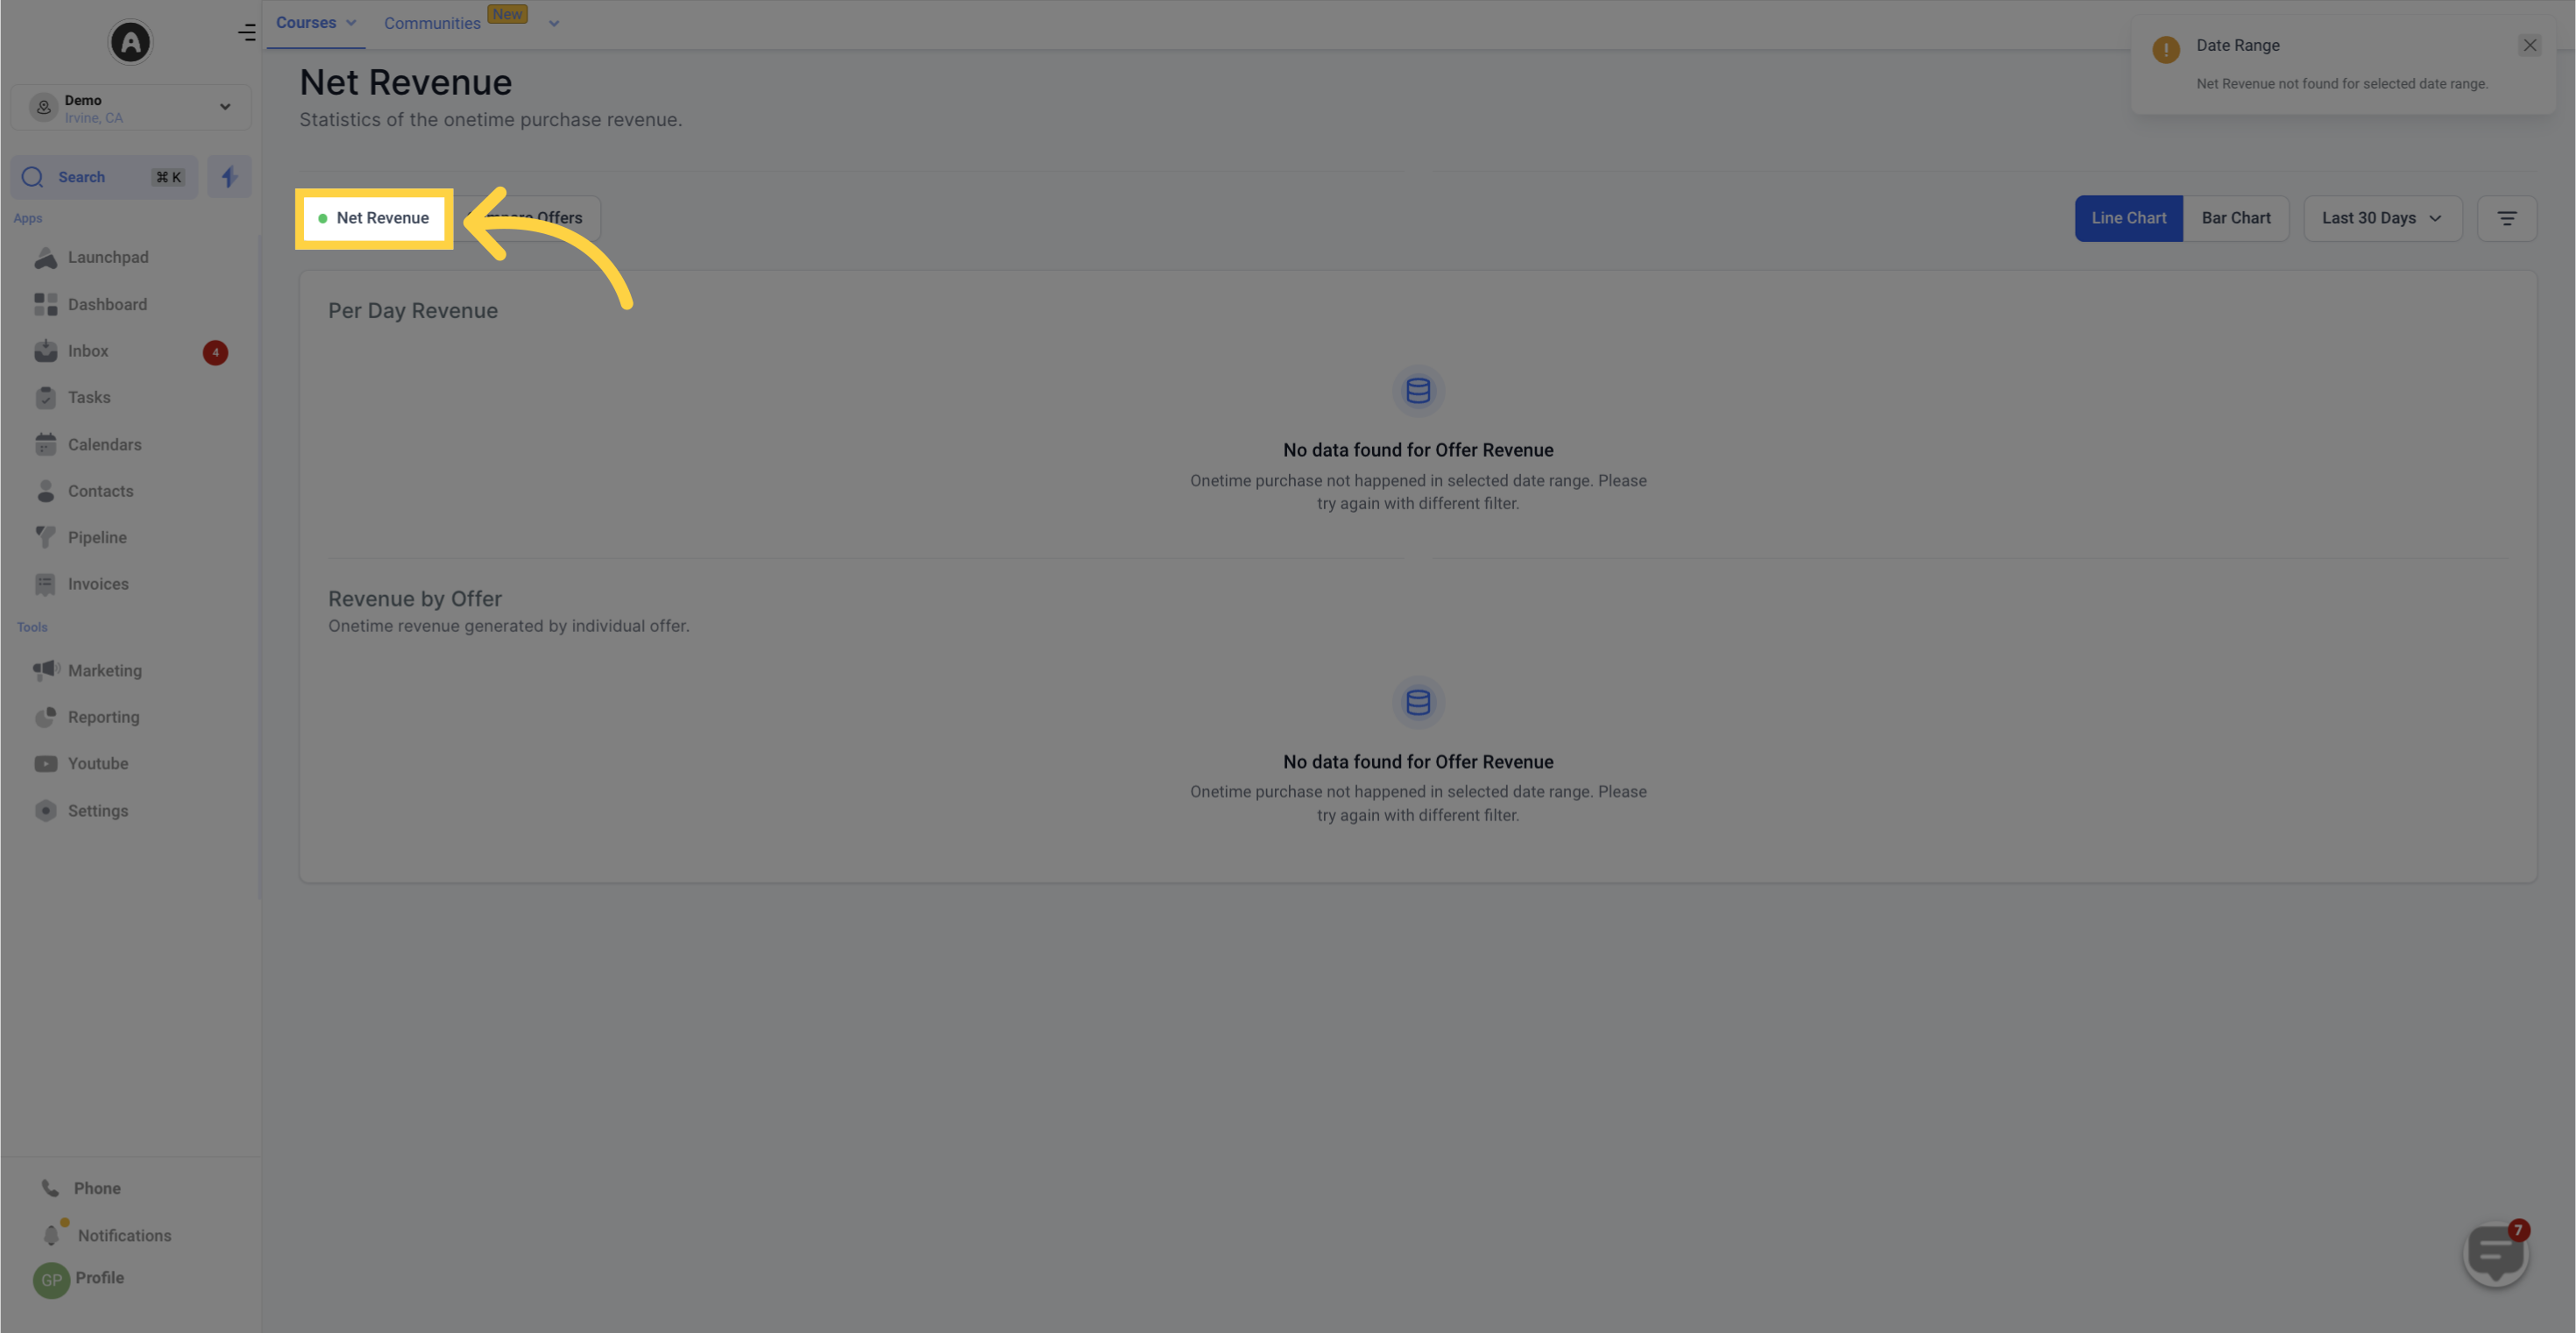
is a key component of Revenue Analytics, providing businesses with a comprehensive breakdown of their revenue from one-time purchases. This tab offers valuable insights by allowing users to filter data based on date and purchase channel.
Total Units Sold: This feature displays the total number of units sold within the selected date range and purchase channel. For example, an online clothing retailer can quickly identify the number of clothing items sold on their website in the past 30 days.
Total Revenue: This feature showcases the overall revenue generated during the chosen date range and purchase channel. For instance, an e-commerce store can analyze the total revenue earned from website sales over the past six months.
Distribution of Top Four Offers: This function illustrates the distribution of the top four offers within the selected date range and purchase channel. It presents a list of the top four offers along with their respective revenue contribution percentages to the total revenue during that timeframe. For example, a software company can uncover the most profitable software products that accounted for the majority of revenue over the last year.
The Net Revenue tab provides users with convenient filter options to customize their data analysis. With the date filter, users can select a specific range to focus on. Additionally, the purchase channel filter offers up to four options, including Membership checkout, Funnel, and Upsell checkout, allowing users to delve deeper into specific channels of revenue generation.
The Compare Offers feature in Revenue Analytics is a powerful tool that allows businesses to analyze and compare the performance of different offers. With this feature, users can easily assess the revenue generated from each offer and make informed decisions.
Key Features:
Total Units Sold: This feature provides a comprehensive overview of the total number of units sold for each offer within a selected date range and purchase channel. For instance, a health and wellness company can leverage this data to compare the sales figures of their weight loss program and yoga classes over the past six months.
Total Revenue: The Total Revenue feature showcases the overall revenue generated by each offer during a specific period and purchase channel. This information is invaluable for e-commerce companies looking to evaluate the success of their top-selling products over the course of a year.
Filtering Options: The Compare Offers tab offers various filtering options to streamline data analysis. Users can apply filters based on the offer, purchase channel, and date. The offer filter allows users to select up to four offers for comparison, while the purchase channel filter provides a choice of Membership checkout, Funnel, and Upsell checkout. Furthermore, the date filter enables users to focus on a specific date range for precise analysis.
By utilizing the Compare Offers feature, businesses can gain valuable insights into the performance and revenue generation of different offers. This empowers decision-makers to optimize their strategies and drive growth.