In this segment, you'll have the ability to retrieve statistics corresponding to your Google Ads campaigns, encompassing all the varied parameters.
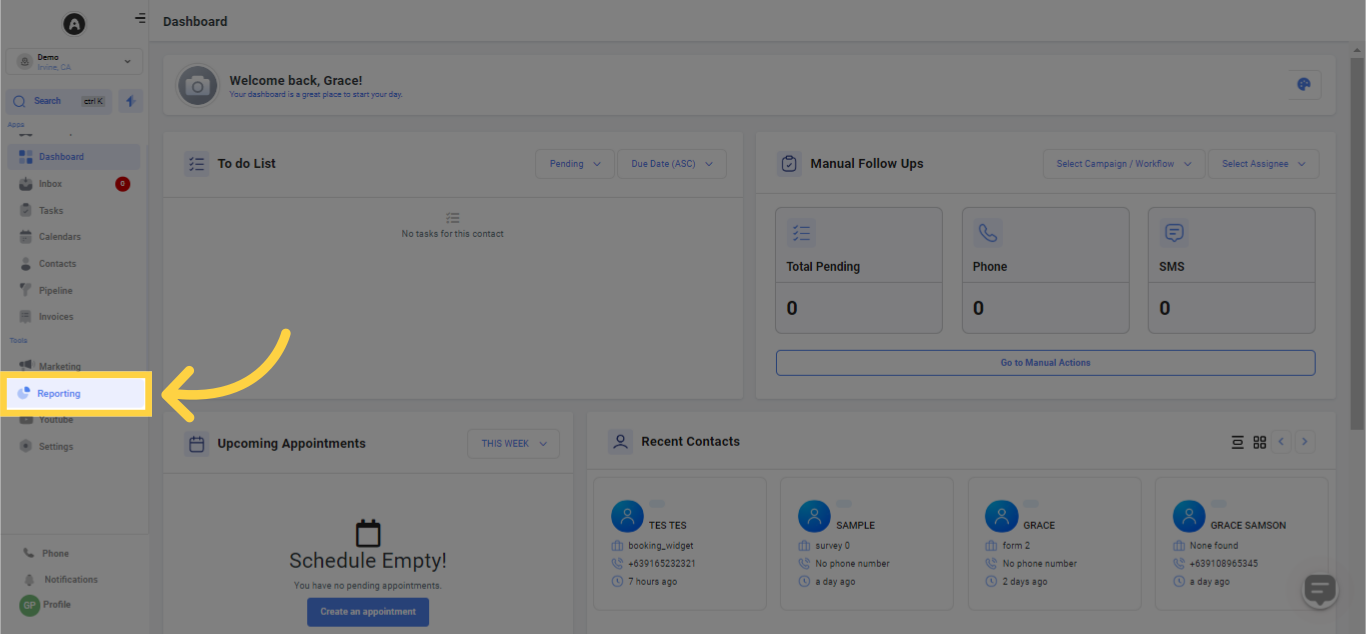
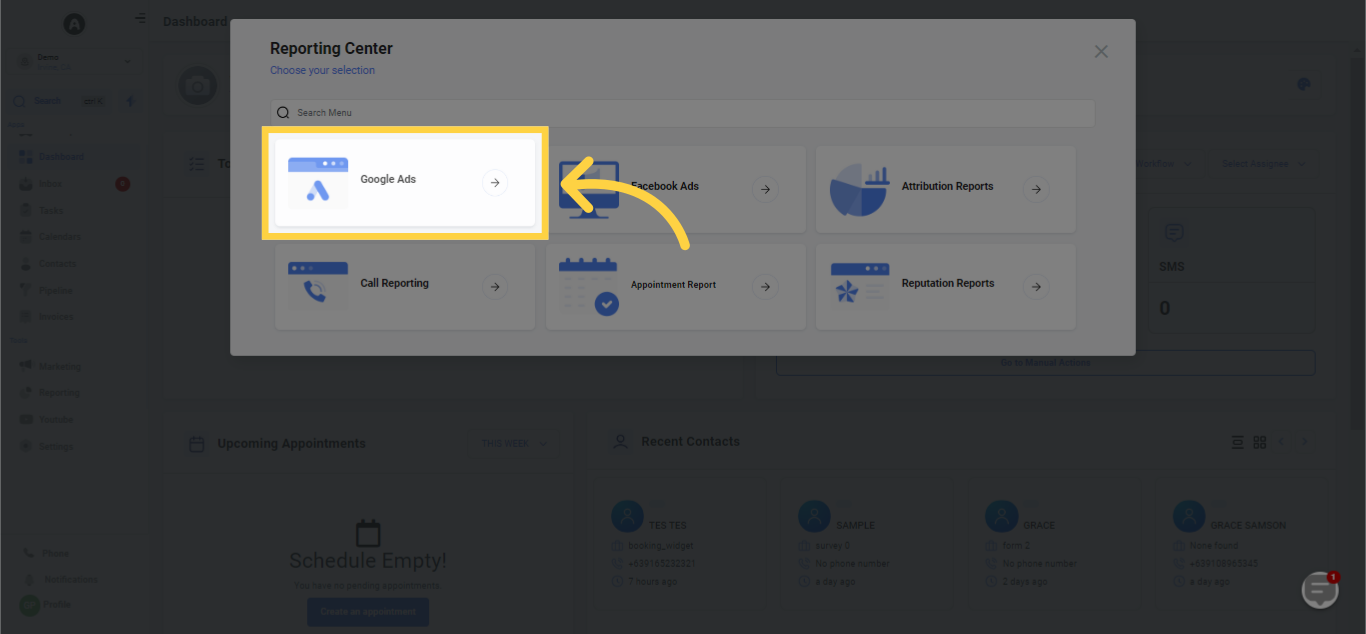
Within the Google Ads Reporting section of the Reporting Tab, you can examine statistics linked to your Google Ads campaigns, incorporating various parameters. This section allows you to visualize all campaigns, ad groups, ads, and even keywords. Conveniently track your Google Ads campaigns within your CRM, eliminating the need to navigate to the Google Ads Website!
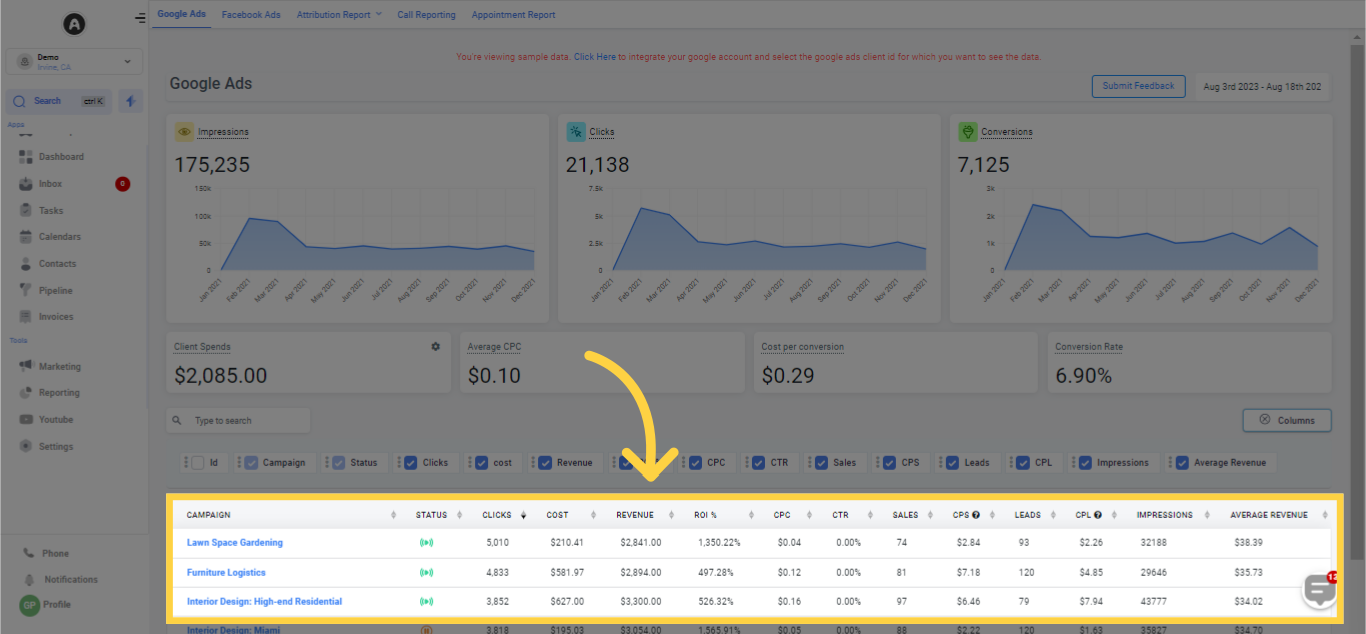
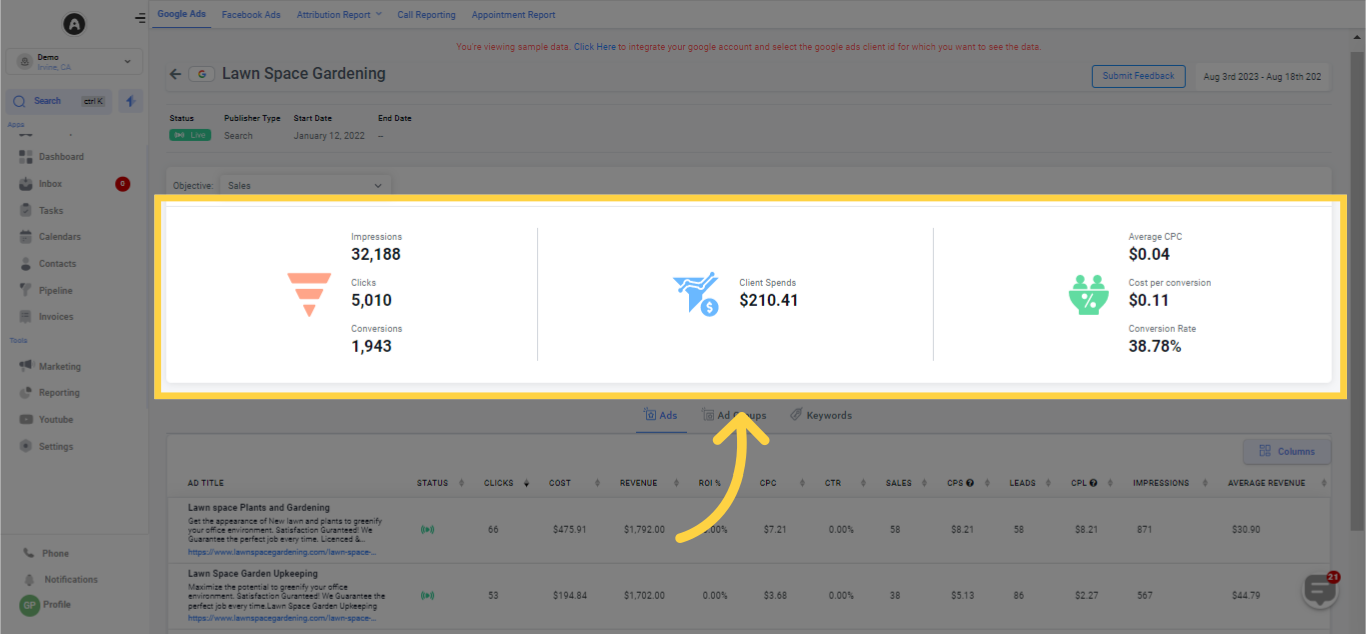
The dashboard offers a summary of your Google Ads account's functioning by exhibiting metrics like impressions, clicks, conversions, and more. Effortlessly observe the performance of your ads at the campaign level utilizing this convenient dashboard!
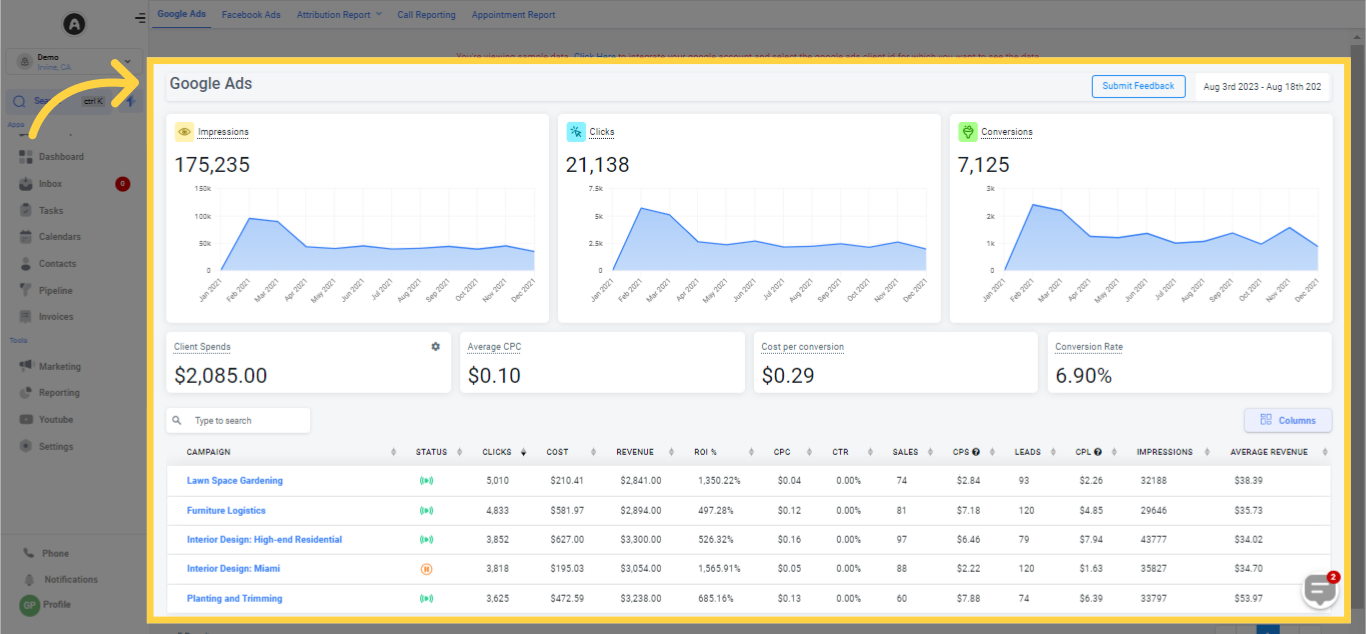
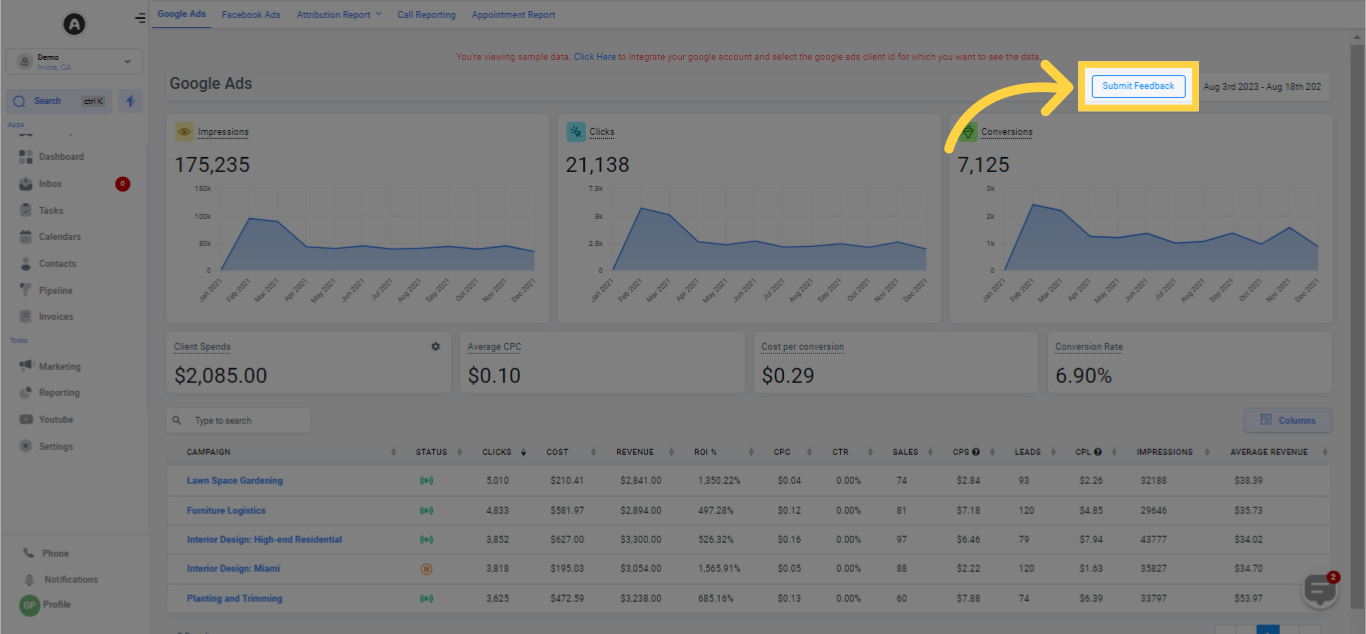
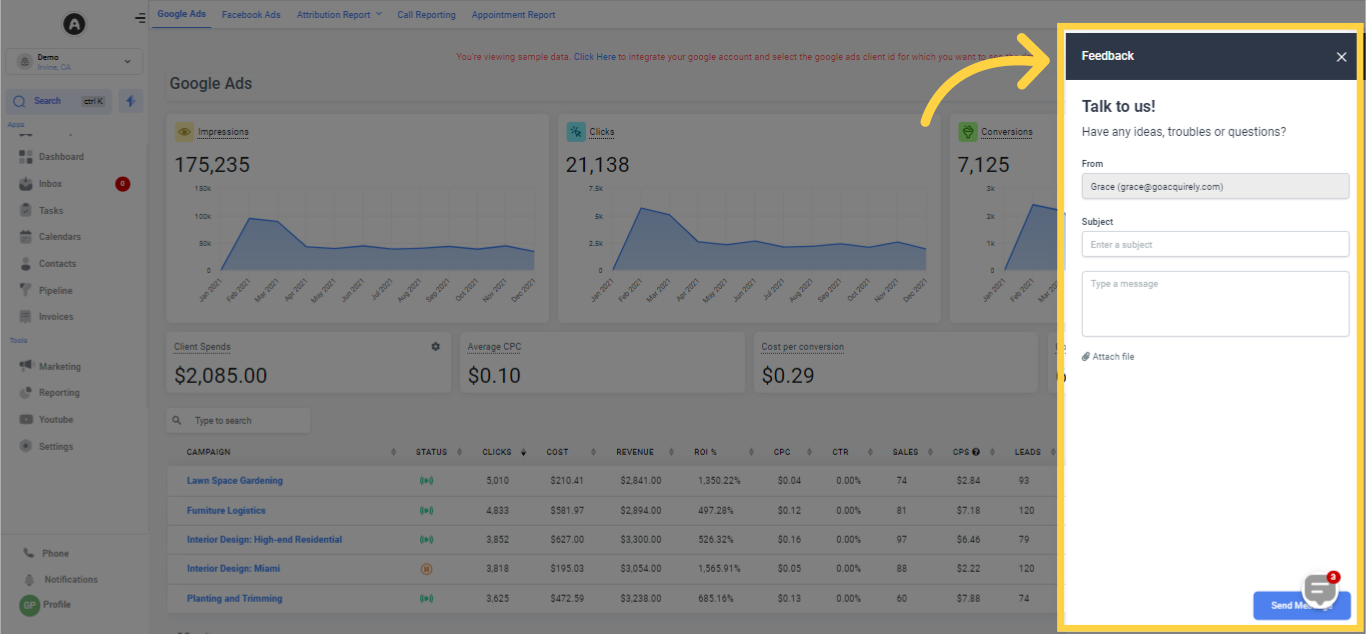
In the event that the reporting displayed on the dashboard does not correspond with your Google Ads account data, you can employ the Submit Feedback button to share your concerns. Upon clicking this button, a sidebar will appear for you to compose an email that includes a subject and message, and even allows you to attach a file to illustrate the problem you're experiencing. After composing your message, simply click on the green Send Message button positioned in the bottom right corner.
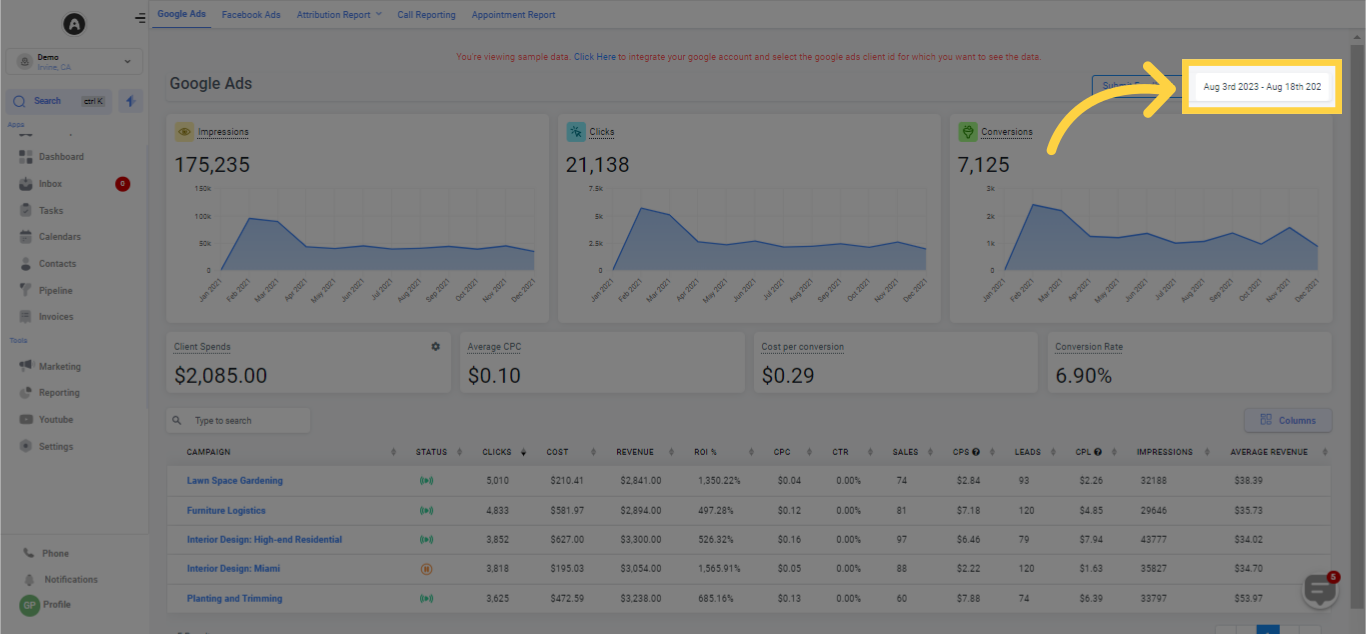
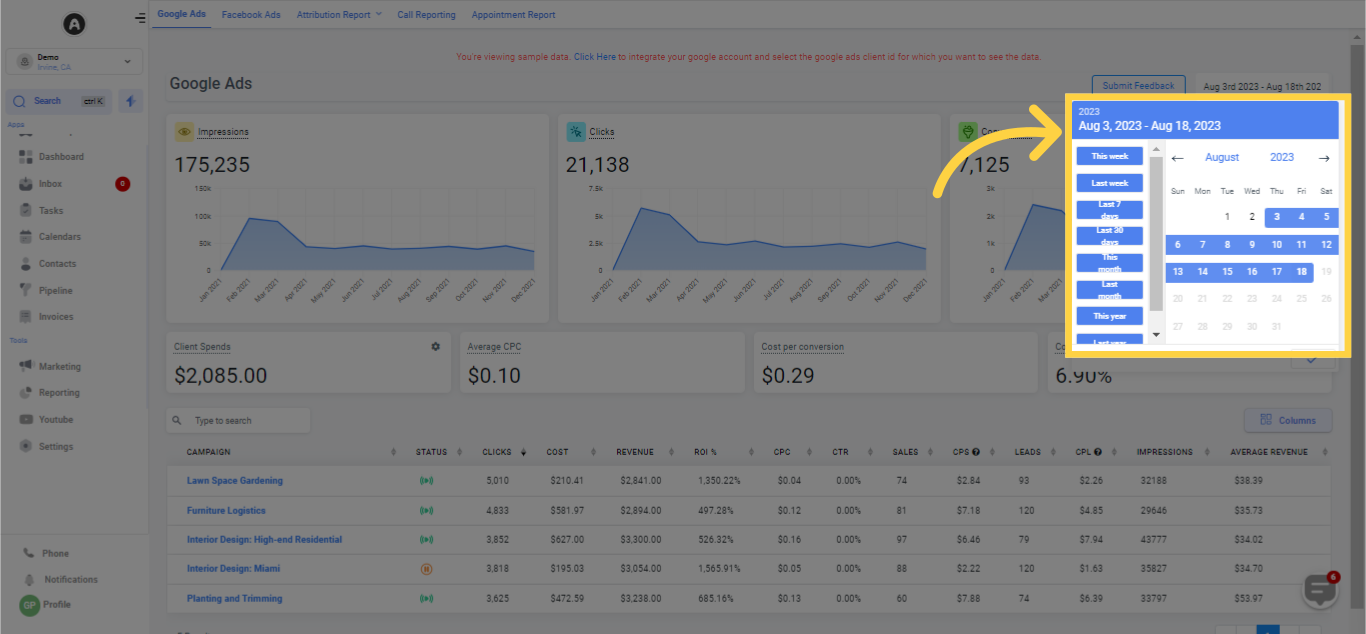
Moreover, you have the option to select a date range for displaying reports based on your chosen duration. Simply click on the calendar icon situated in the top right, choose the date range you wish to view and hit the green checkmark icon to refresh your data.
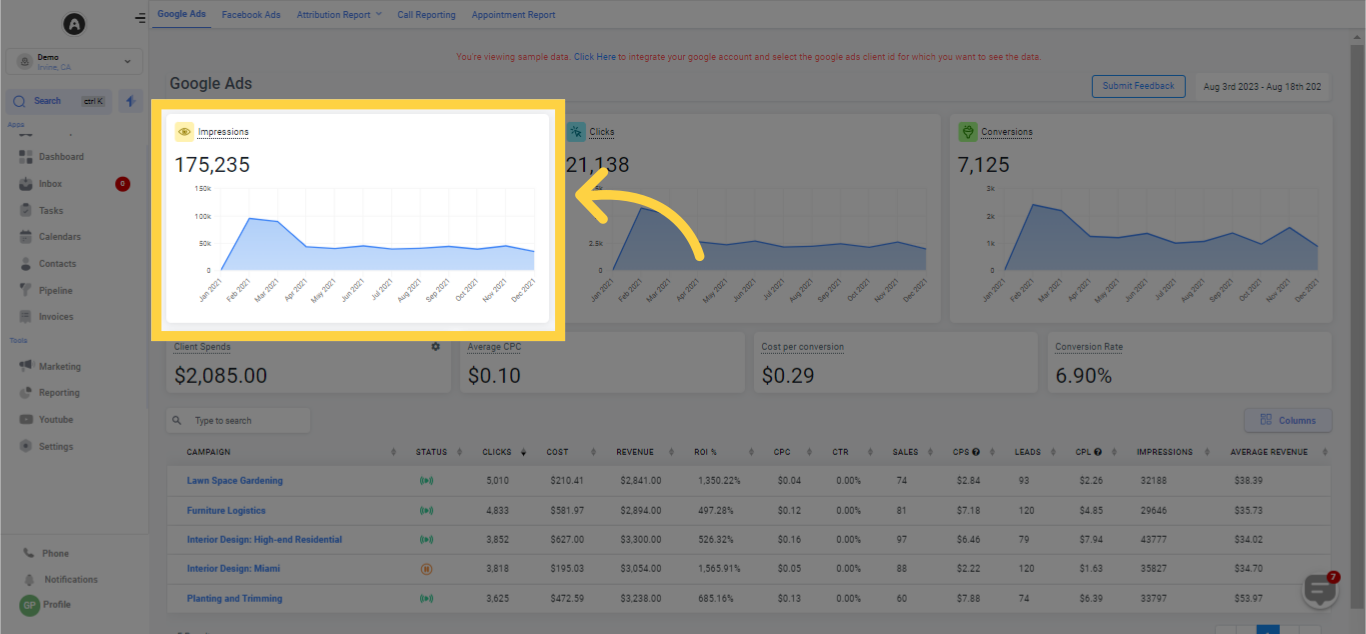
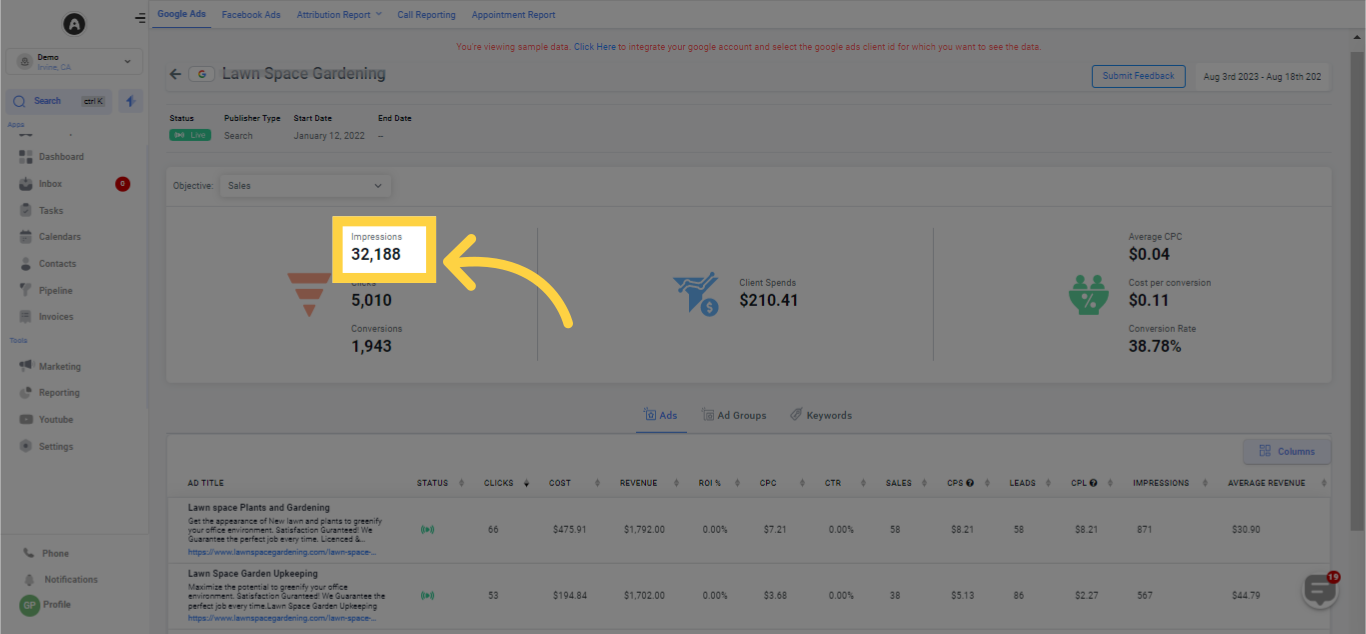
The Impressions section showcases the count of how often your ad has been displayed within the chosen date range. This segment features a graphical representation of the impressions your Google Ads have received by date, permitting a clear view of your impressions on a daily, weekly, or monthly basis.
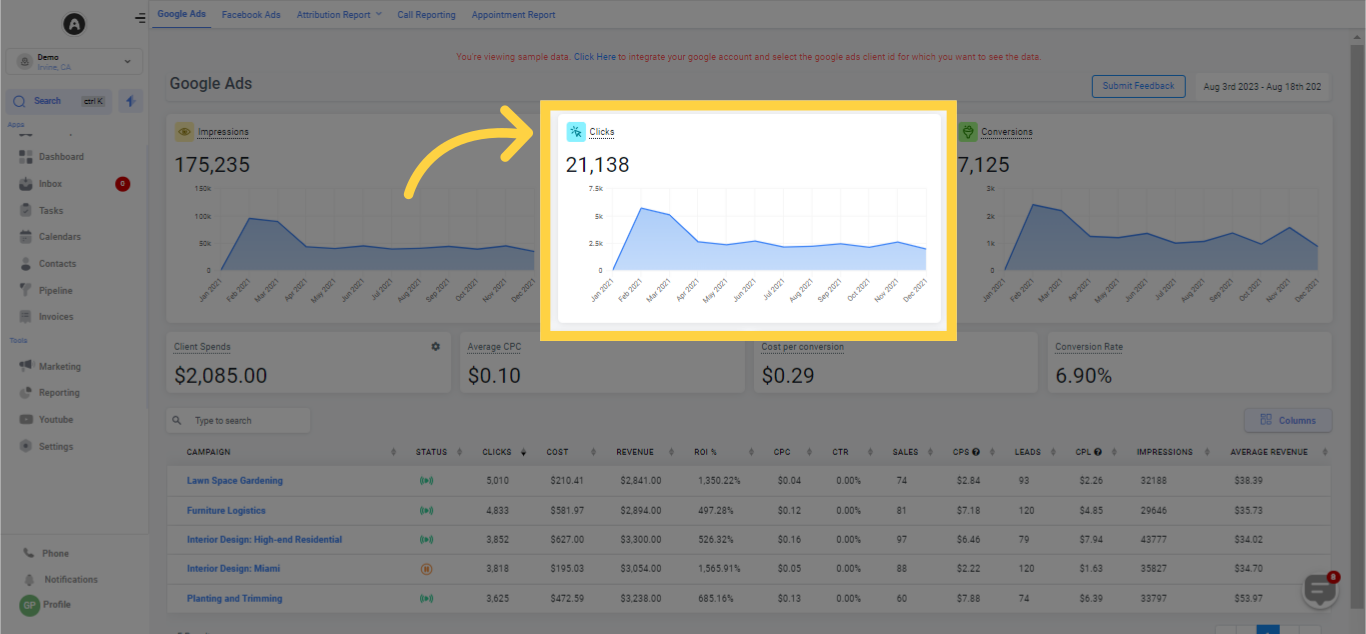
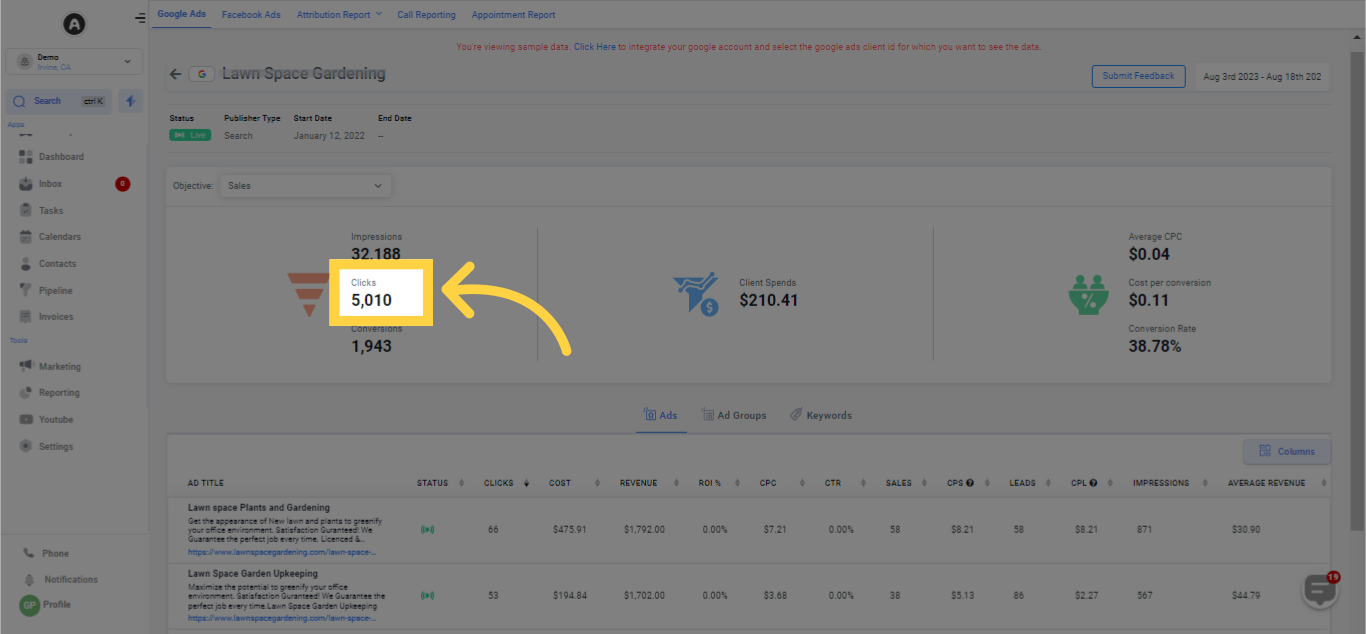
The Clicks section indicates the number of times users clicked on your ad after it appeared on their search results page. This part also exhibits a graphical rendering of your clicks per day, week, or month according to the date range you've chosen.
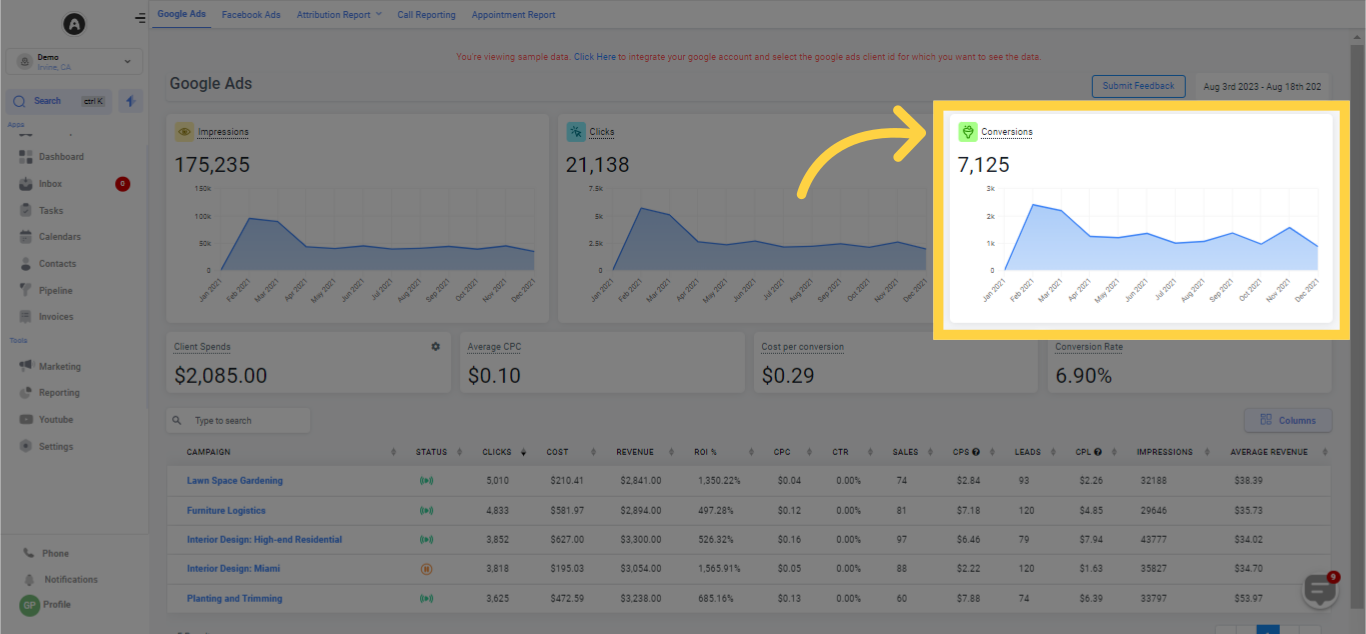
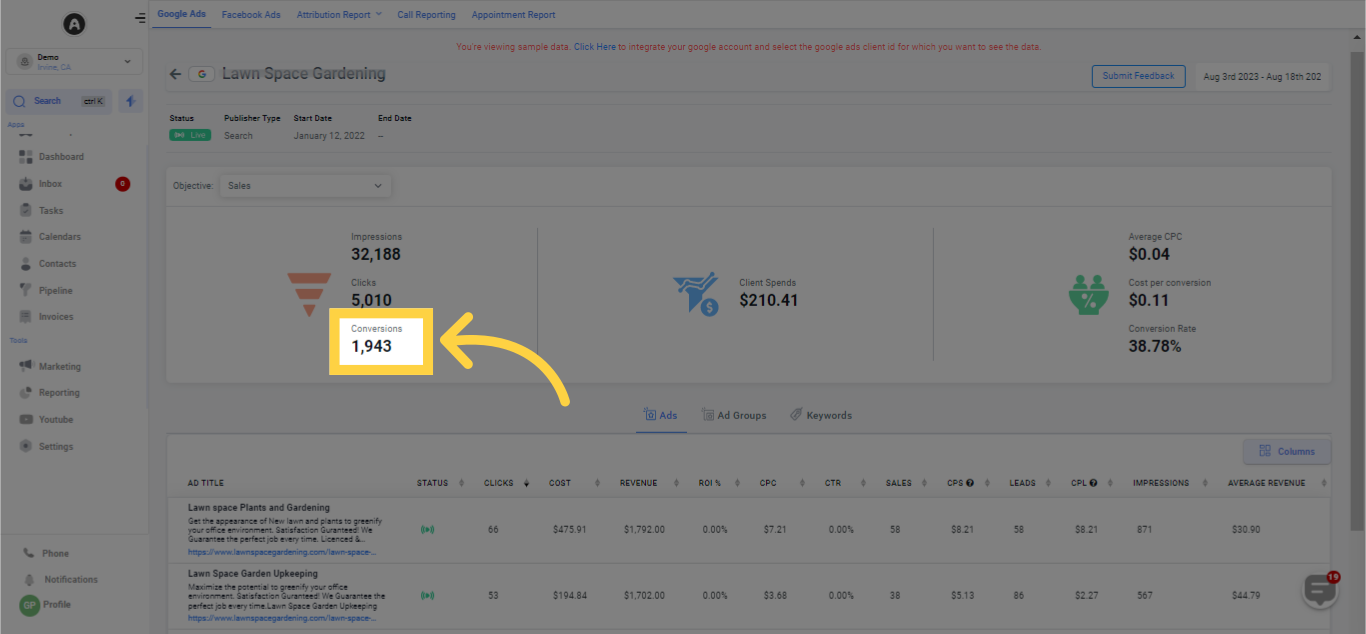
Within the Conversions section, you'll identify the count of users who enacted a particular action aligning with your ad's goal during the set time window. Observe a graphical depiction of your conversions per day, week, or year according to the selected date range.
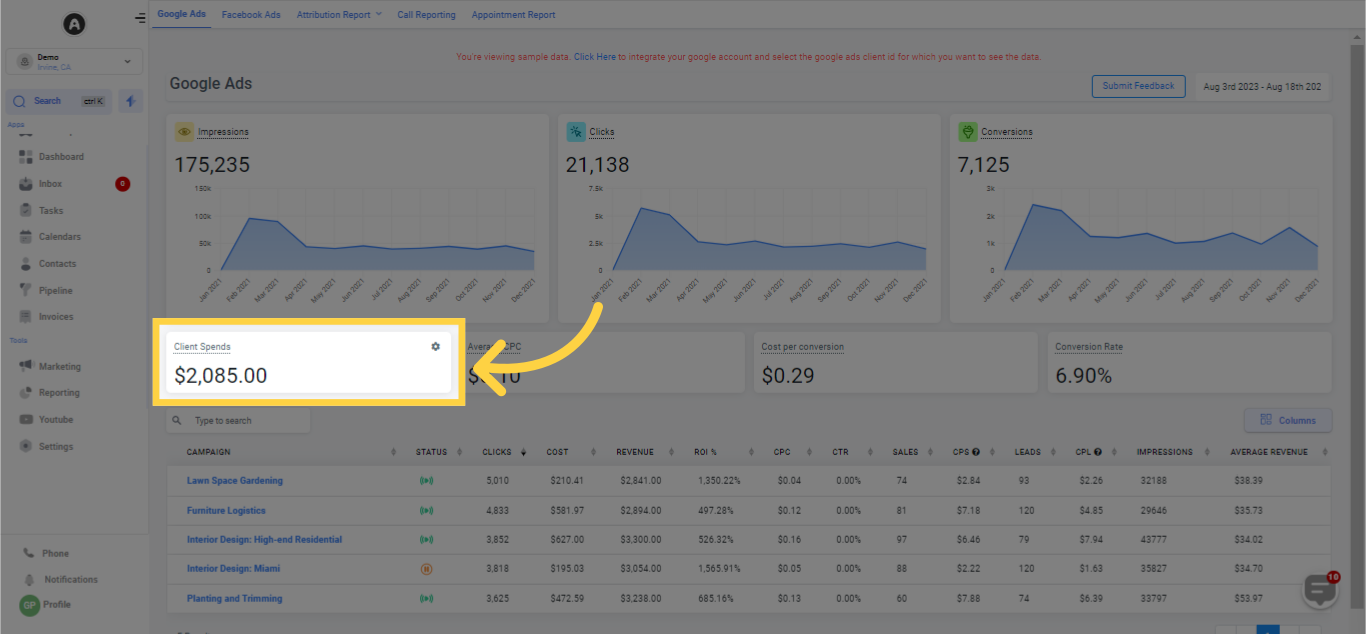
In this space, you will spot separate cards exhibiting your data at the campaign level, along with the percentage of increment or decrement over a defined duration.
This is contingent on your selected date range and is compared to the previously chosen date range.
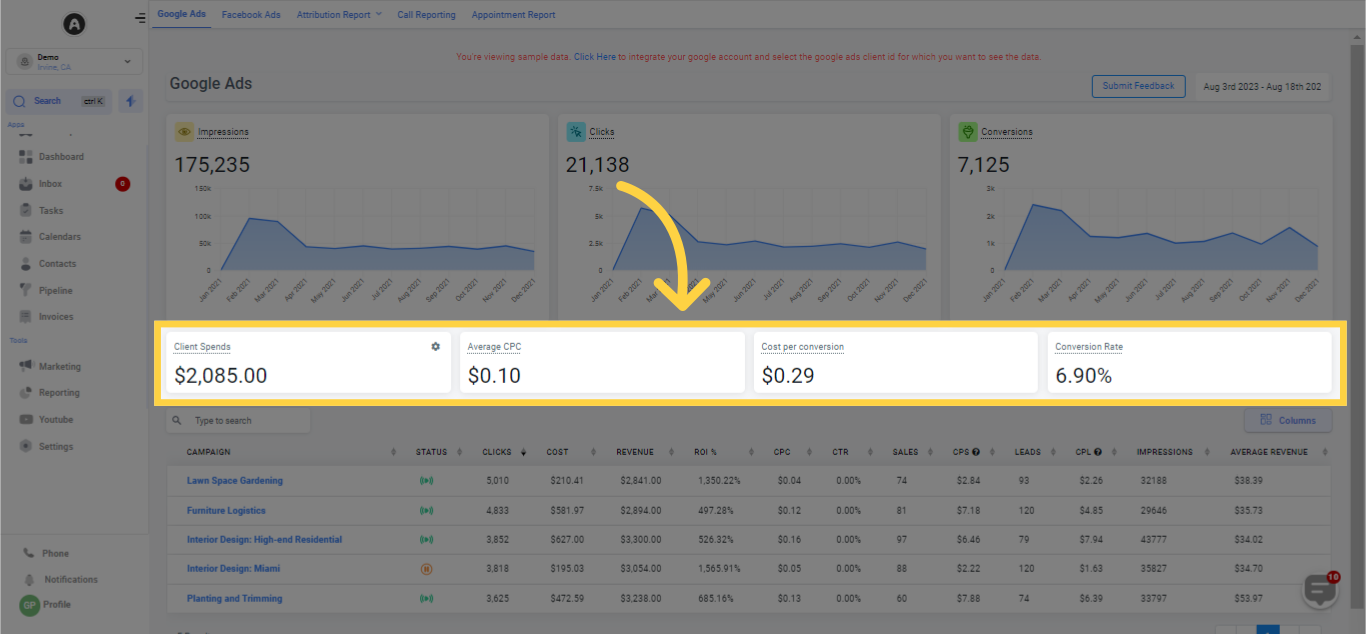
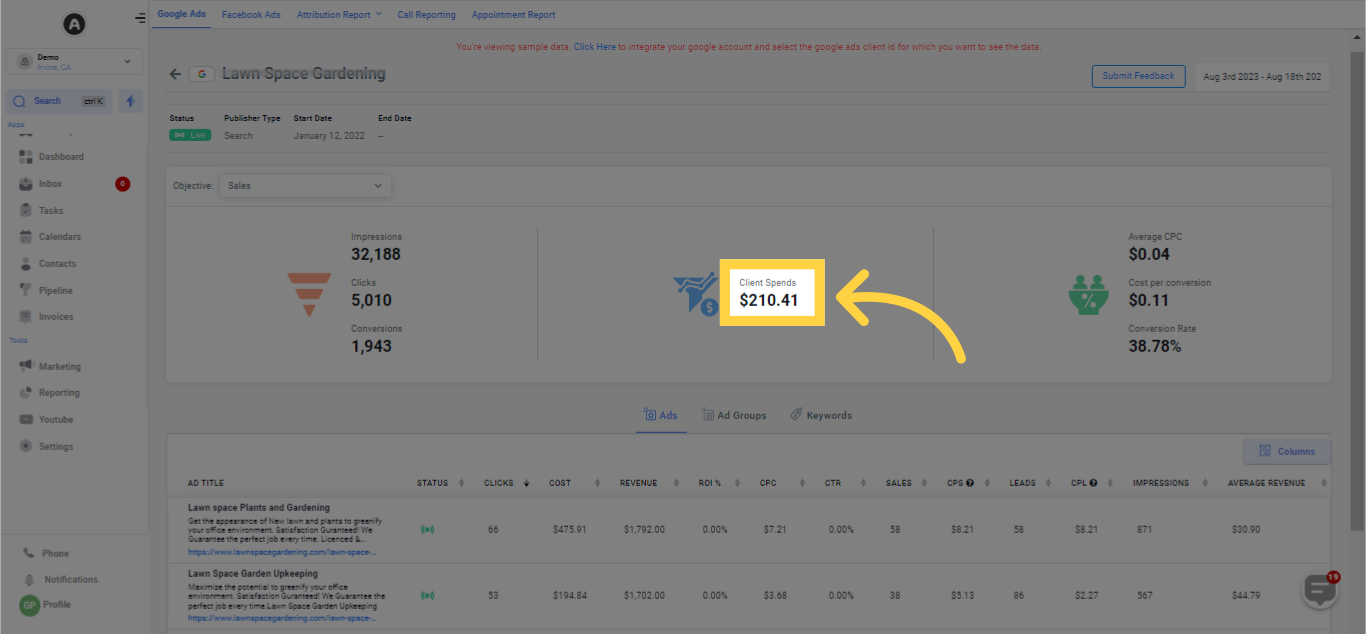
Displays the expenditure incurred on a particular advertisement.
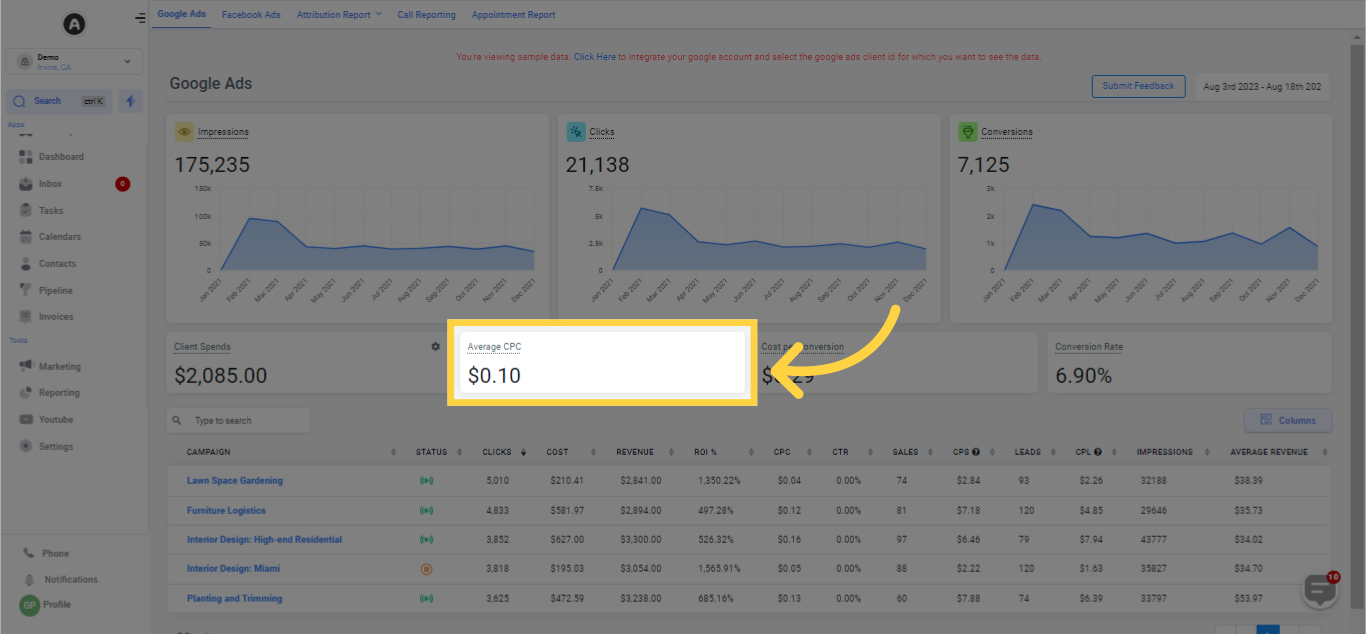
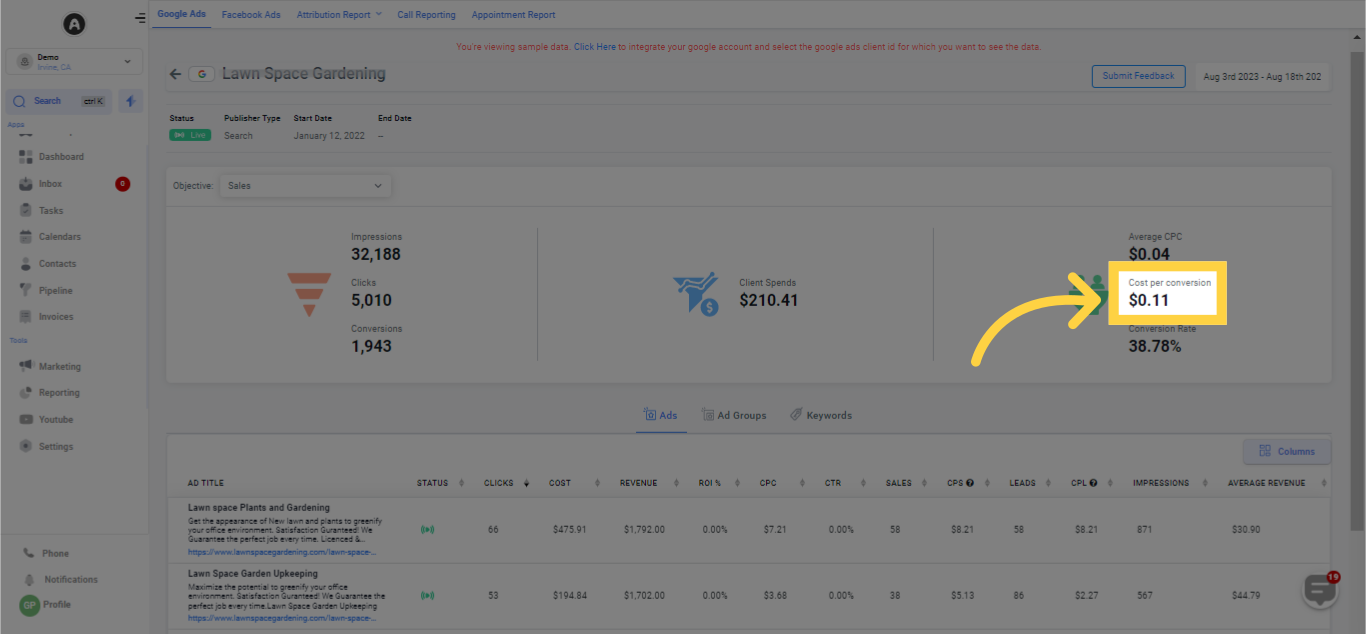
Indicates the average cost for each click.
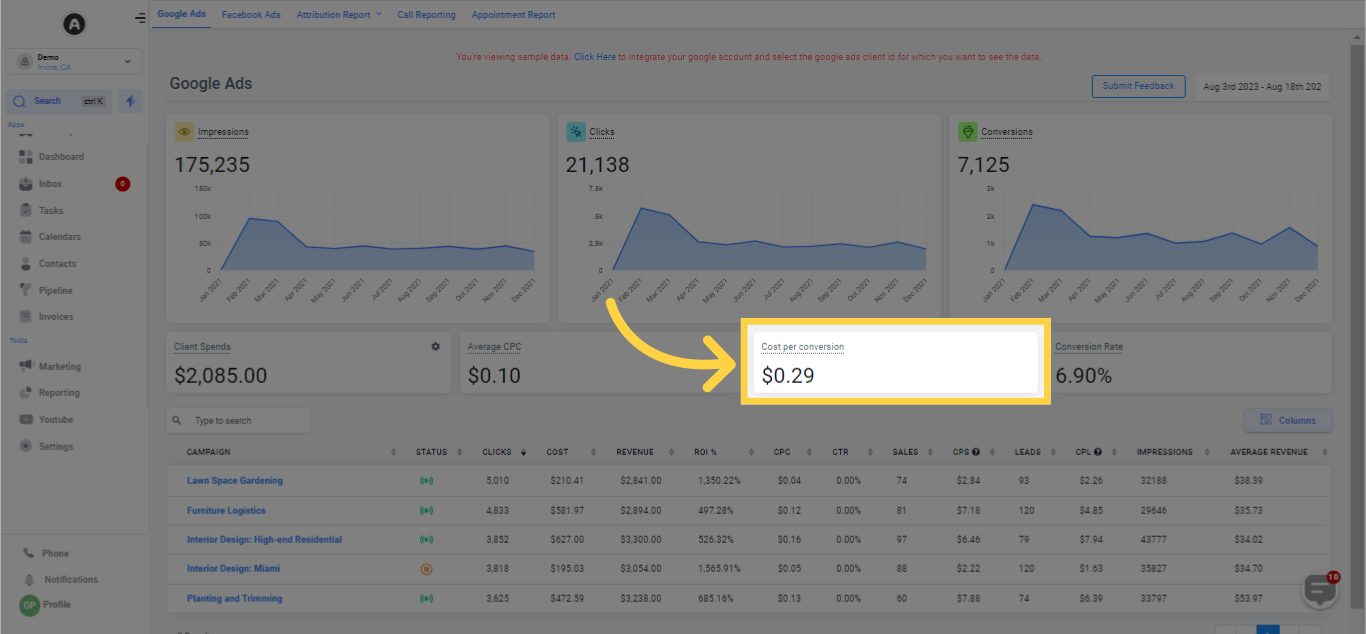
Displays the average cost for each conversion.
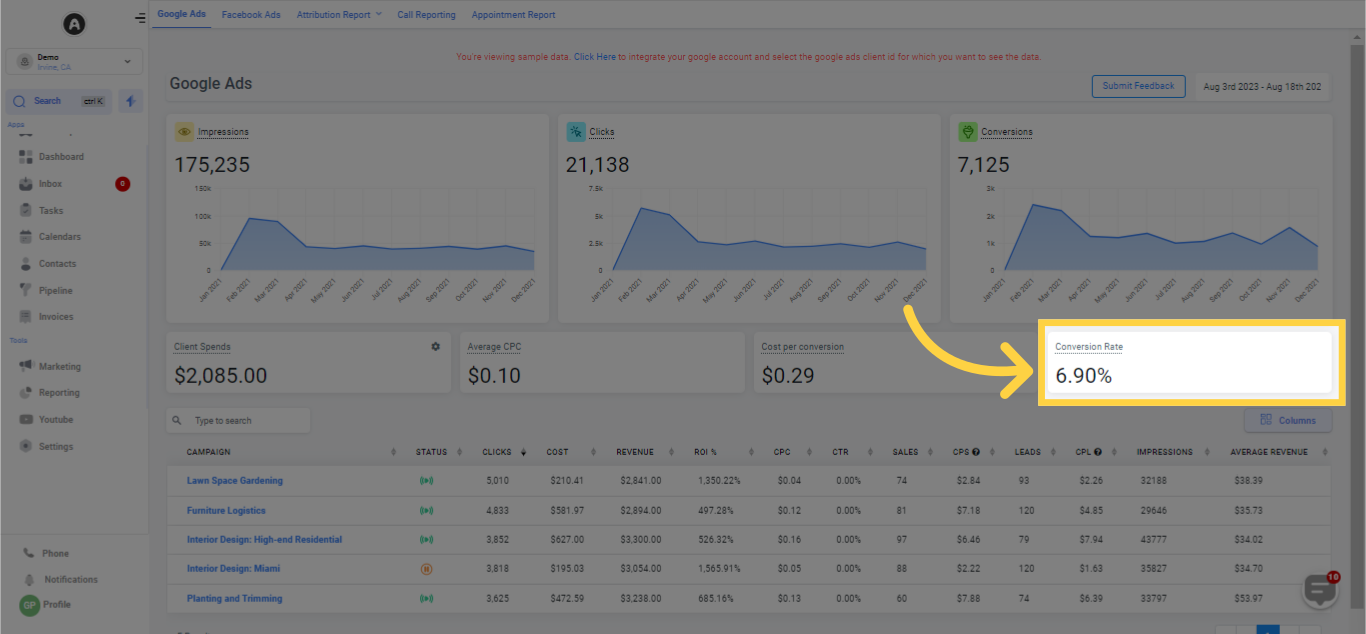
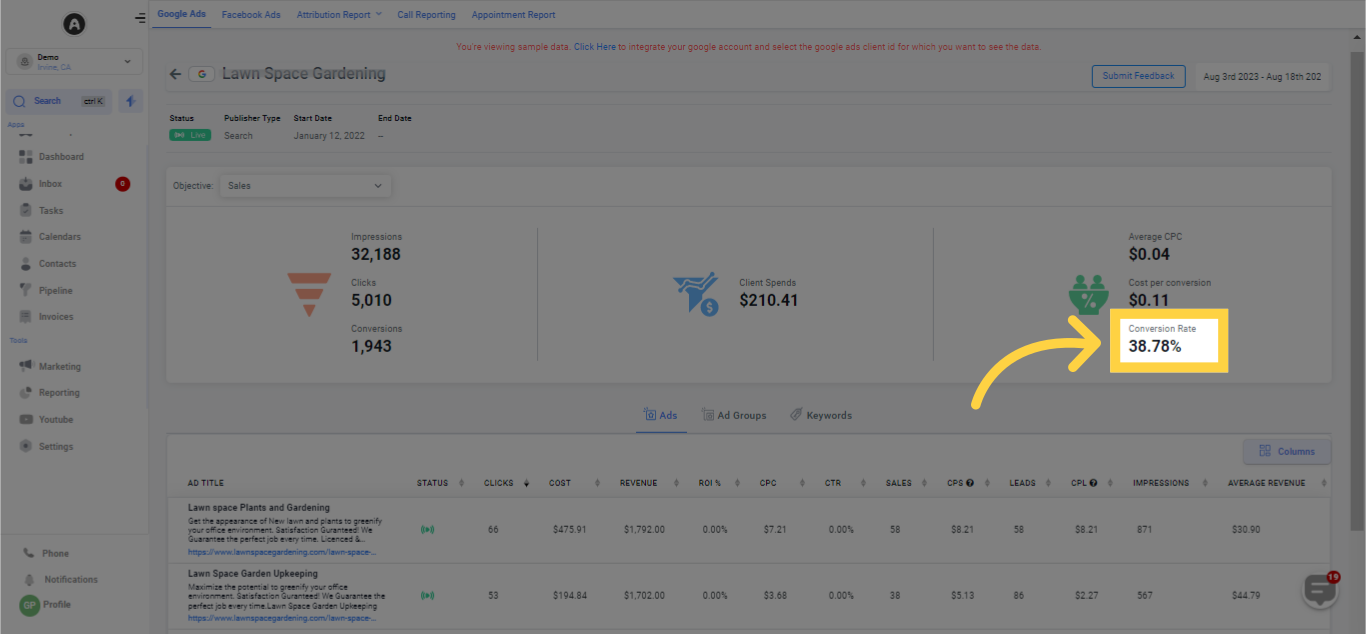
The Conversion Rate can be found here.
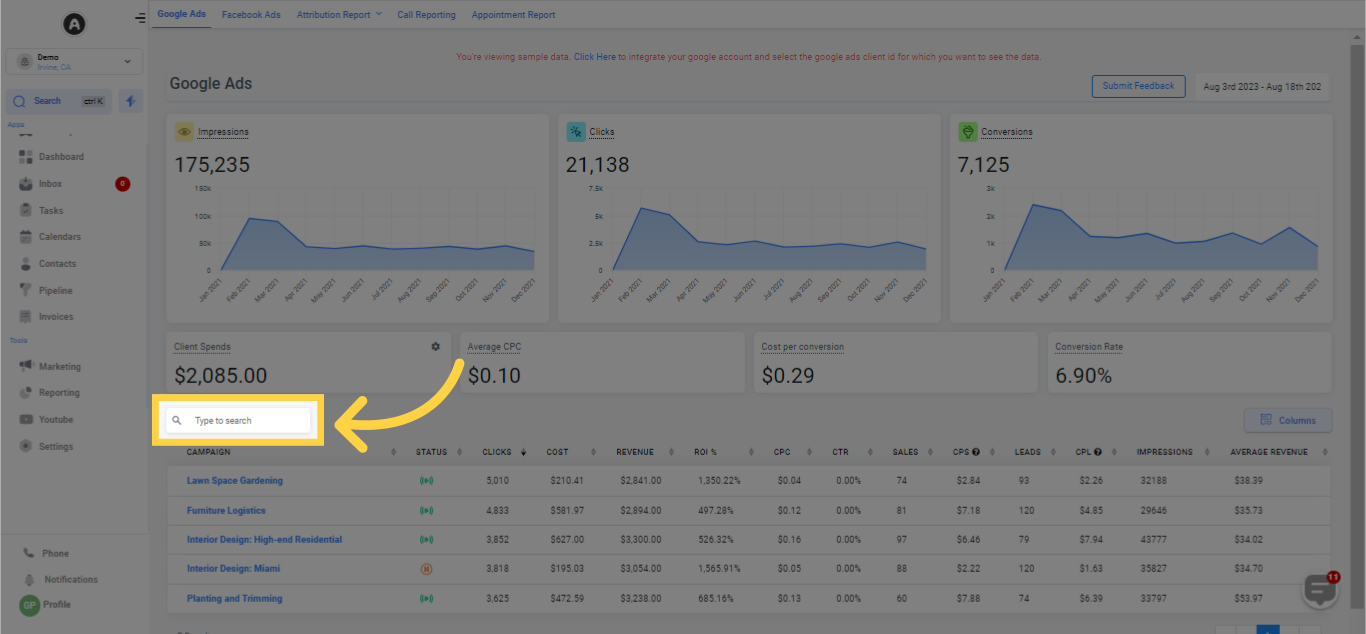
The Search Bar facilitates a swift retrieval of a specific ad campaign. Just enter the name of the campaign you wish to see, and the other campaigns will vanish from the campaign data card.
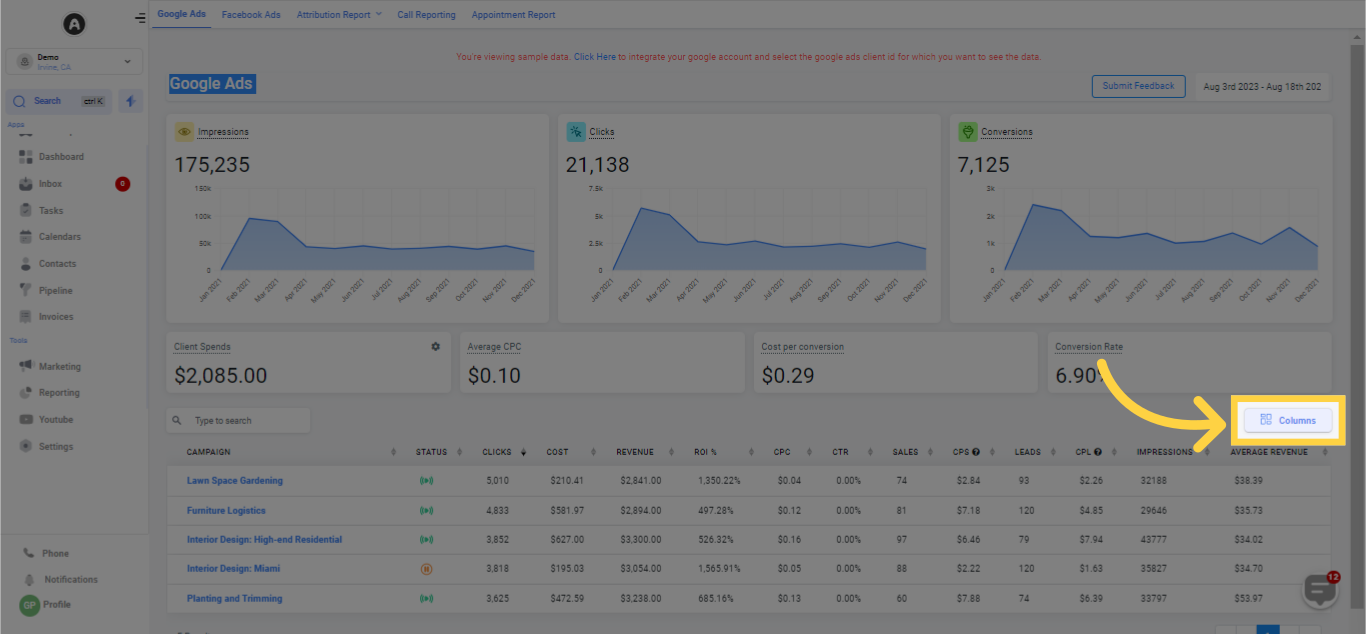
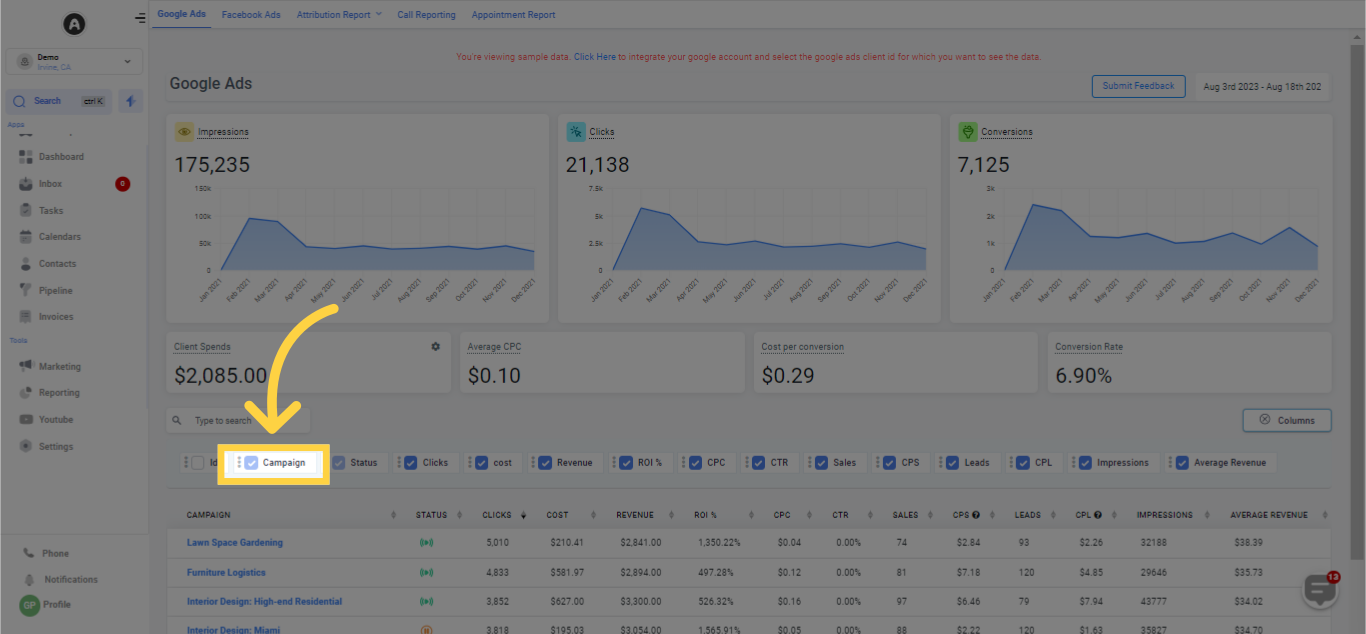
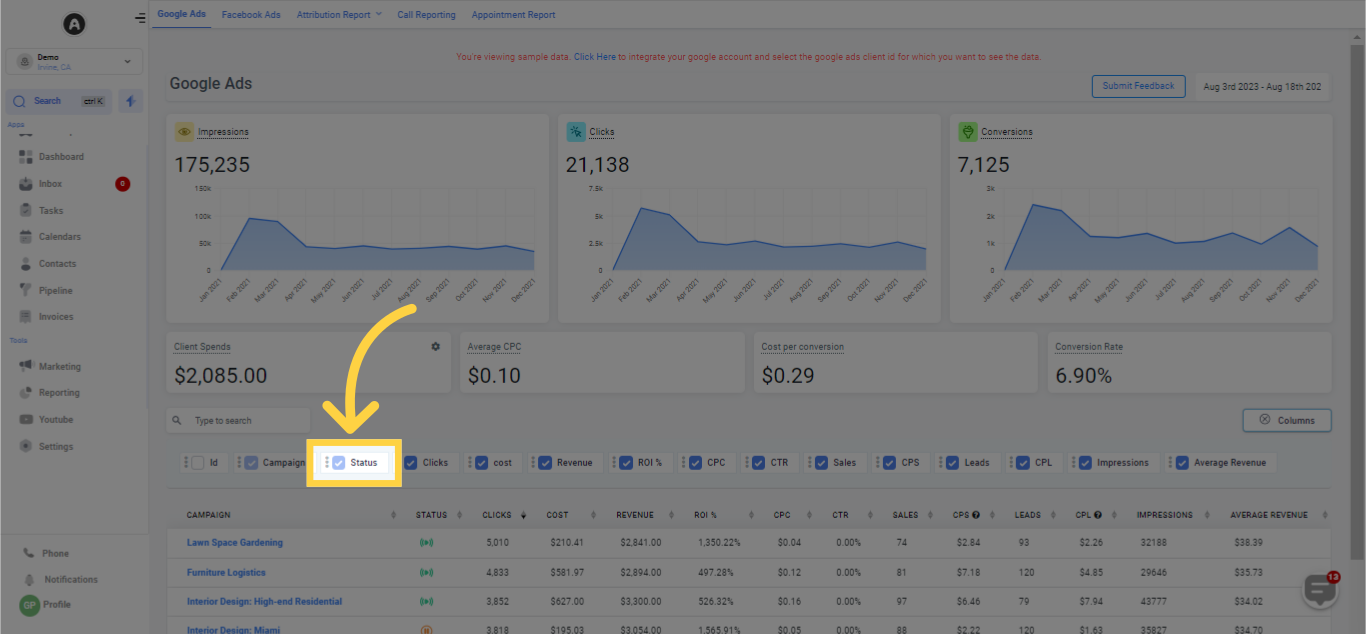
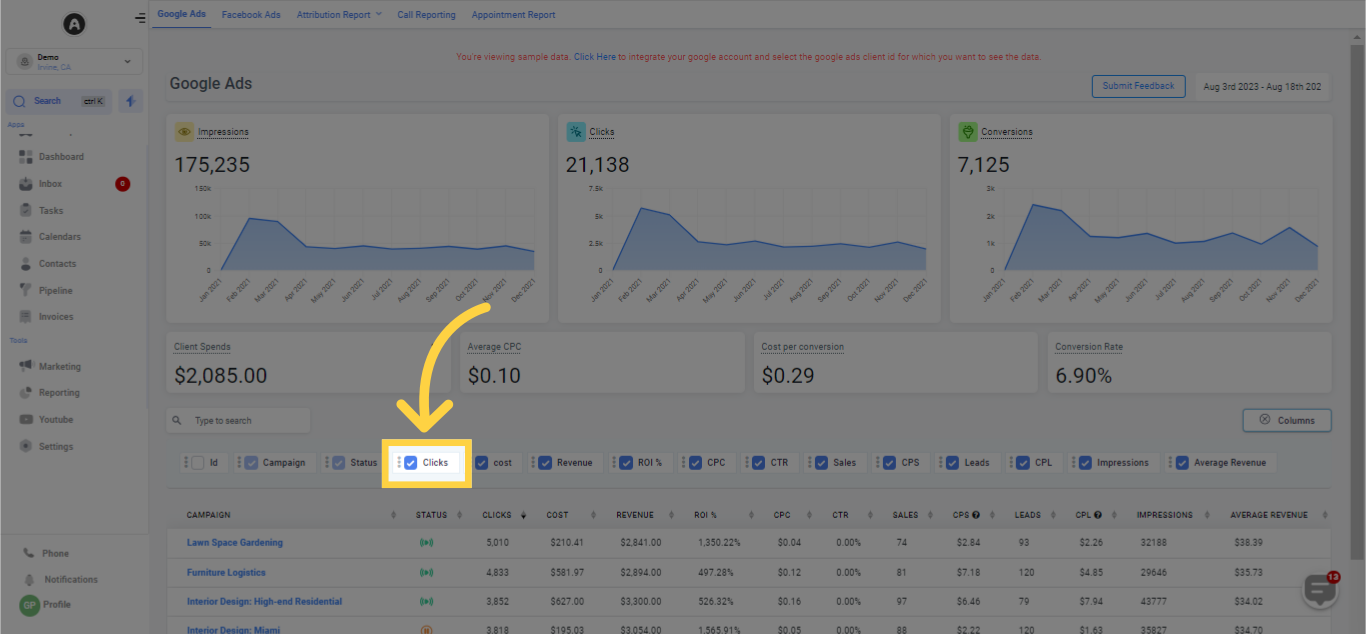
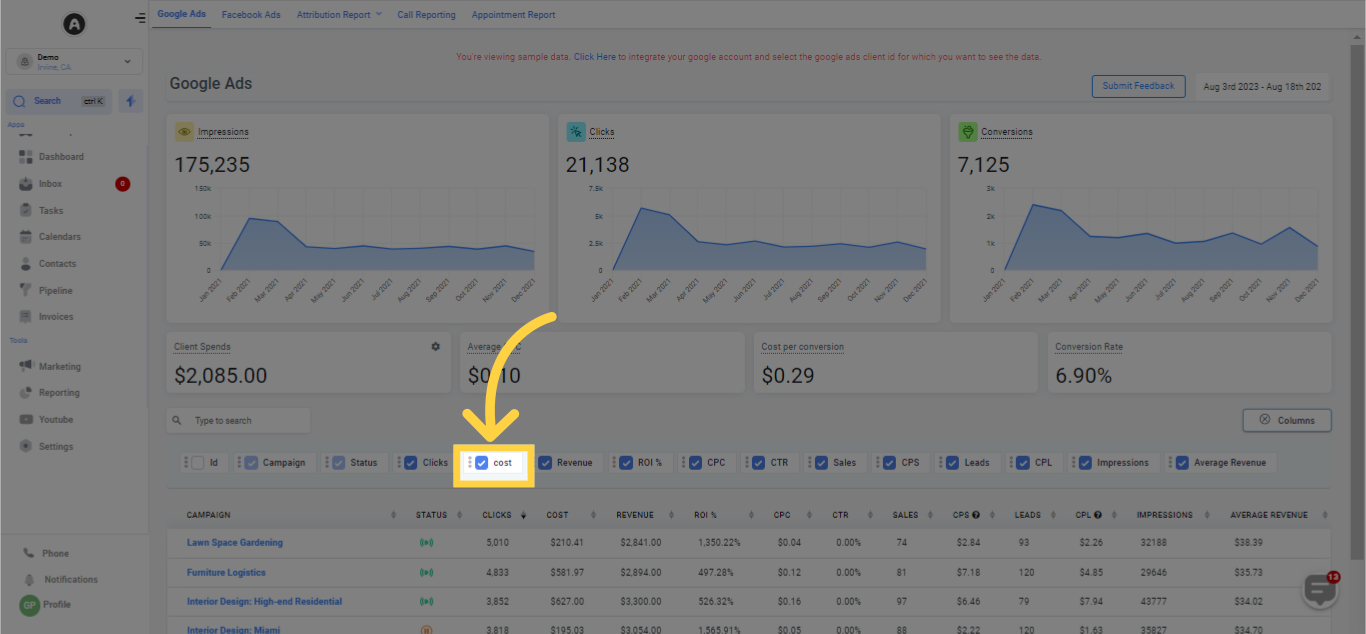
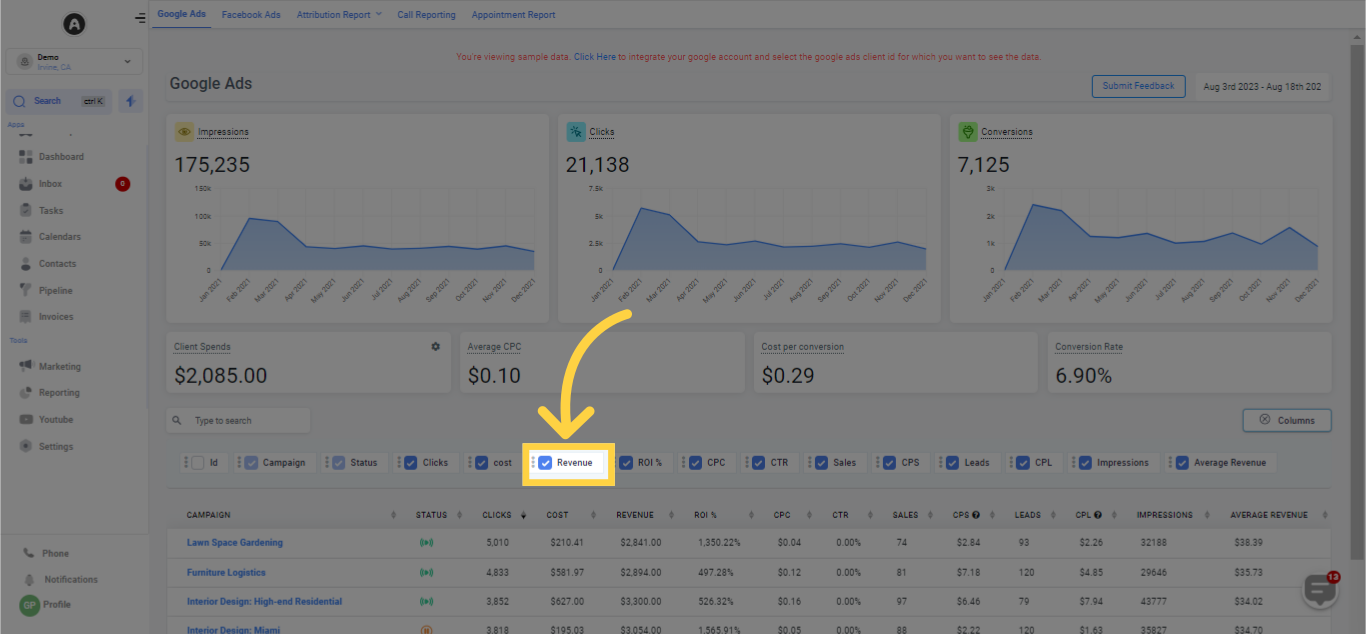
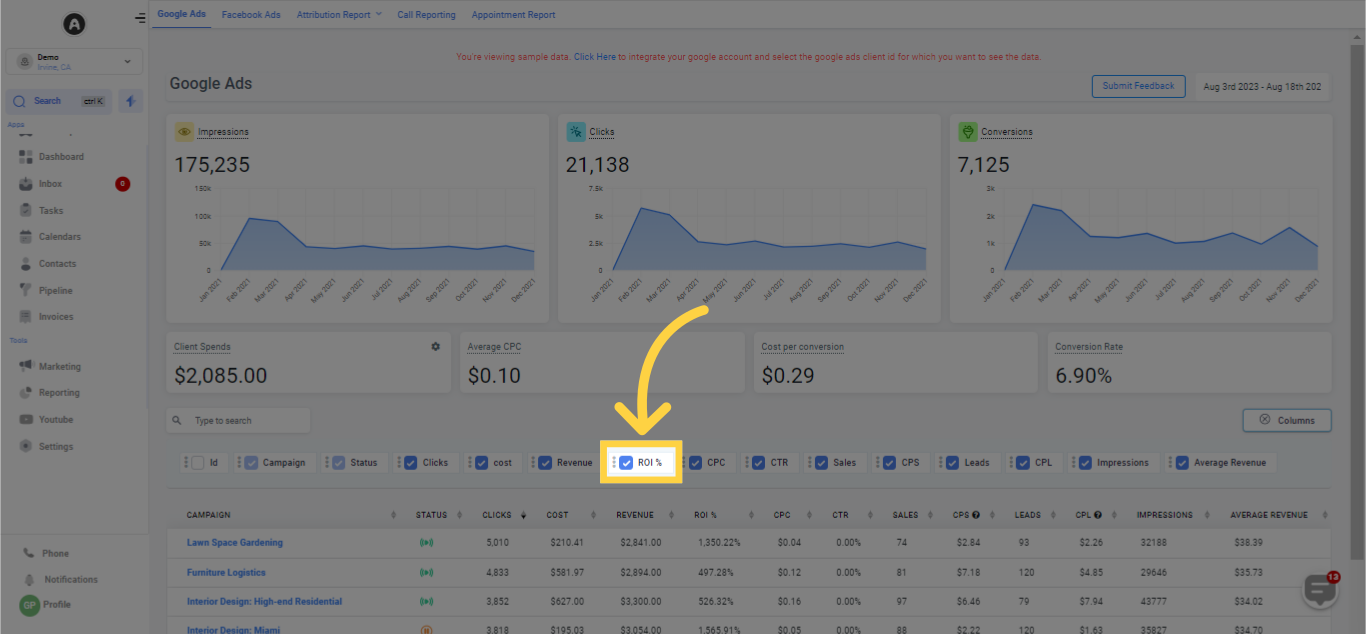
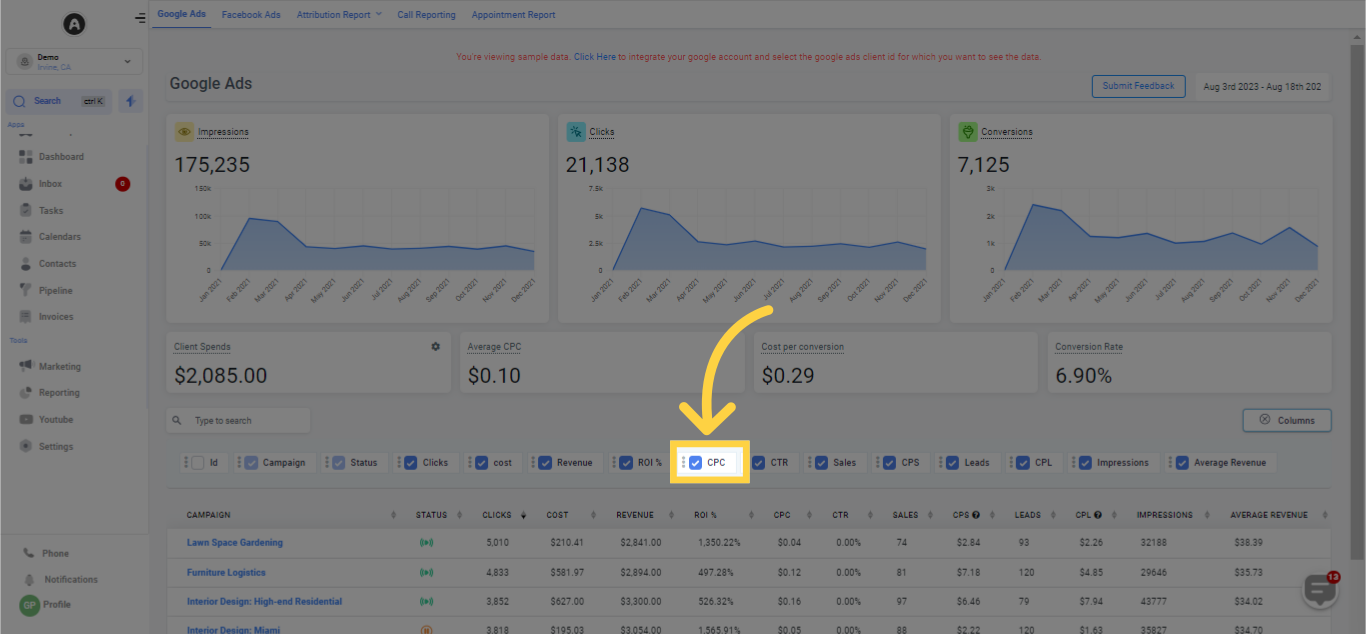
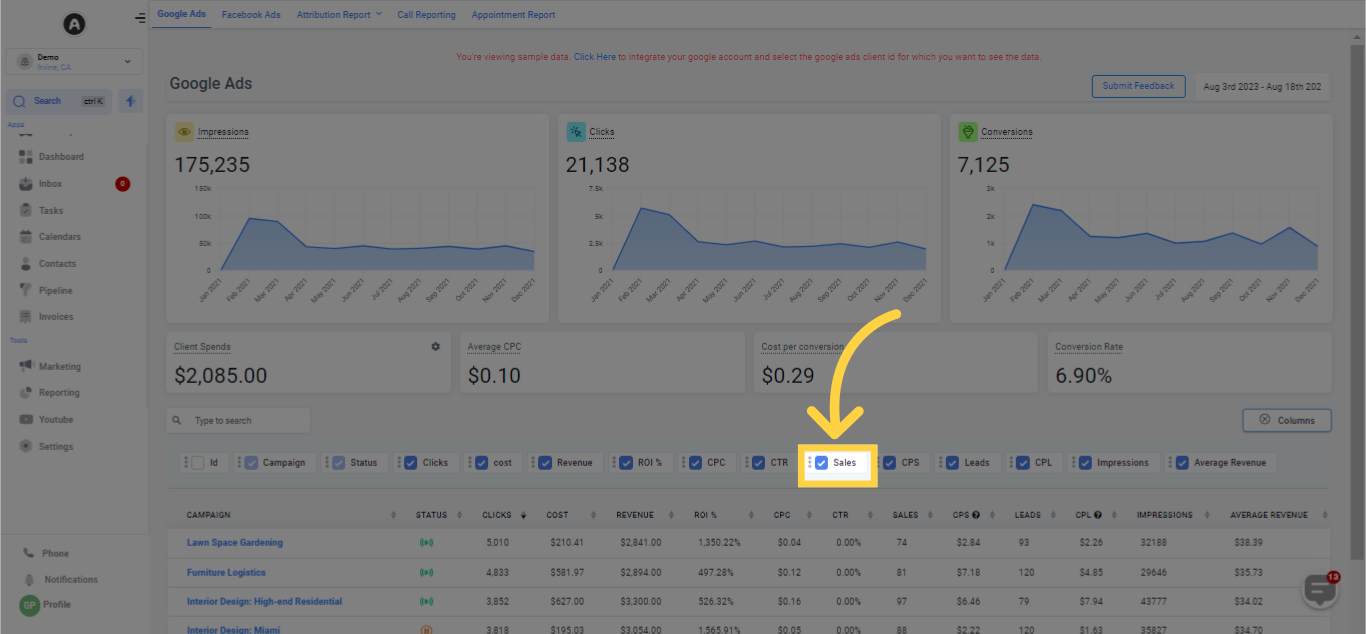
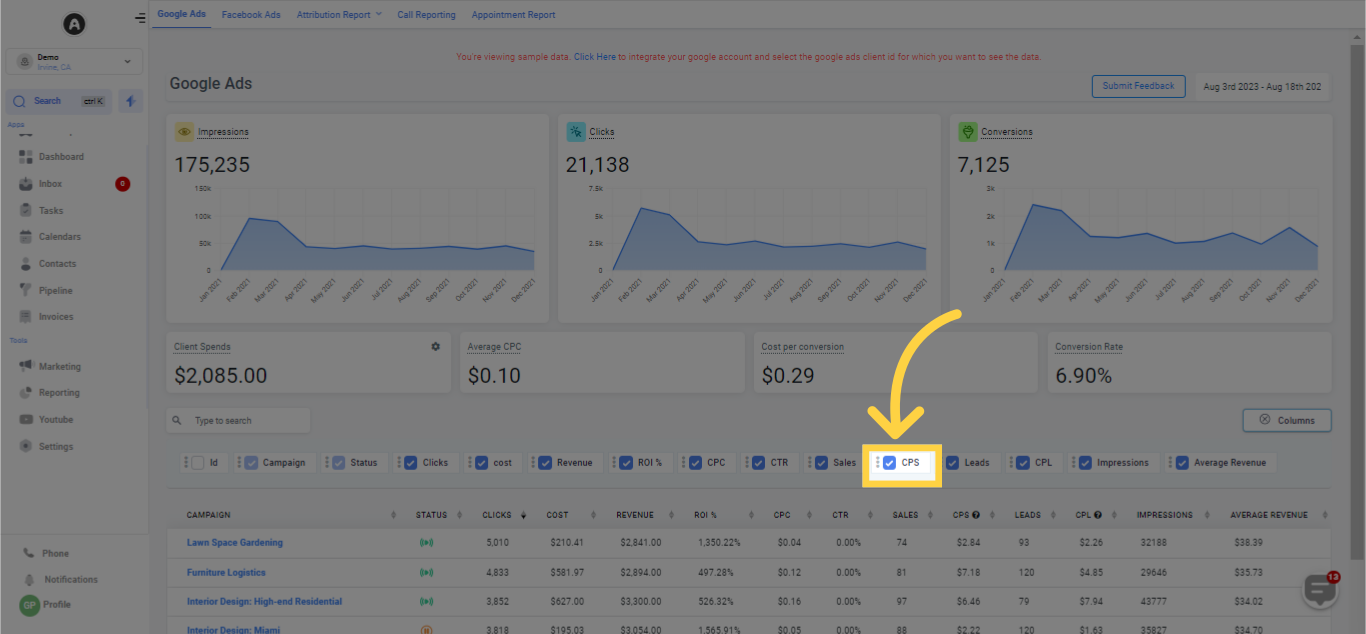
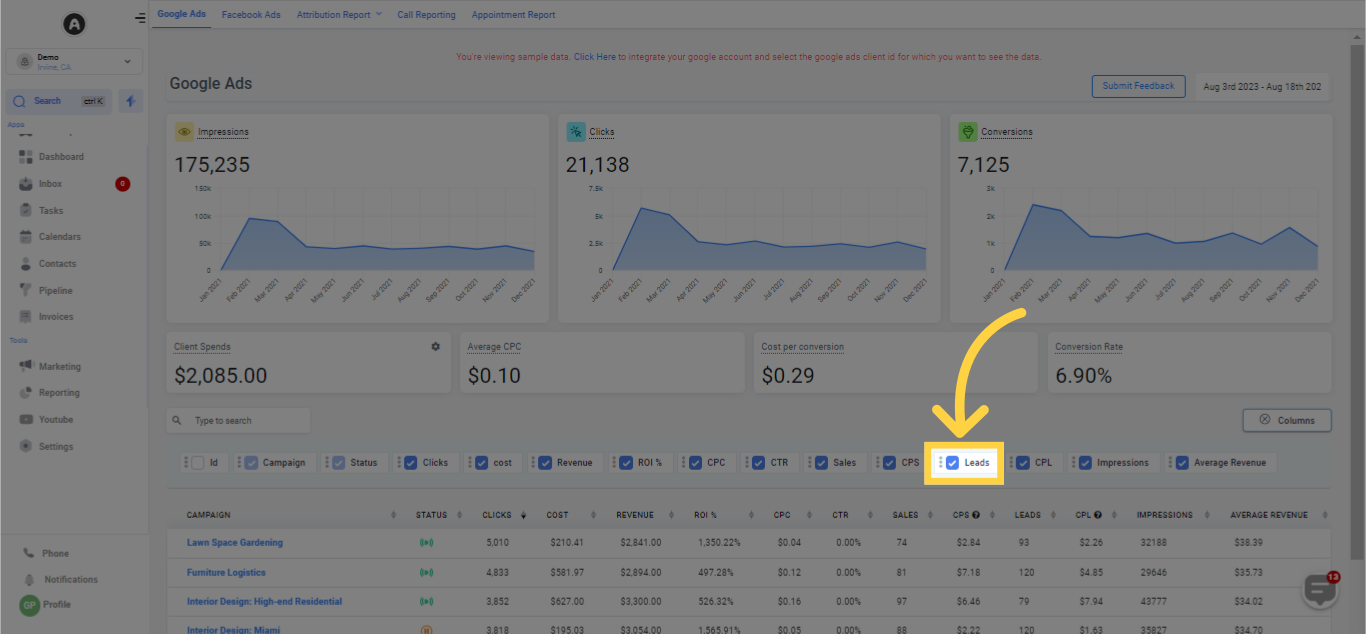
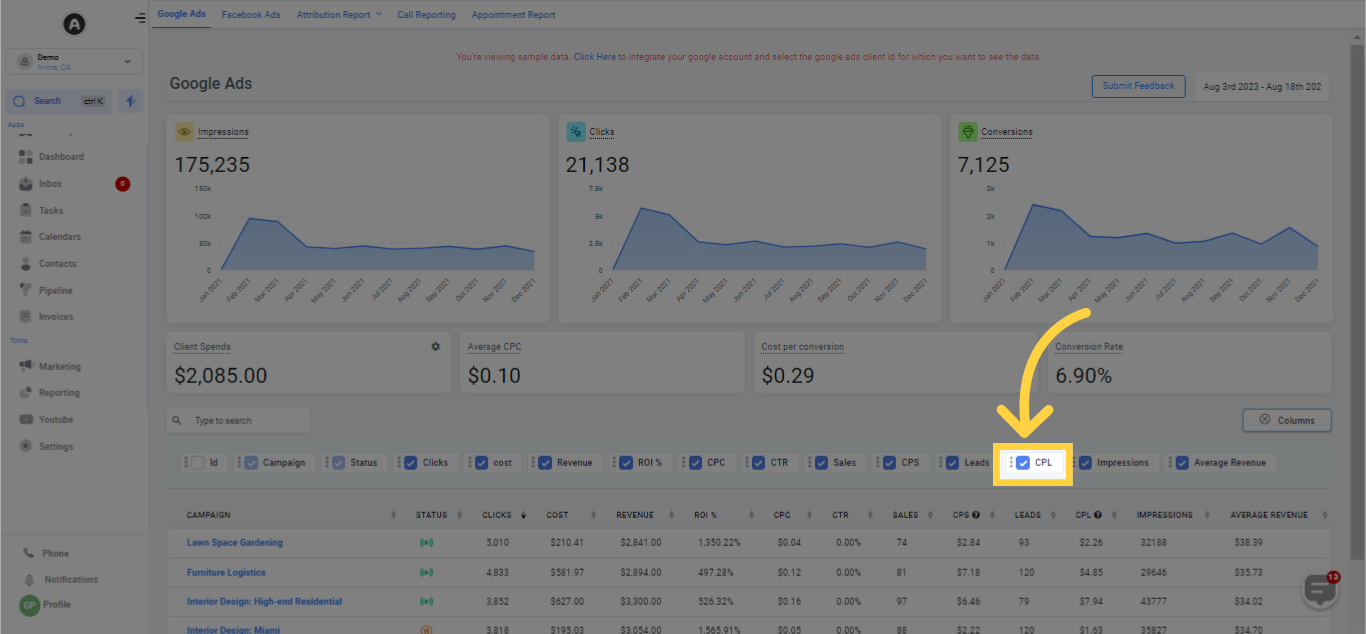
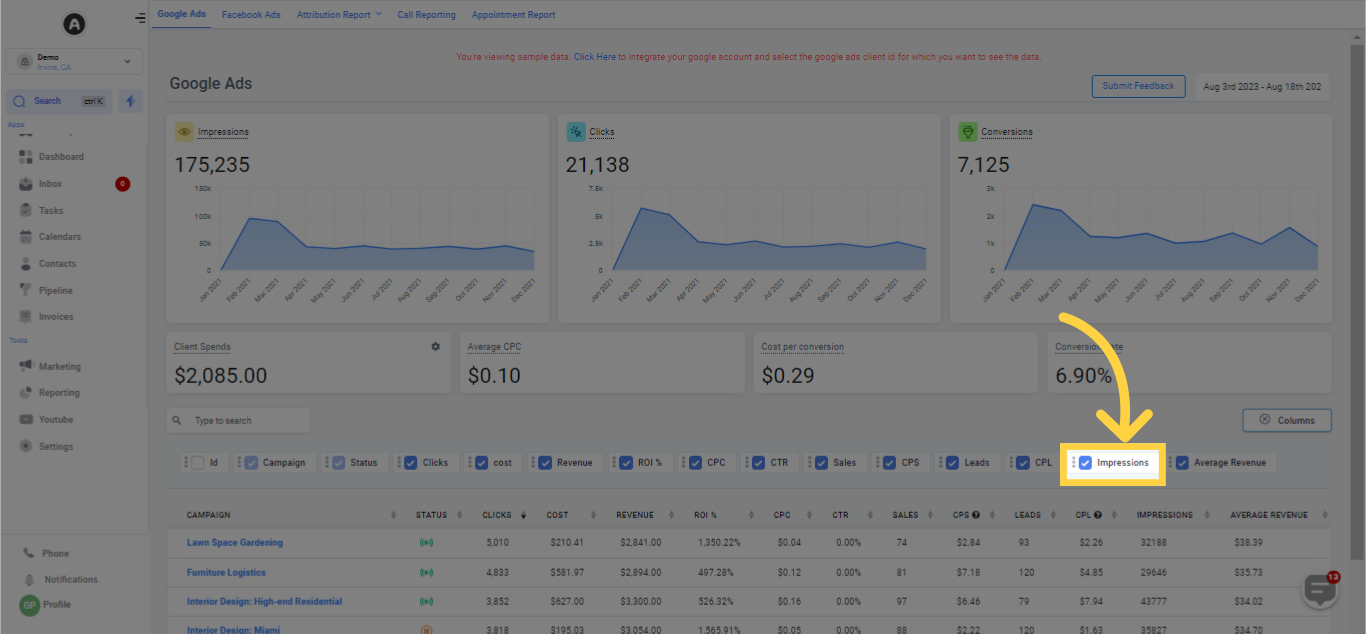
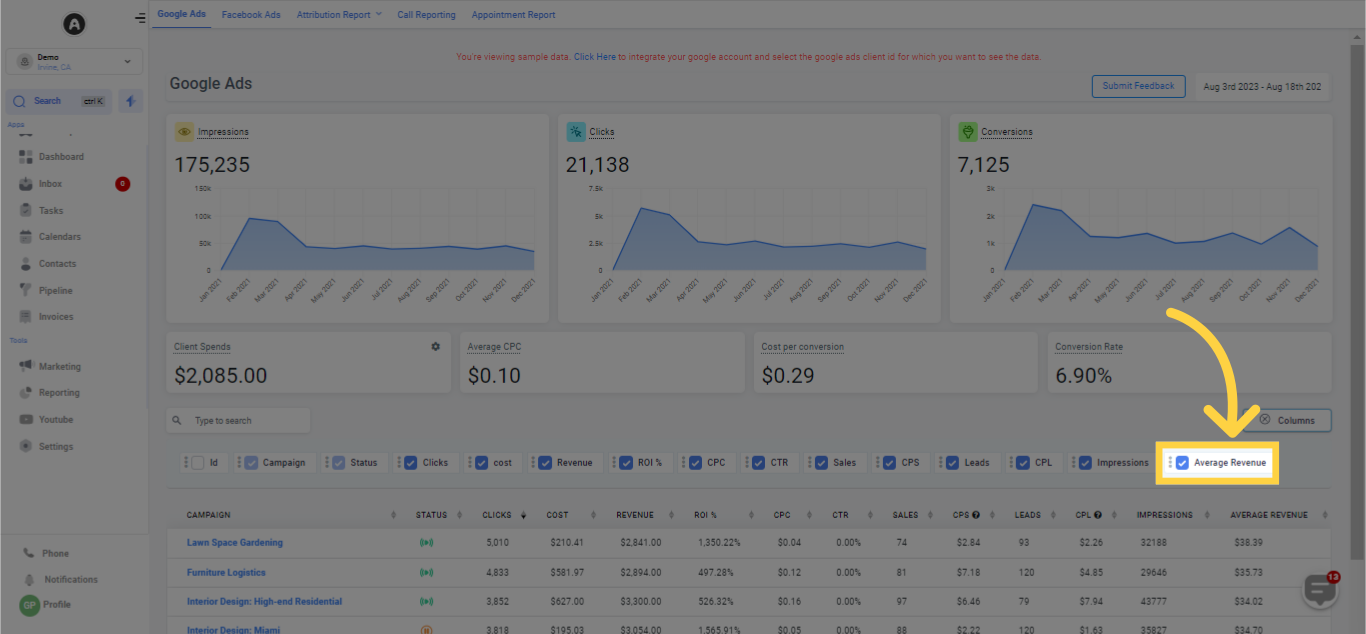
Within the Columns section, you have the flexibility to select the precise data you want to be shown by toggling the checkboxes. After making your choices, click on the column tab once more to preserve your adjustments.
This table presents valuable data points that enable you to evaluate your ad campaign's performance. In the forthcoming page, we'll thoroughly discuss each stat linked to the individual campaign.
Displays the title of each Google Ads campaign you've developed.
Indicates the status of the individual campaign, specifying whether it is operational or in draft mode.
Displays the count of clicks for every campaign on the list.
Displays the expense for every campaign on the list.
Indicates the revenue produced from every campaign on the list.
Displays the Return on Investment (ROI) for each campaign. This statistic is presented in percentage form.
Indicates the cost per click for each campaign.
Displays the sales derived from each campaign.
Indicates the cost per sale for each campaign.
Displays the count of leads produced from each campaign.
Indicates the Cost per Lead for each campaign.
Displays the number of impressions garnered for each campaign.
Indicates the average revenue yielded from each campaign.
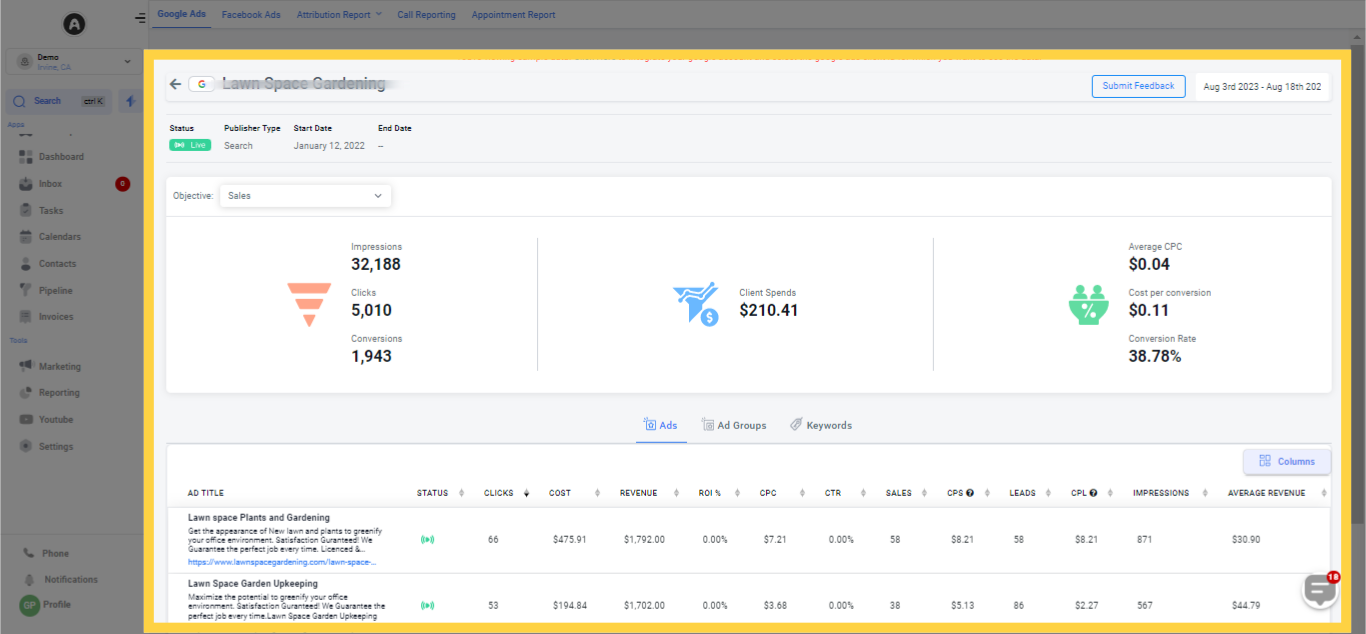
By clicking on any campaign displayed in the reporting section, you'll open this tab where the statistics for the individual campaign you've selected from the list will be visible.
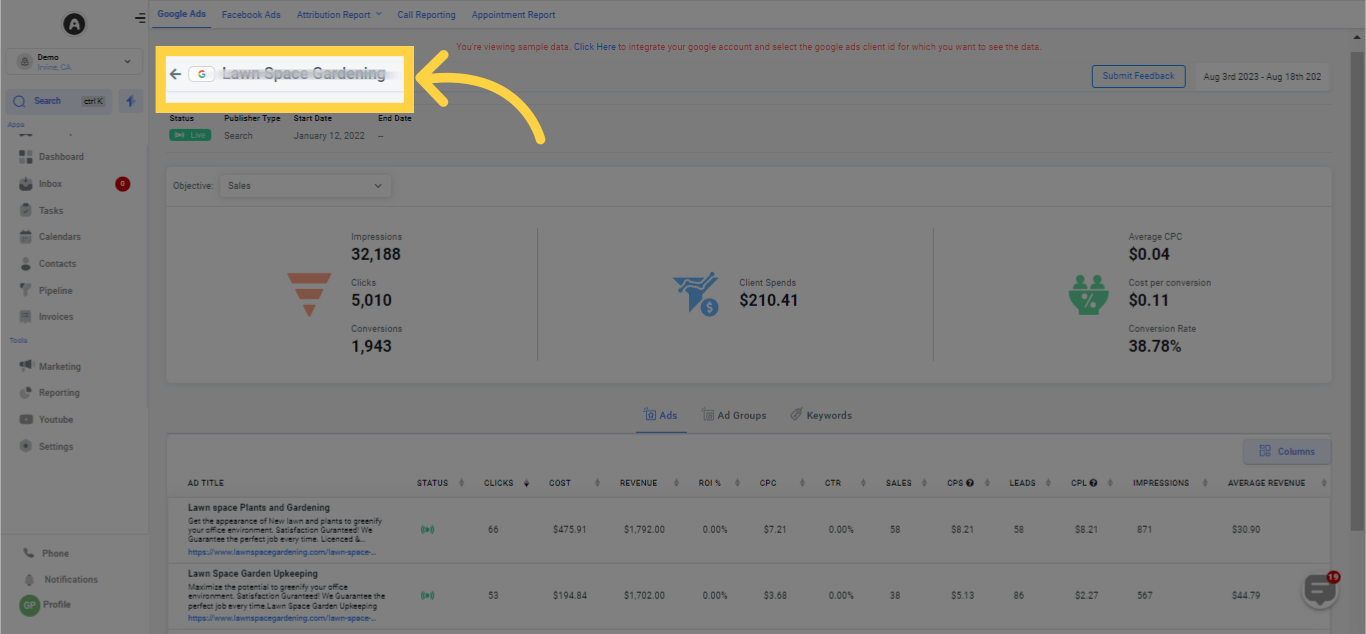
The designation of the picked ad campaign is displayed here.
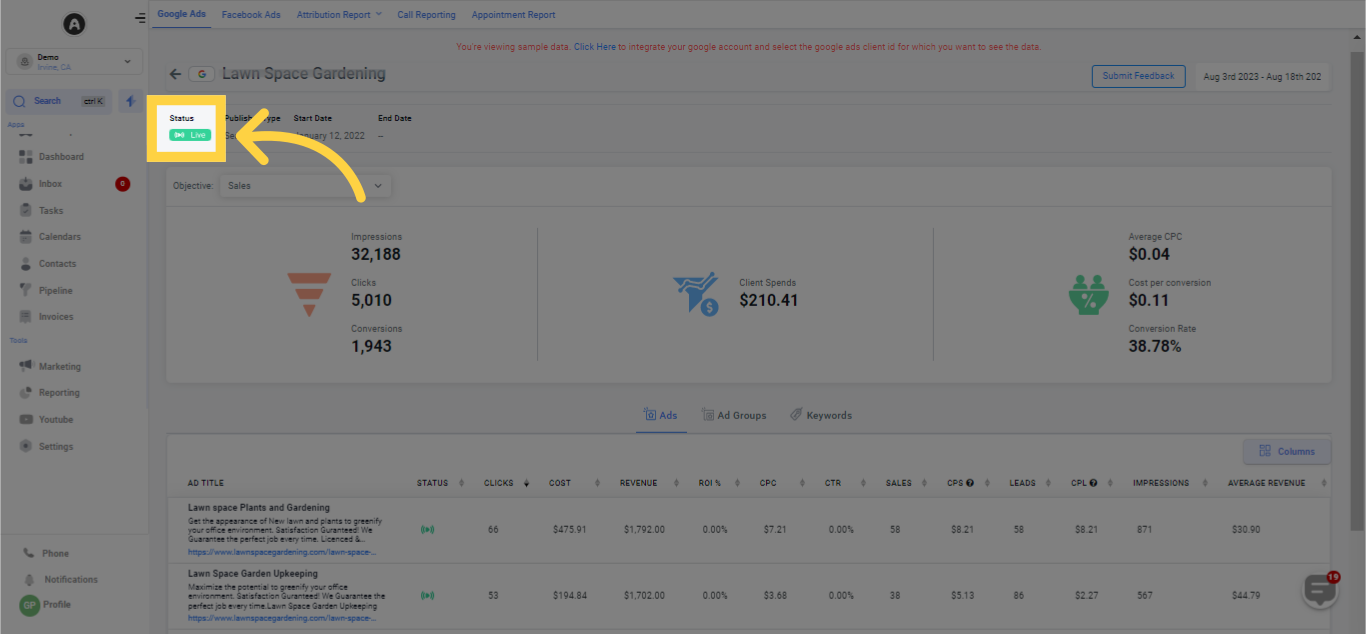
In this section, you'll ascertain whether the selected ad campaign is currently live or paused.
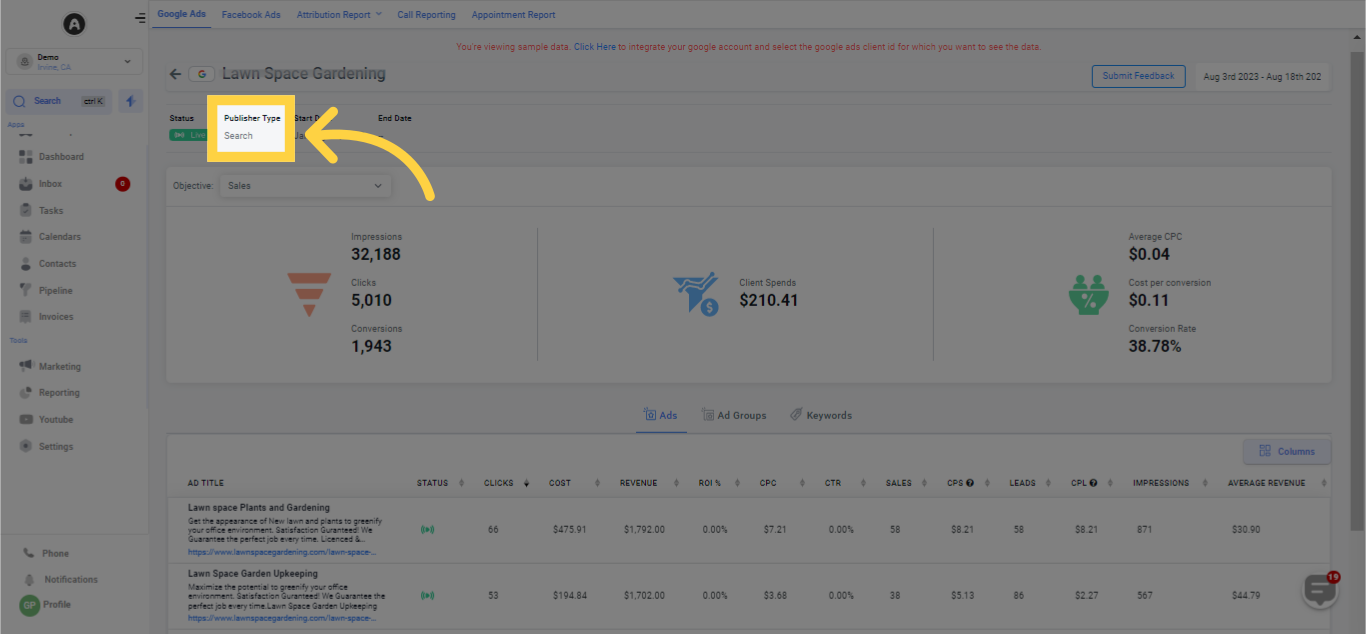
This section will reveal the type of Google Ad you're operating, be it Search Ads, Display Ads or Video Ads.
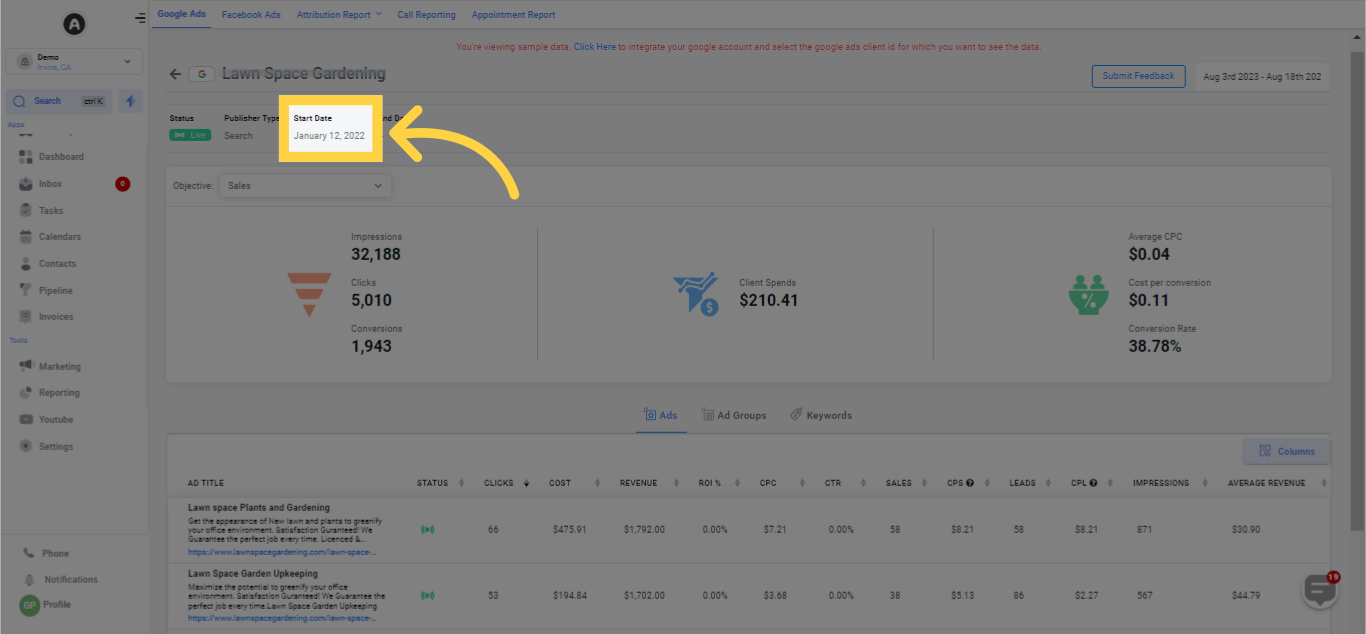
Displays the kick-off date of the individual ad campaign.
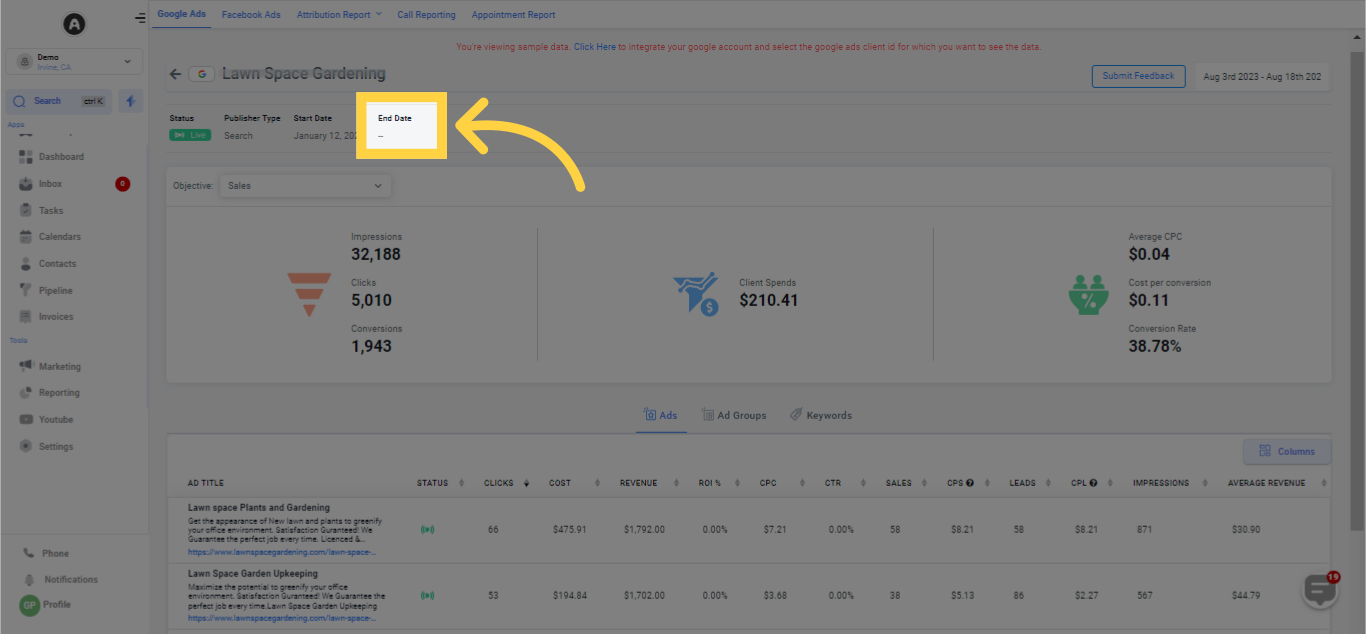
Indicates the date on which the individual ad campaign concluded.
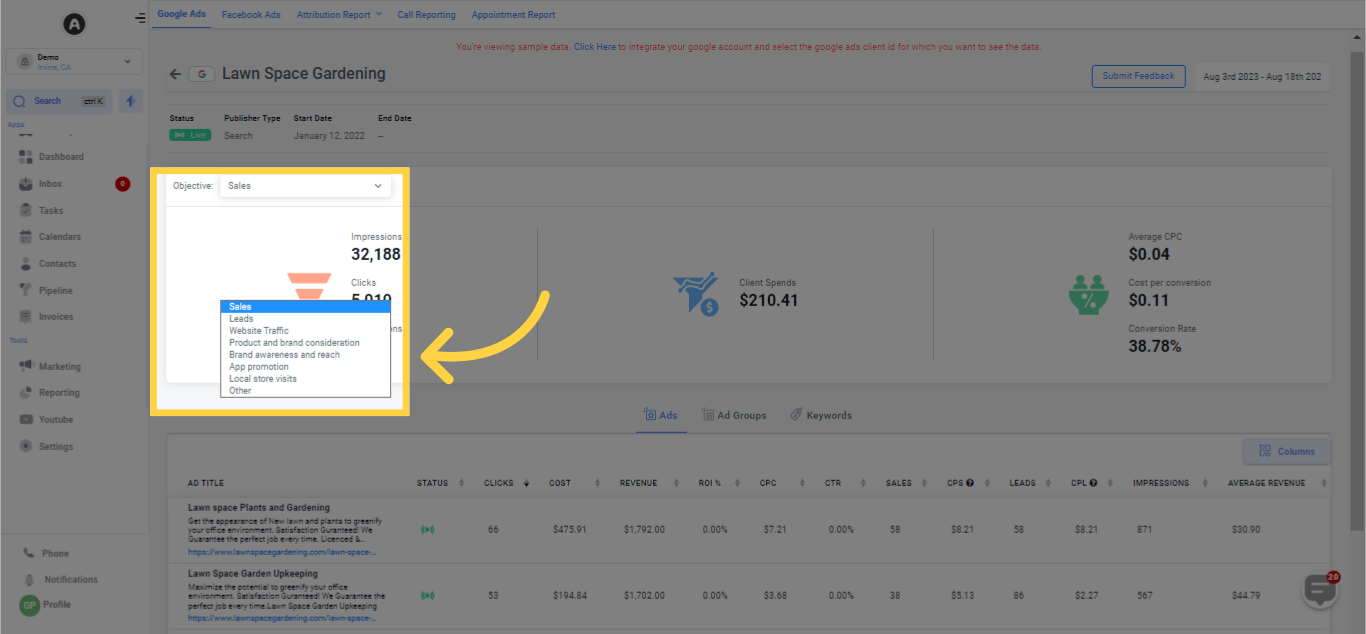
This dropdown menu allows you to filter ads according to the campaign objective.
These are the campaign-specific statistics displayed after selecting any campaign from the list of all campaigns. Let's examine each stat individually.
Indicates the count of instances the ad from the selected campaign was displayed during a particular time span.
Indicates the count of times the ad from the chosen campaign was clicked.
Indicates the number of instances the ad achieved the intended result, based on the objective and settings.
Displays the total expenditure incurred on the ad campaign.
Shows the average Cost Per Click (CPC) for the selected ad campaign.

Displays the cost per conversion for the chosen ad campaign.
Displays the conversion rate for the chosen ad campaign.
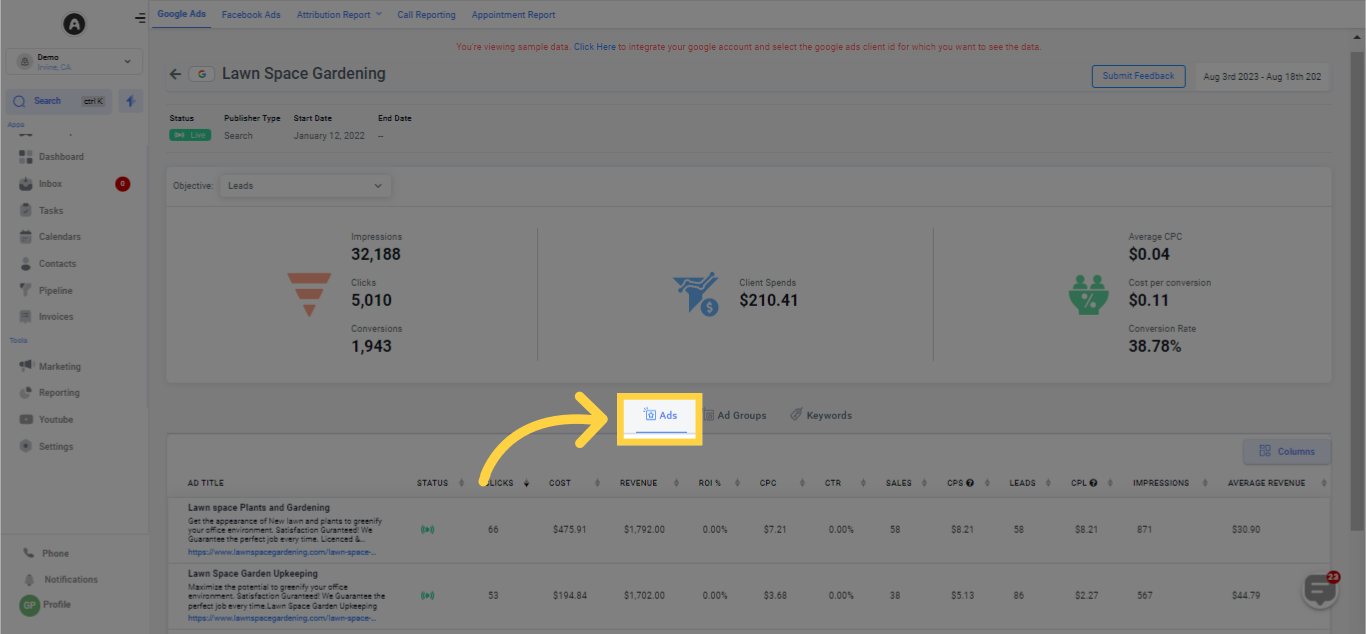
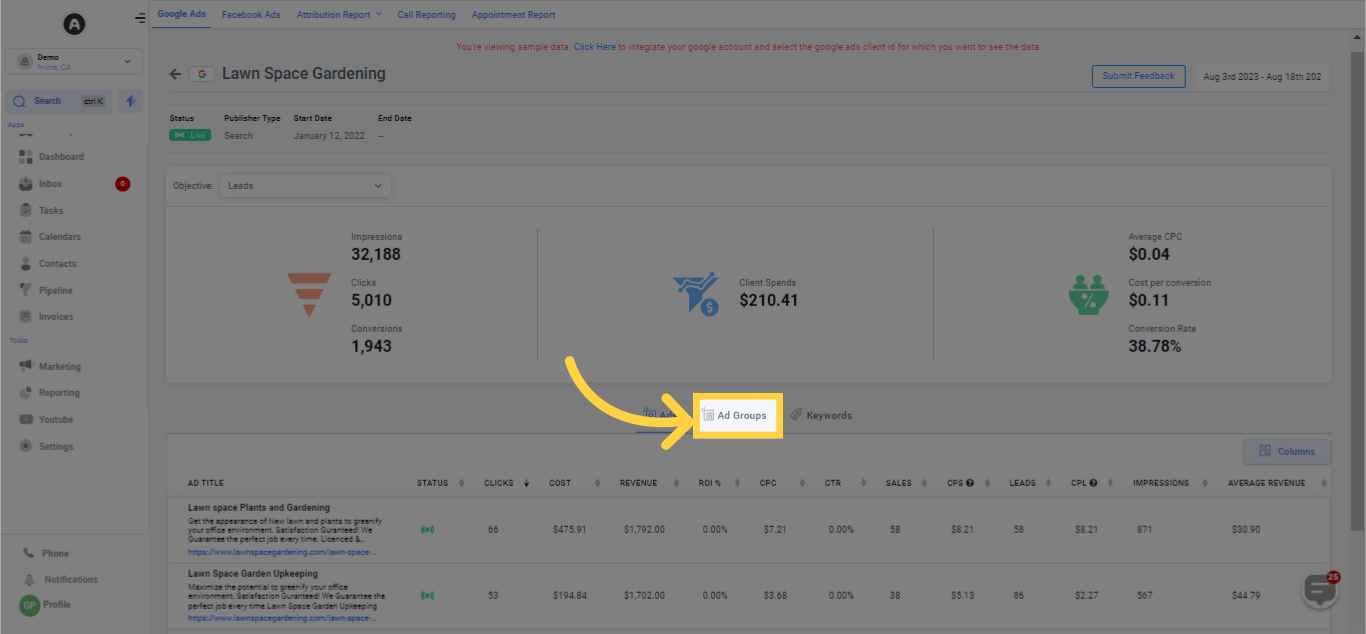
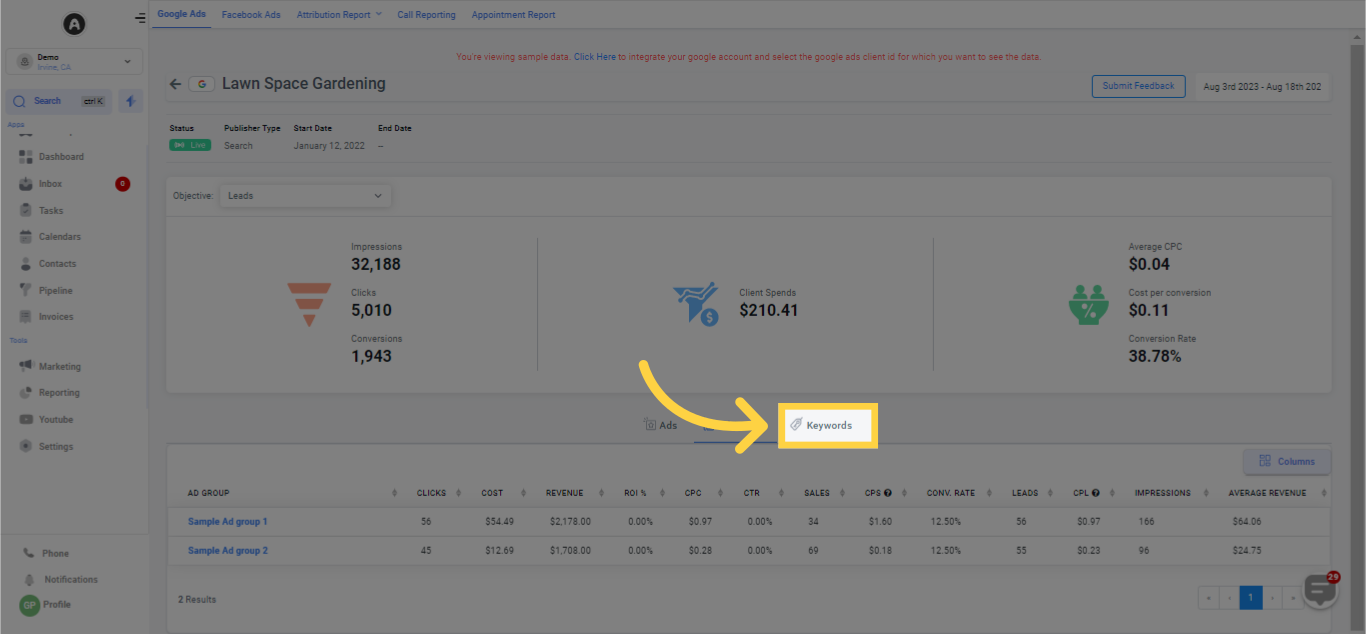
Reporting Types supply data pertaining to the ads, ad groups, and keywords utilized in an ad campaign. Effortlessly view ad statistics at a macro or micro level according to your preferences!
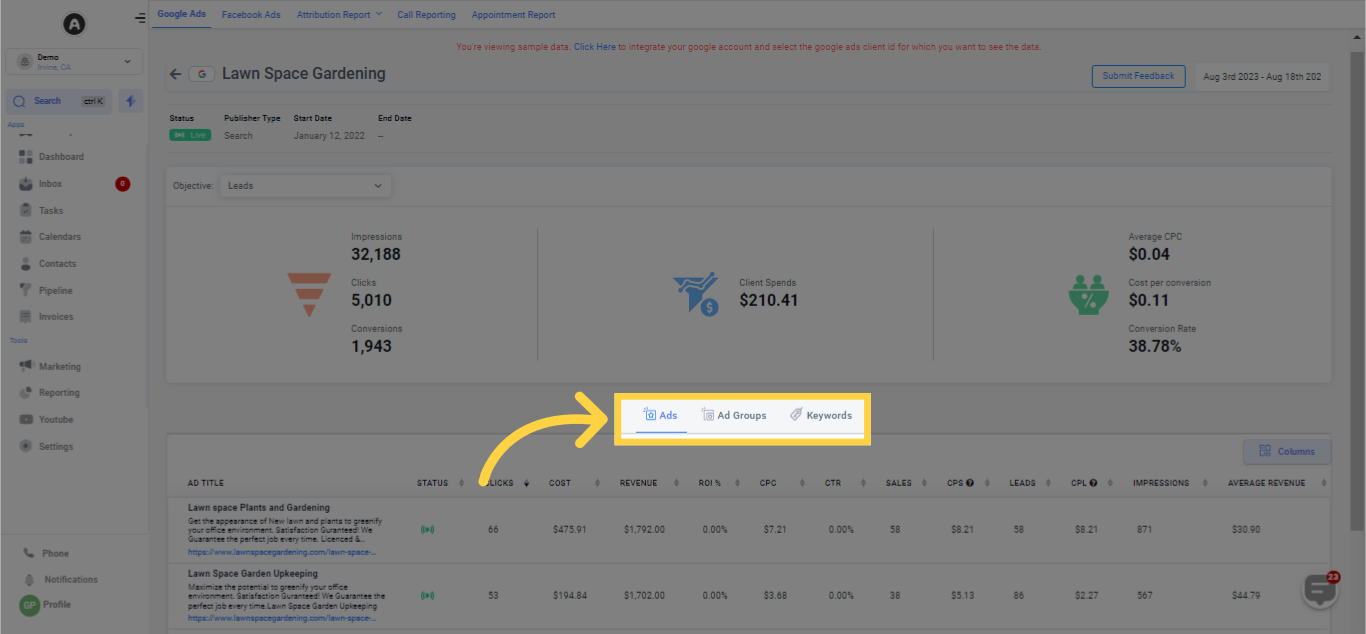
Here, you'll observe the statistics for each individual ad created within the ad campaign. Allow us to examine each metric sequentially.
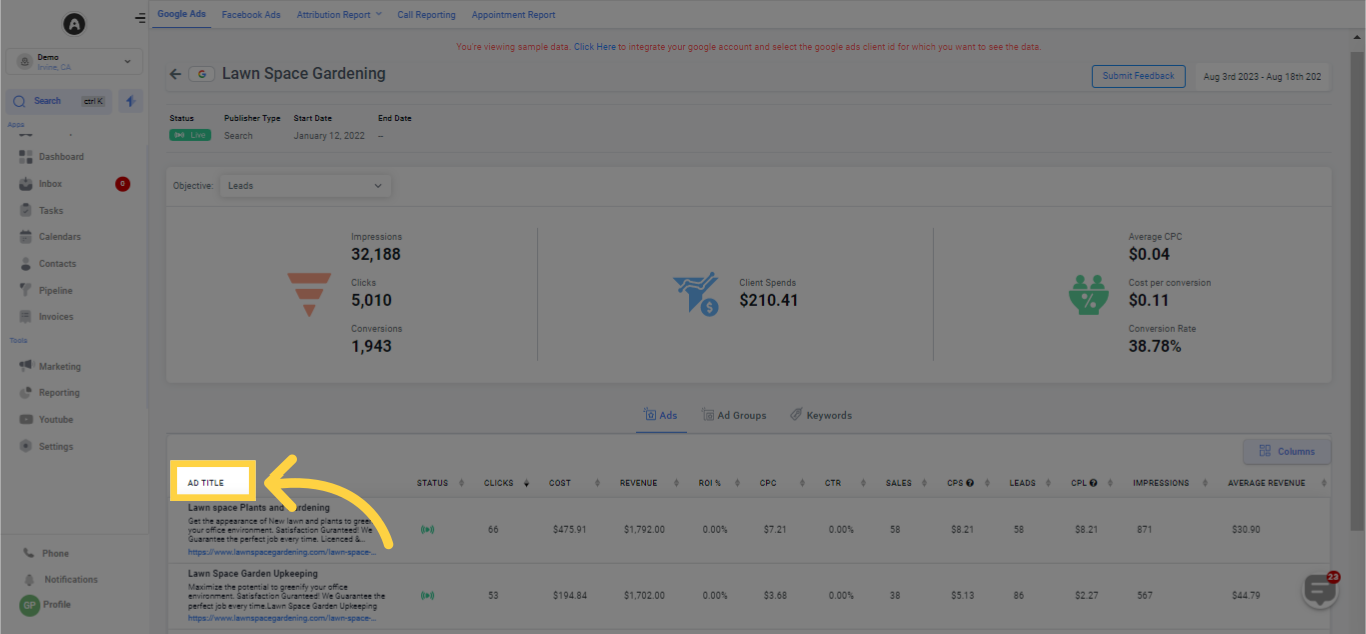
Displays the title of each ad you've crafted within the ad campaign.
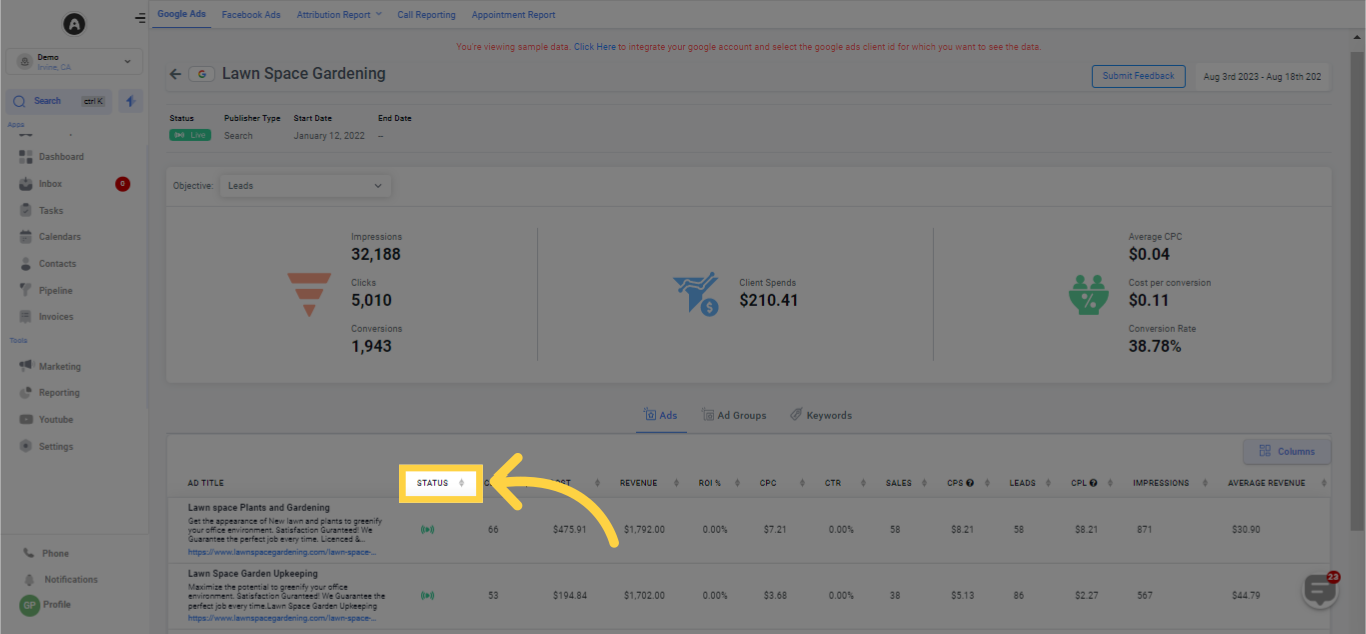
Indicates the status of the ad, whether it's currently live or paused.
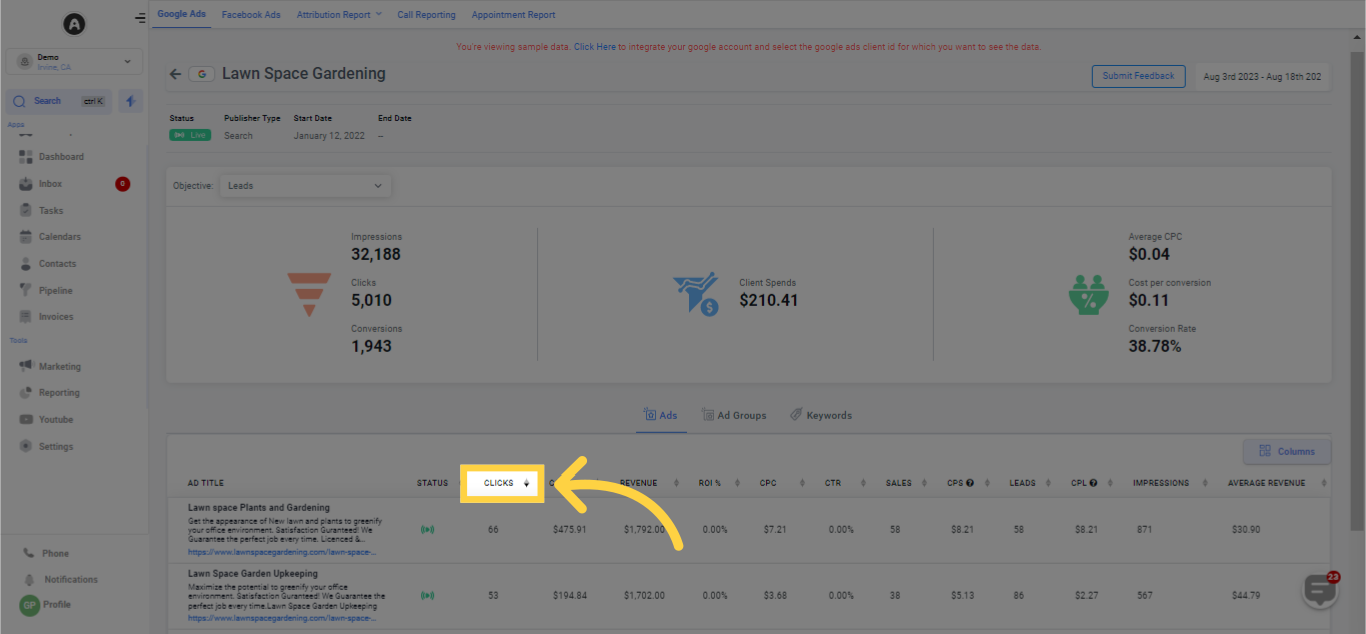
Displays the count of clicks received for each ad title in the list.
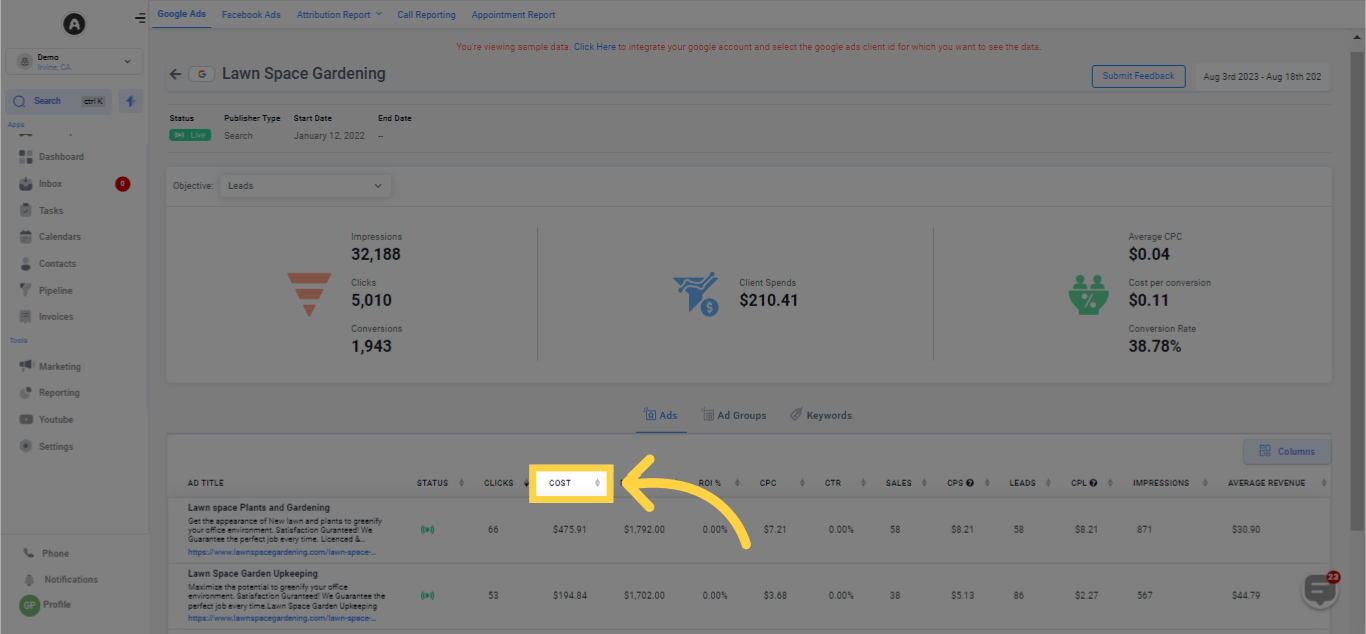
Indicates the expense related to each ad within the campaign.
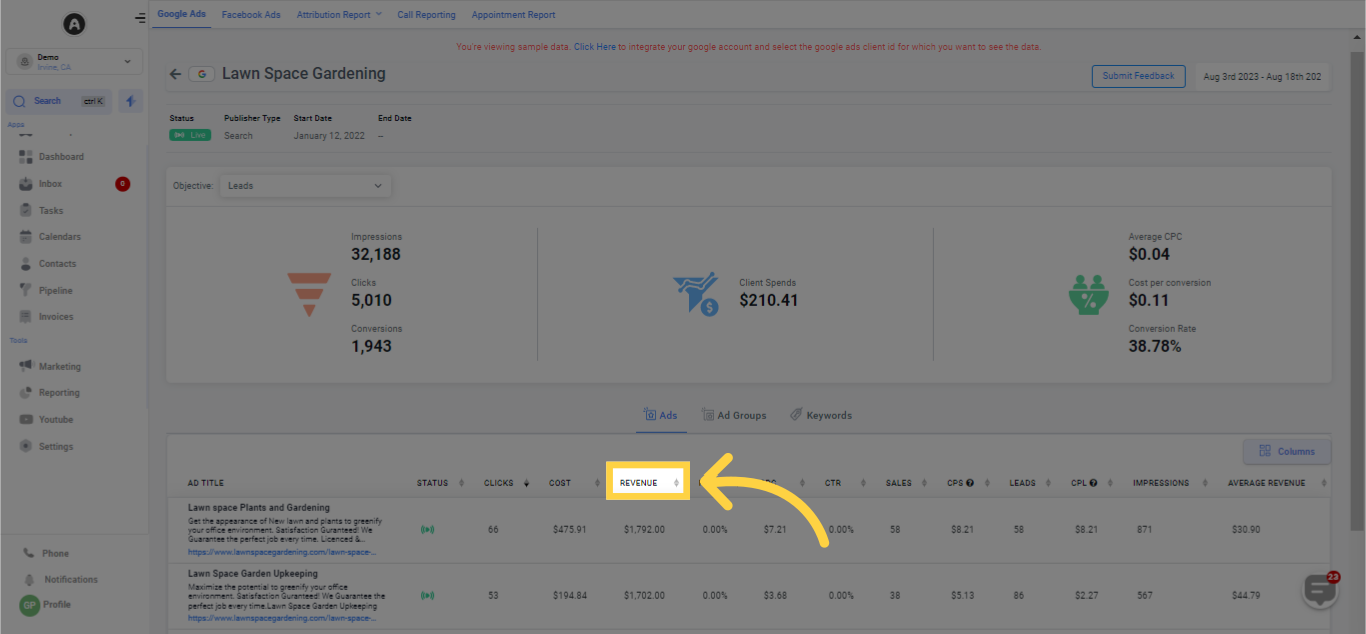
Indicates the revenue derived from each ad within the campaign.
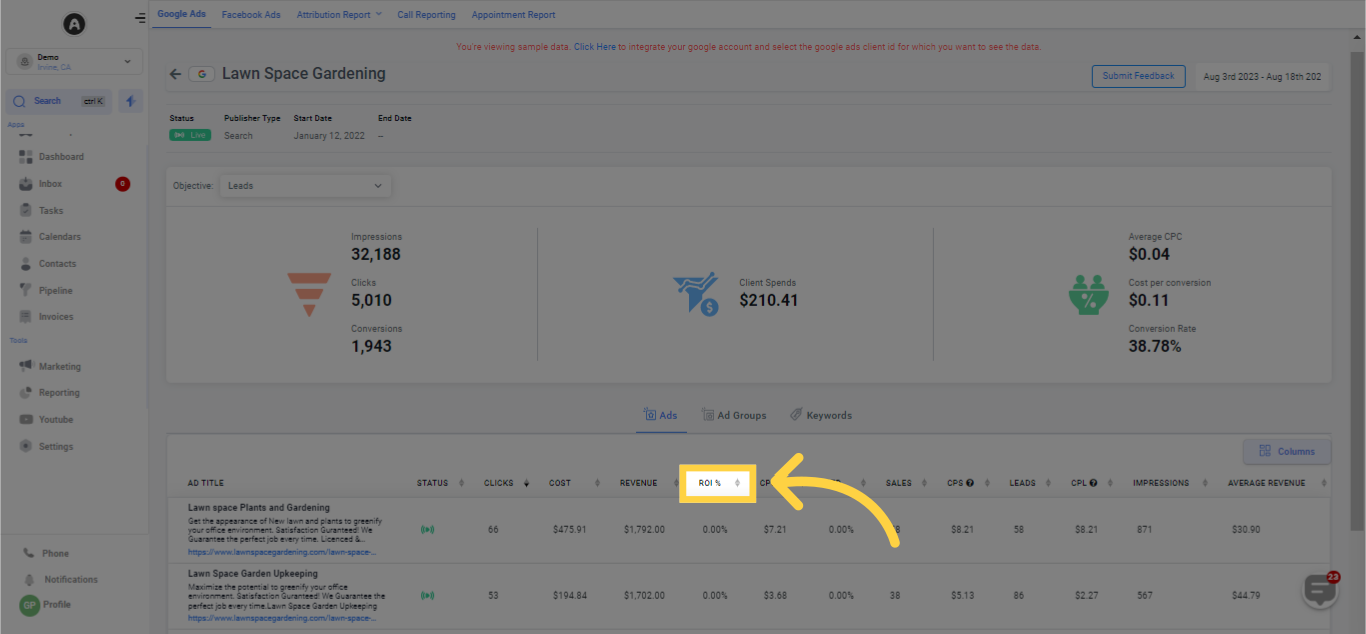
Displays the Return on Investment (ROI) for each ad within the campaign.
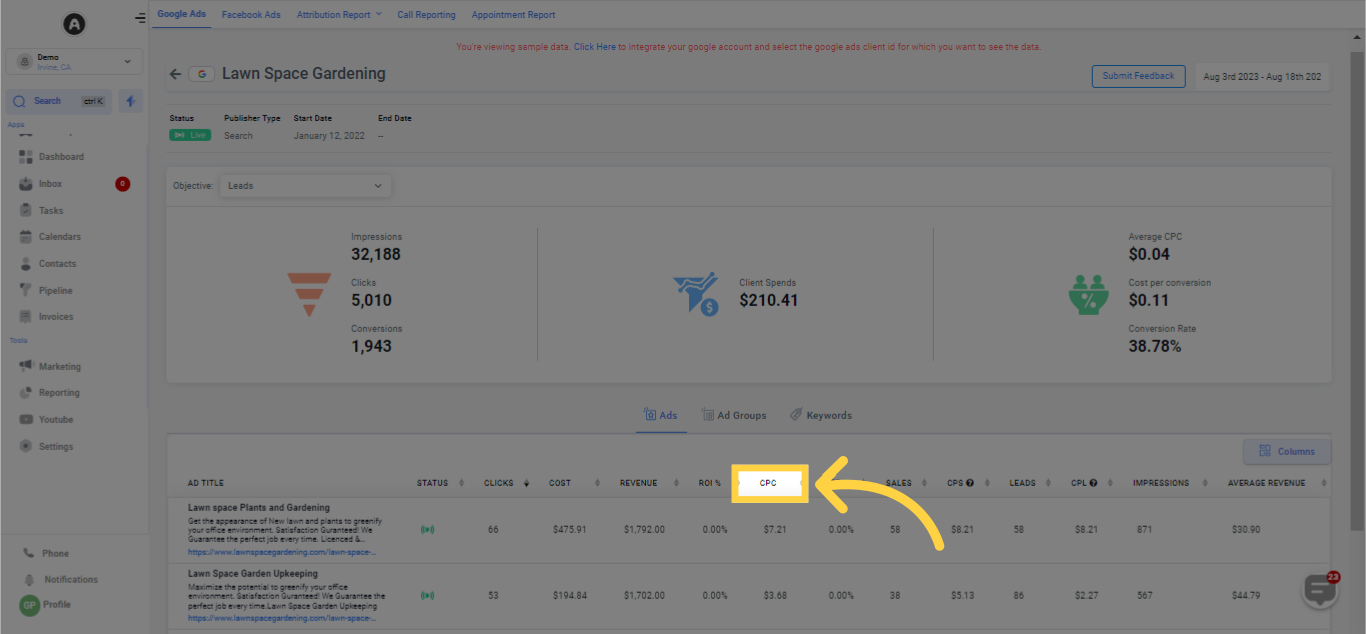
Displays the expenditure you've incurred per click for each ad in the list.
Indicates the sales derived from the ad.
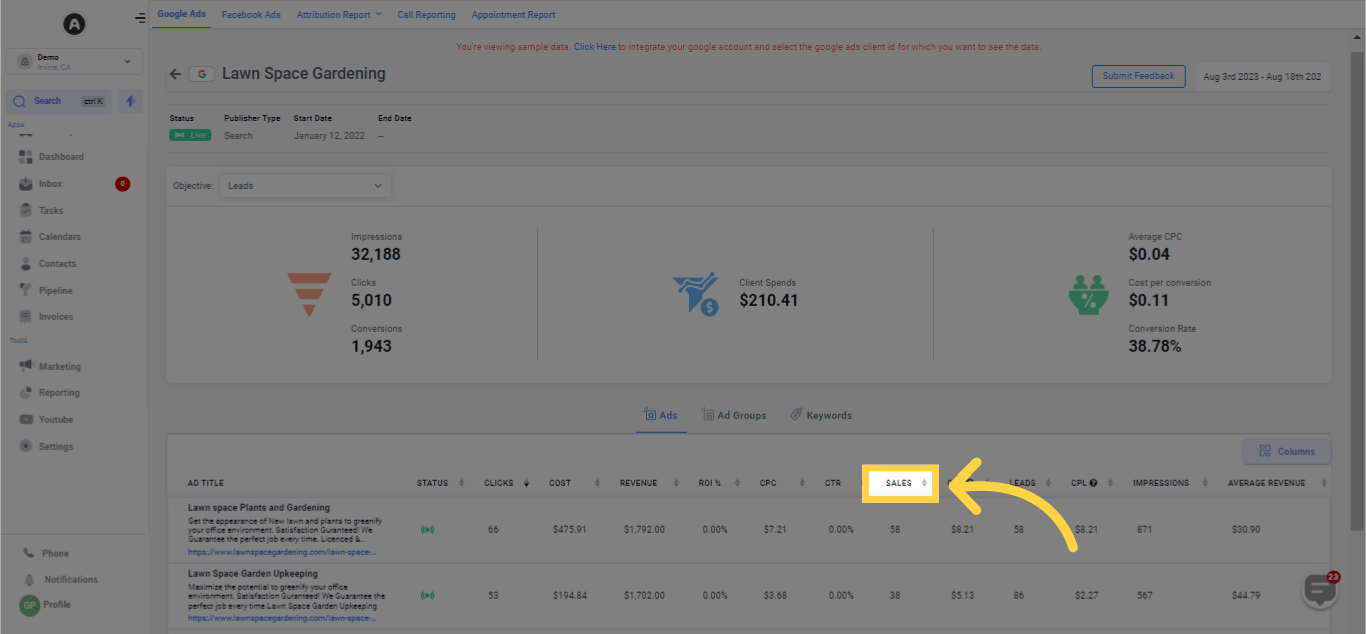
Displays the sum of money spent for every sale generated from a particular advertisement.
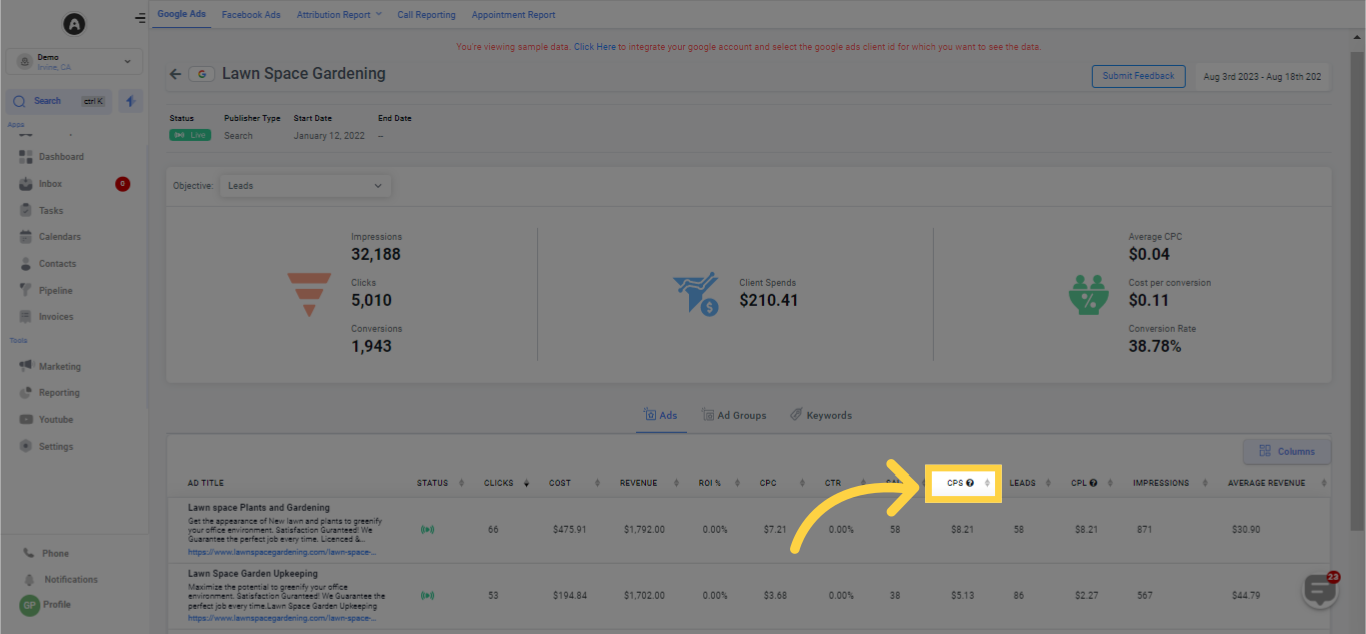
Indicates the count of leads produced from the ad.
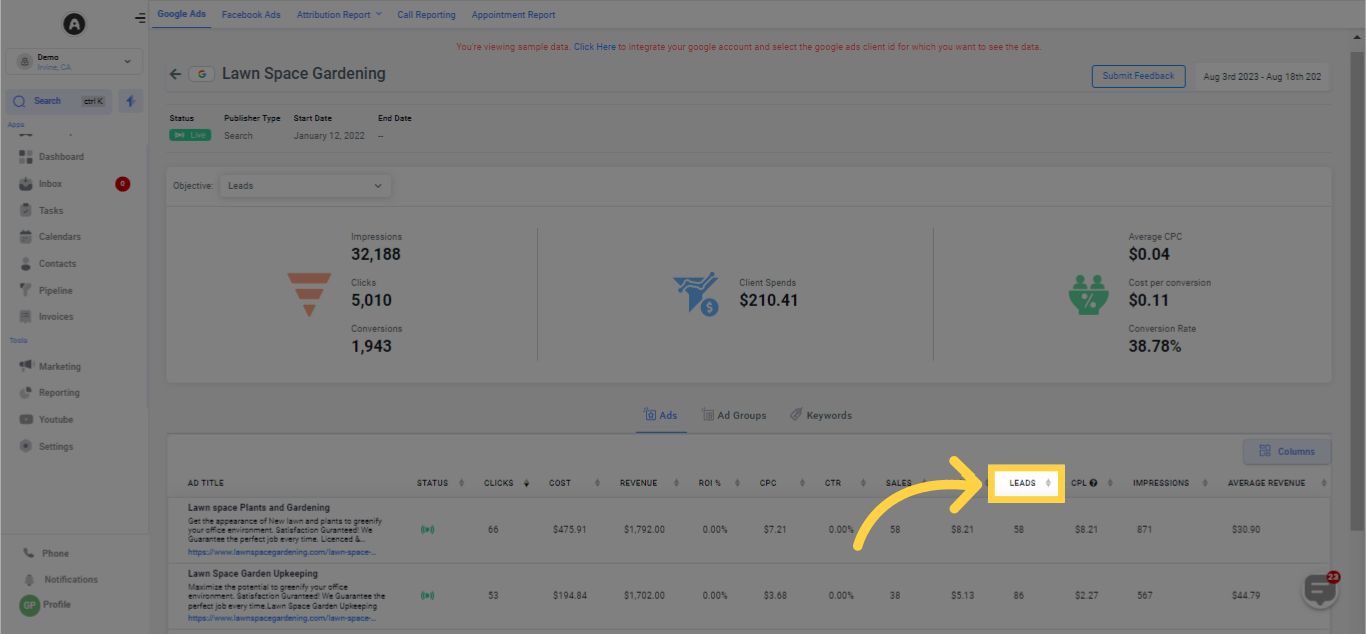
Displays the cost per lead for each ad.
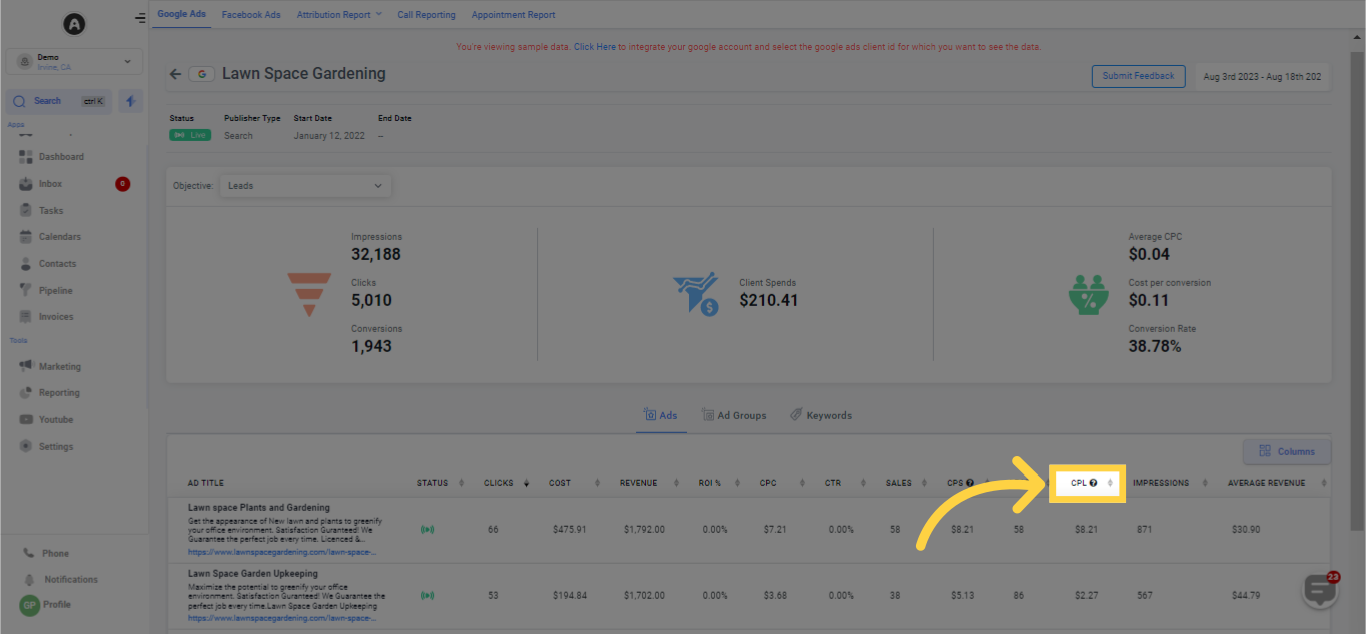
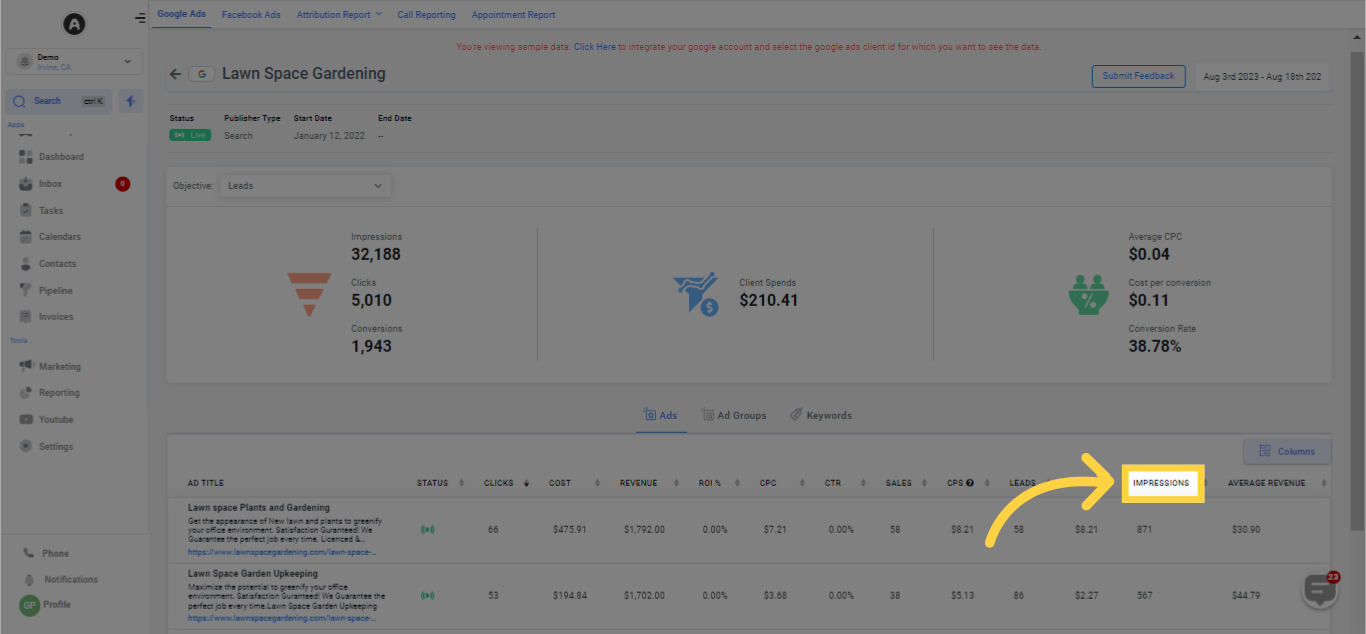
Indicates the count of times the ad was displayed.
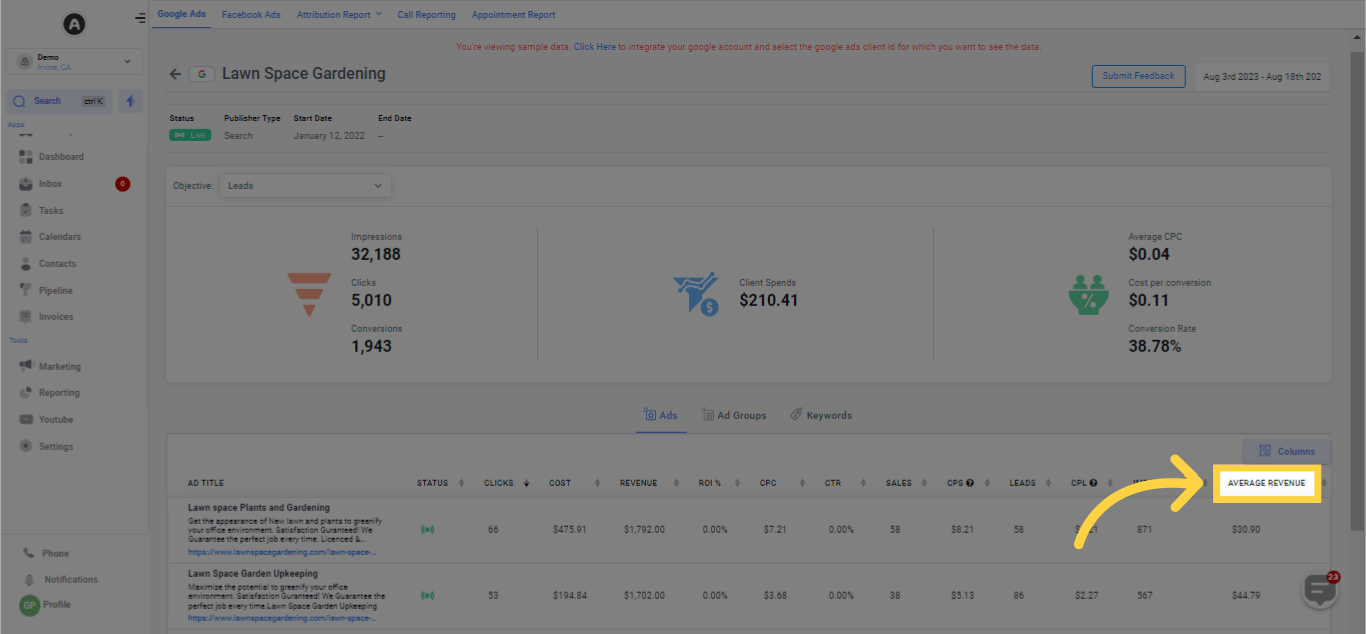
Displays the average revenue generated from each ad.
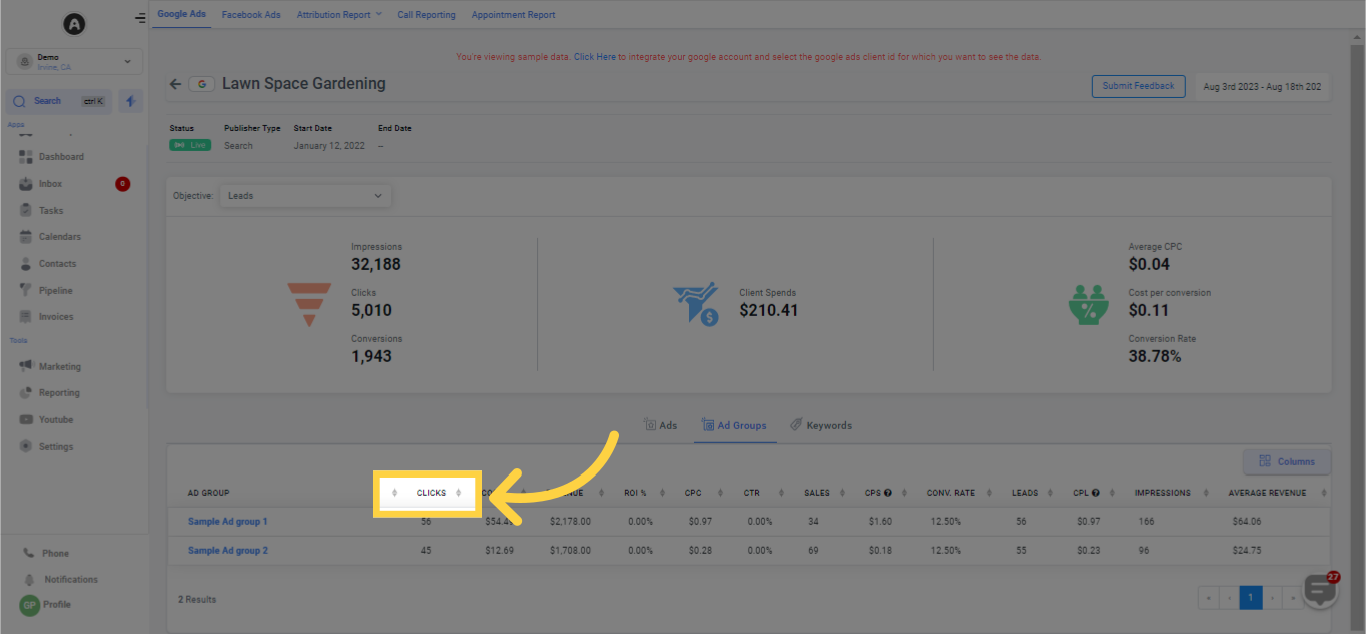
Displays the name of the ad group.
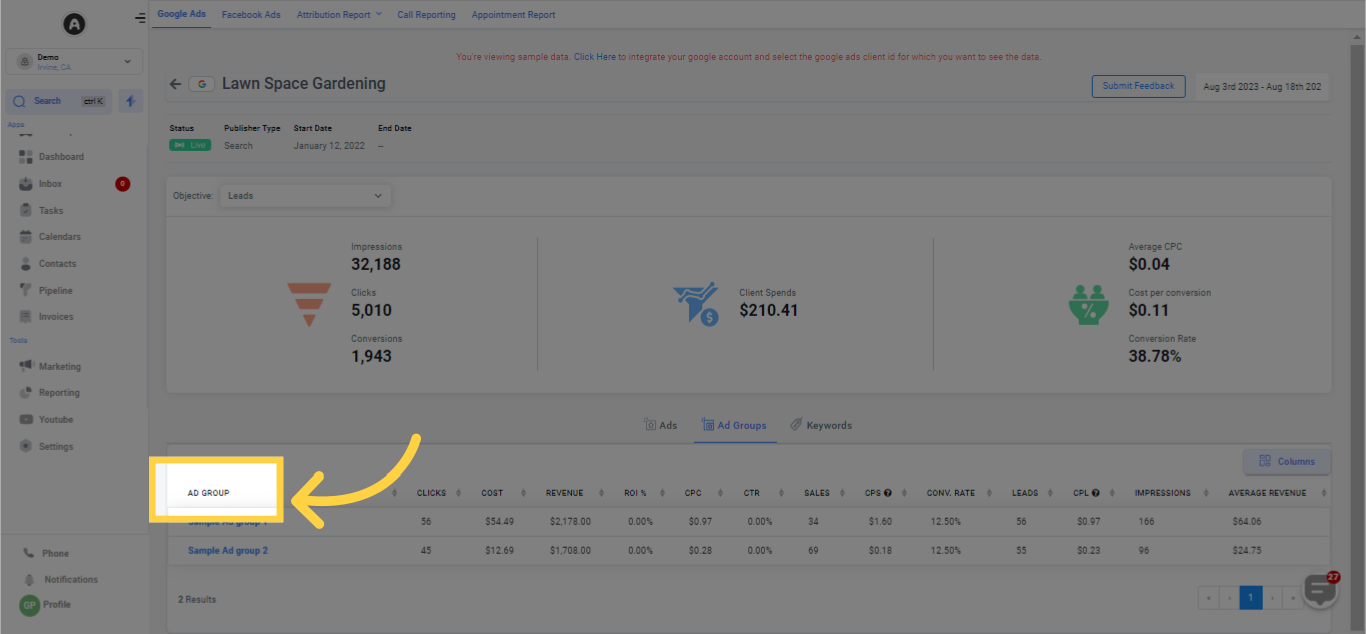
Indicates the count of clicks the ad group has garnered.
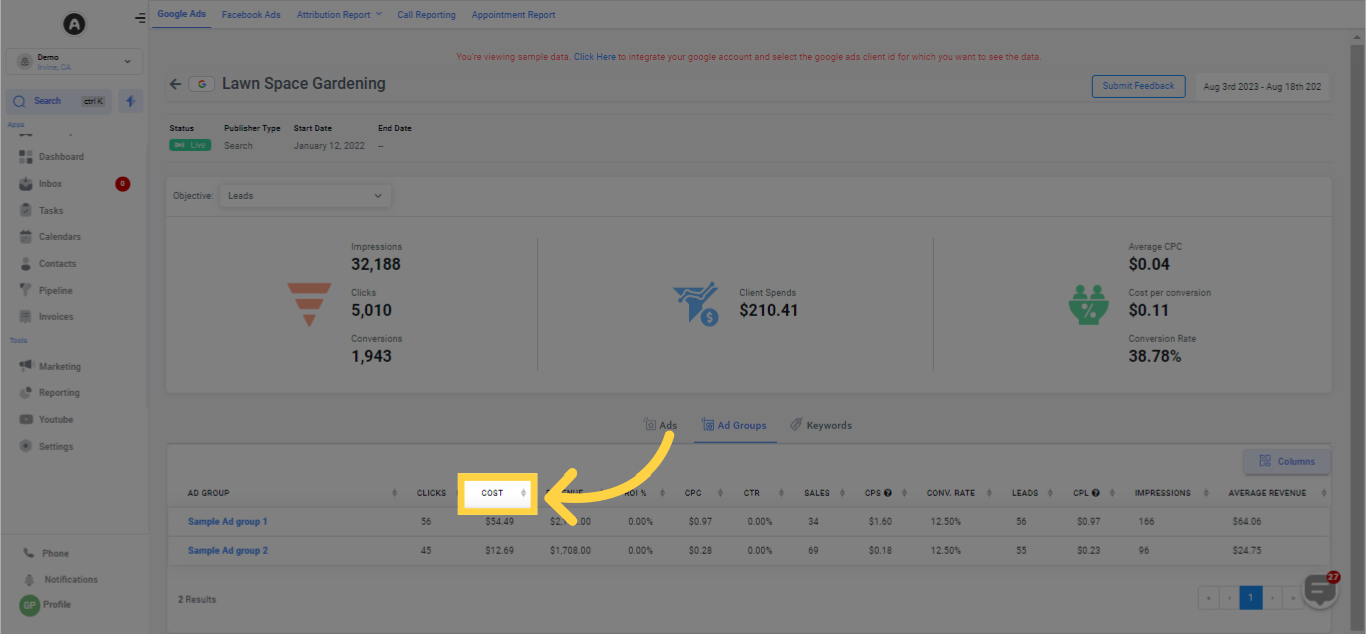
Indicates the total expenditure for each ad group.
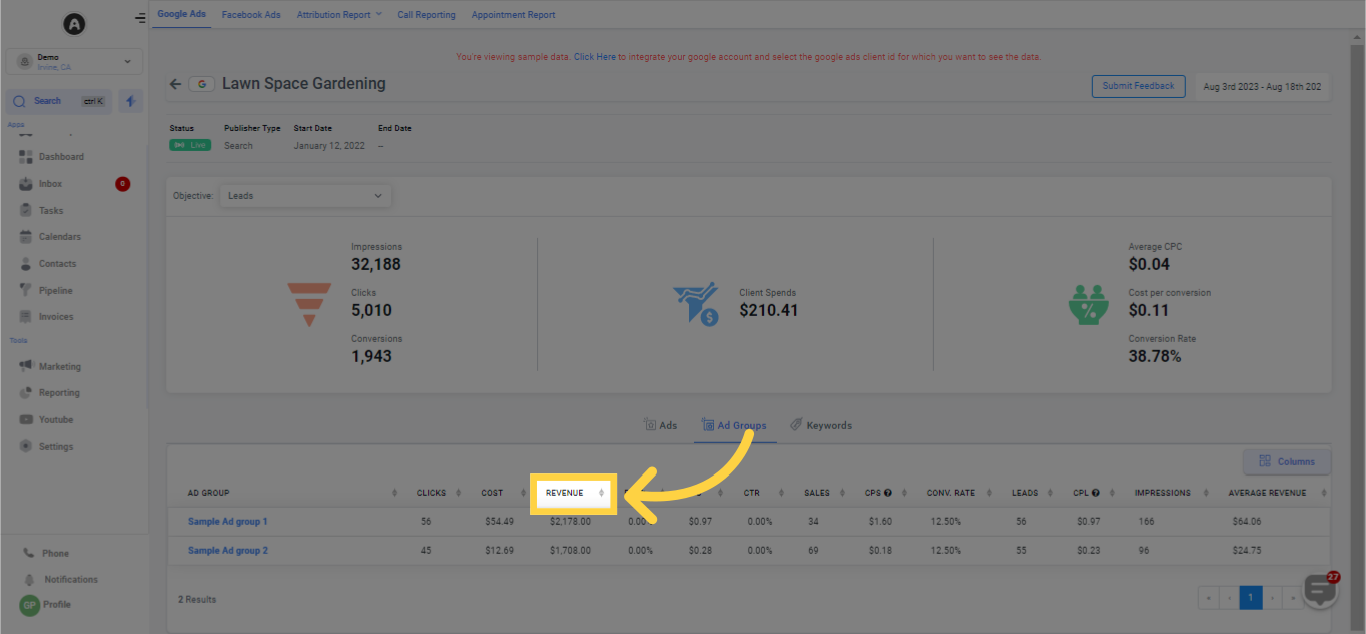
Displays the revenue produced from each ad group.
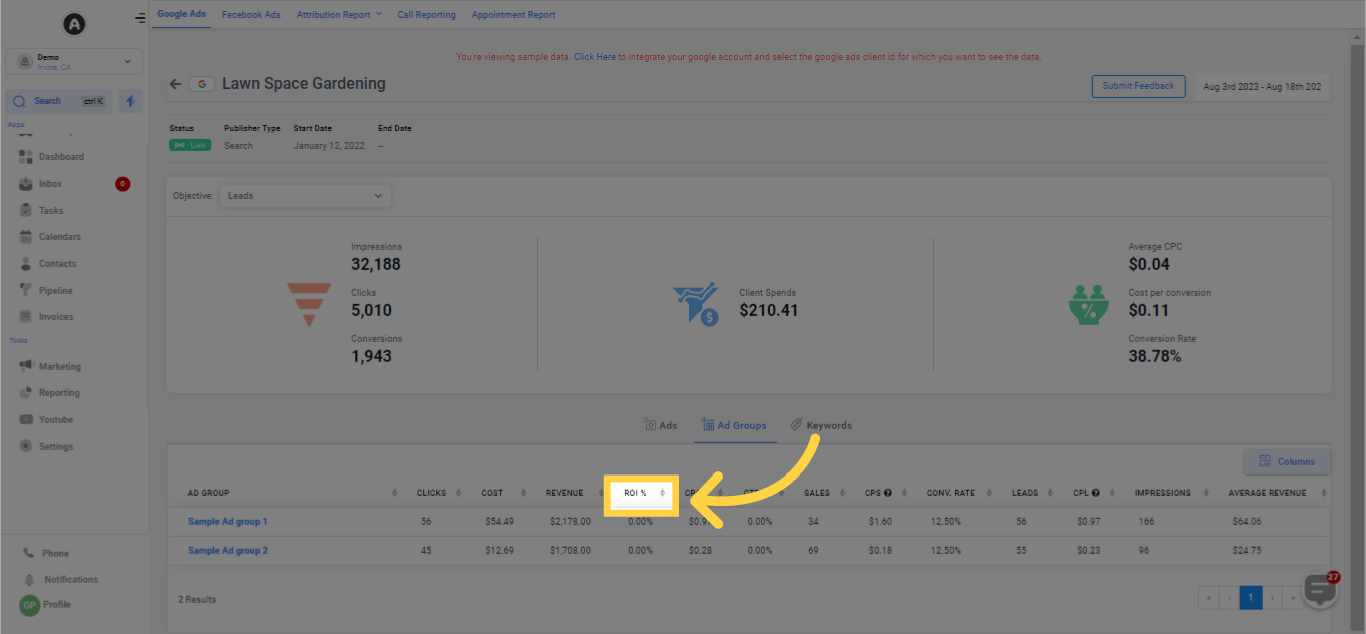
Displays the Return on Investment (ROI) from each ad group.
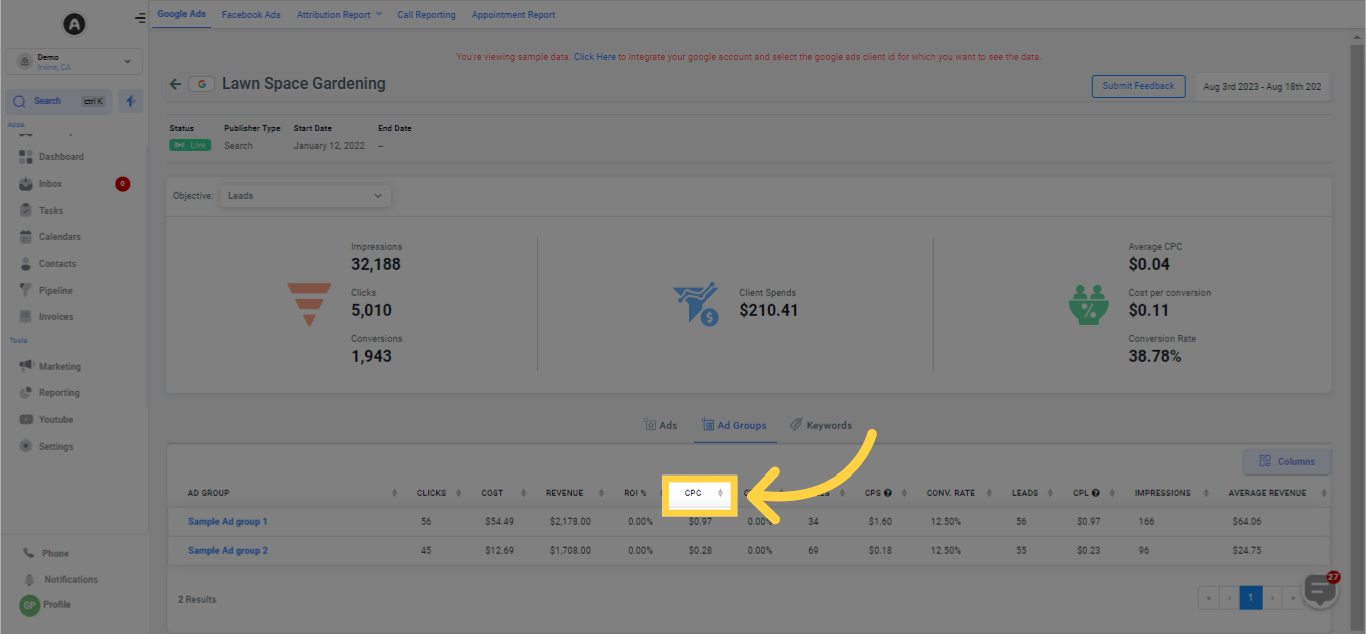
Indicates the Cost Per Click (CPC) for each ad group.
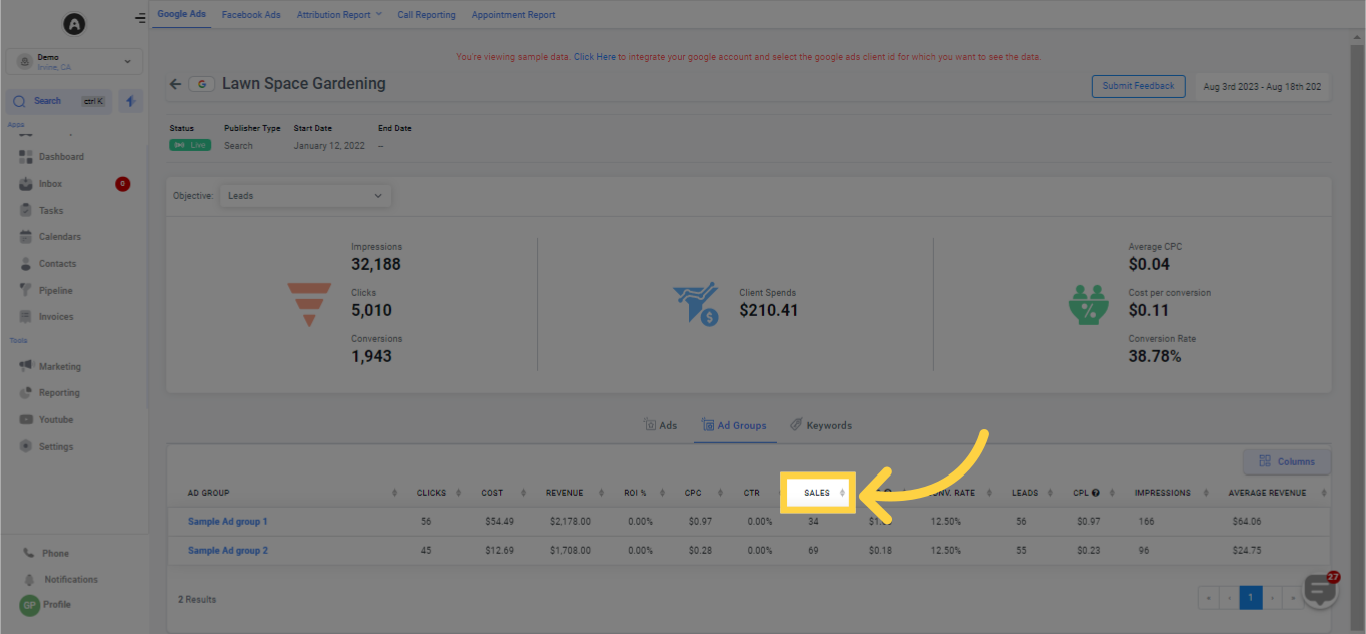
Displays the sales produced from each ad group.
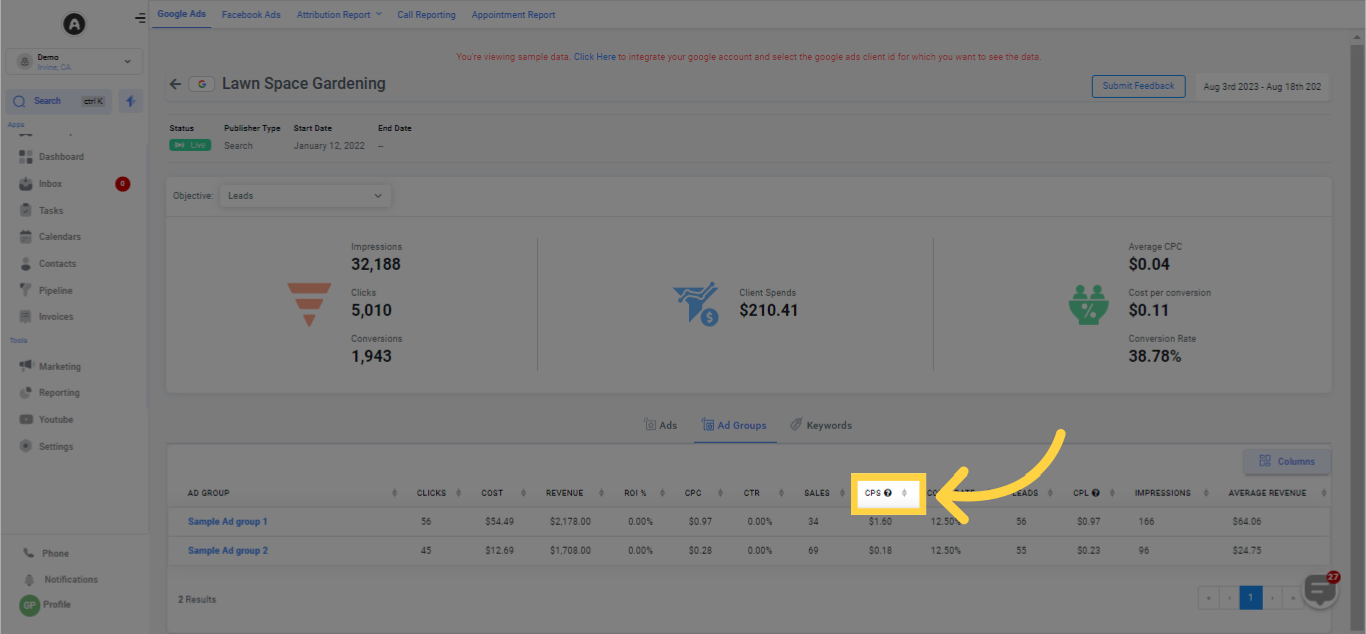
Shows the amount of money spent to get one sale.
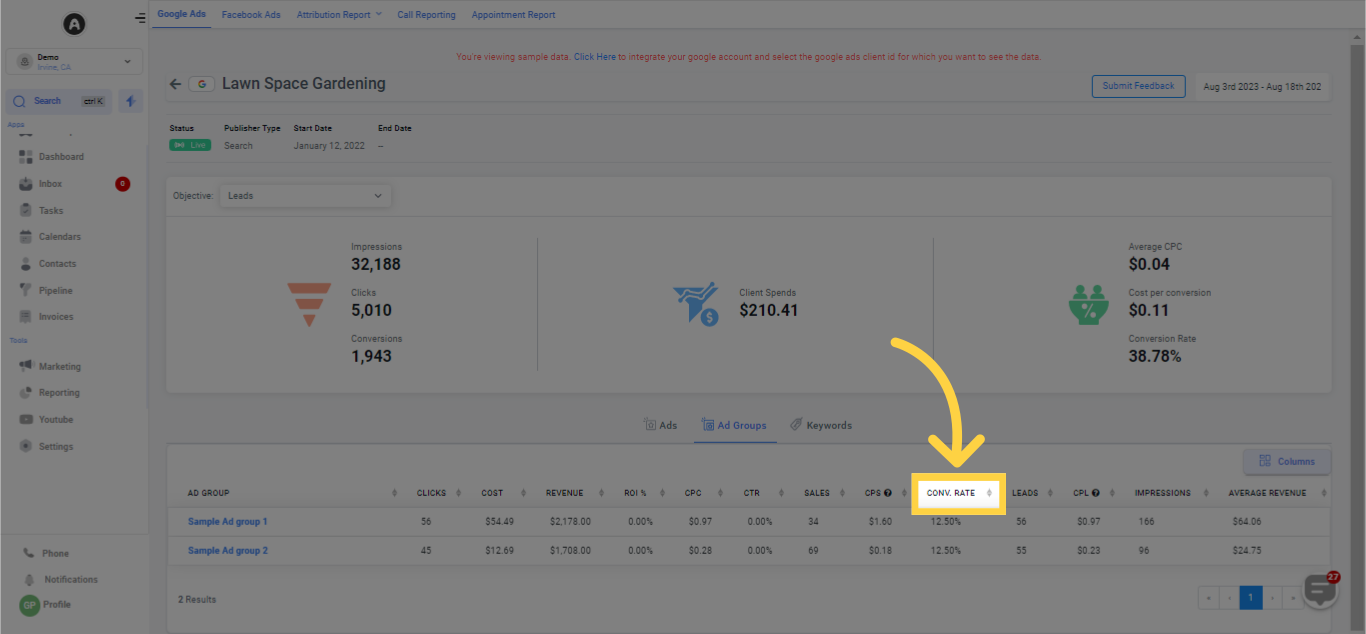
Displays the conversion rate as a percentage for each ad group.
Displays the number of leads produced from each ad group.
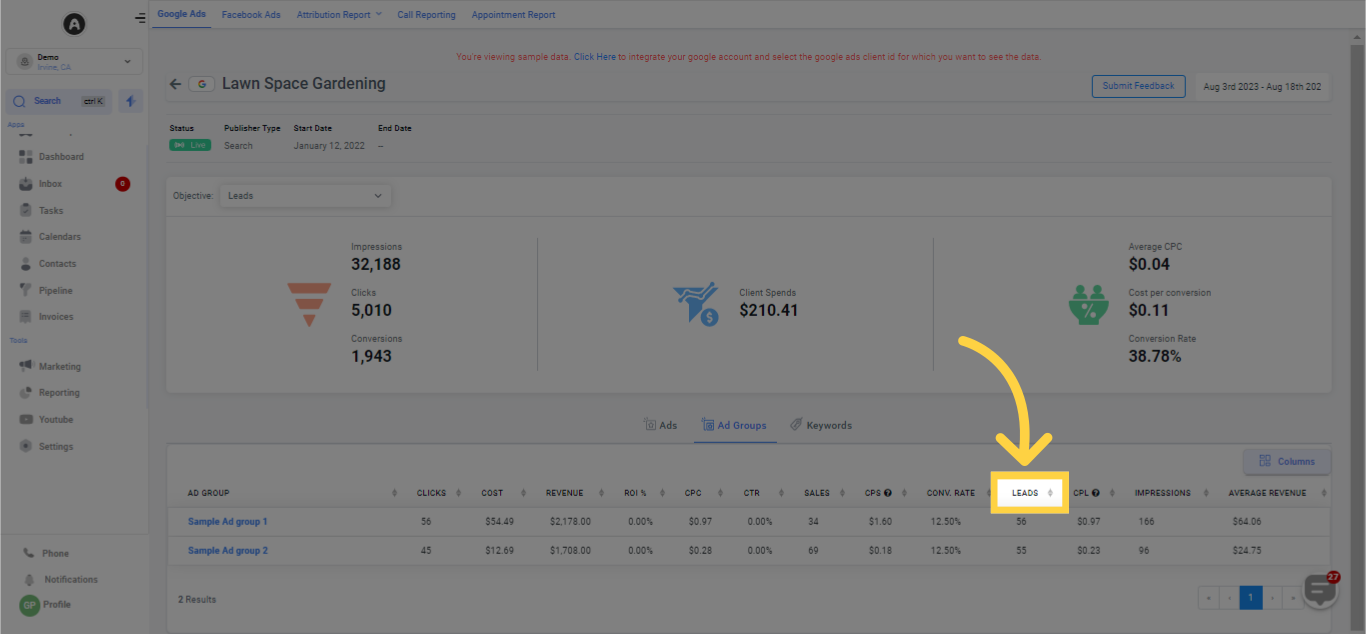
Indicates the cost per lead for each ad group.
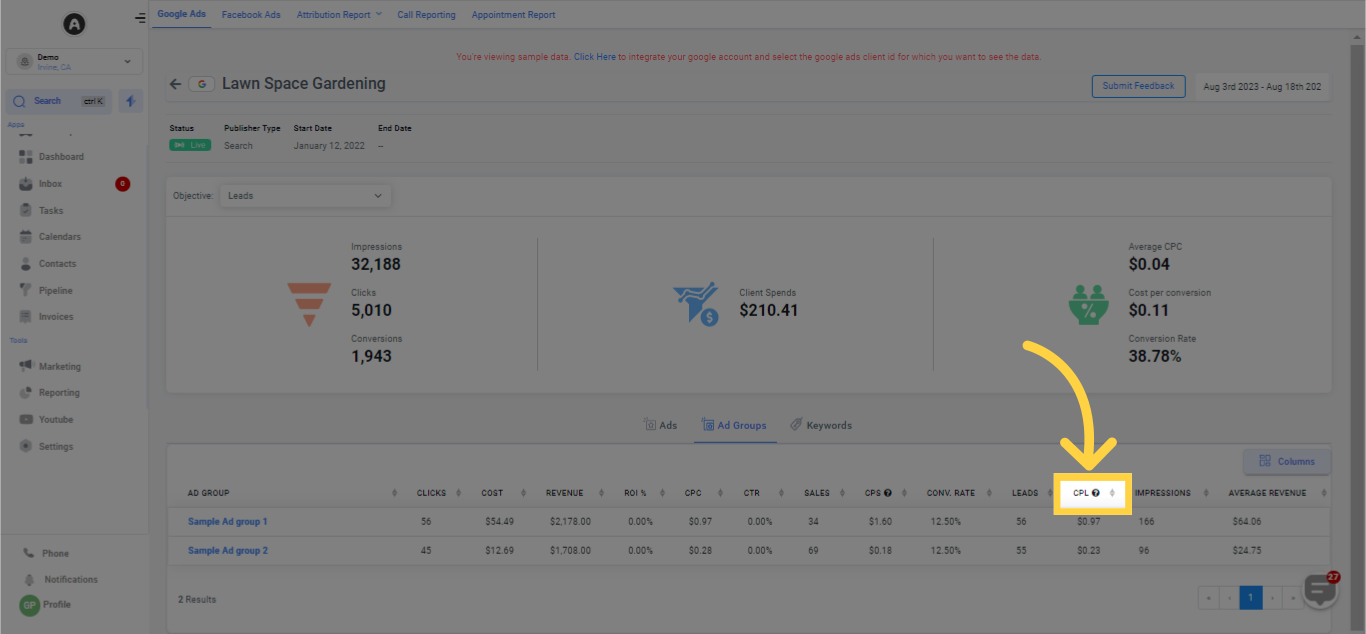
Indicates the count of times the ad from each ad group was displayed.
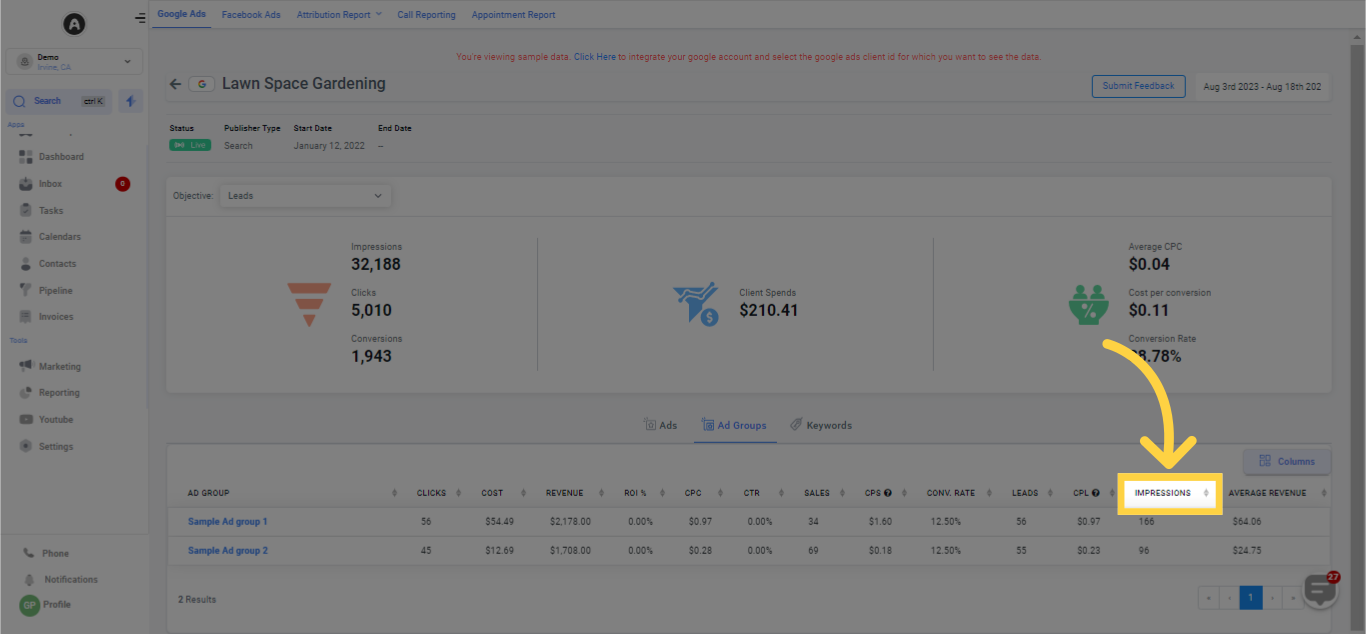
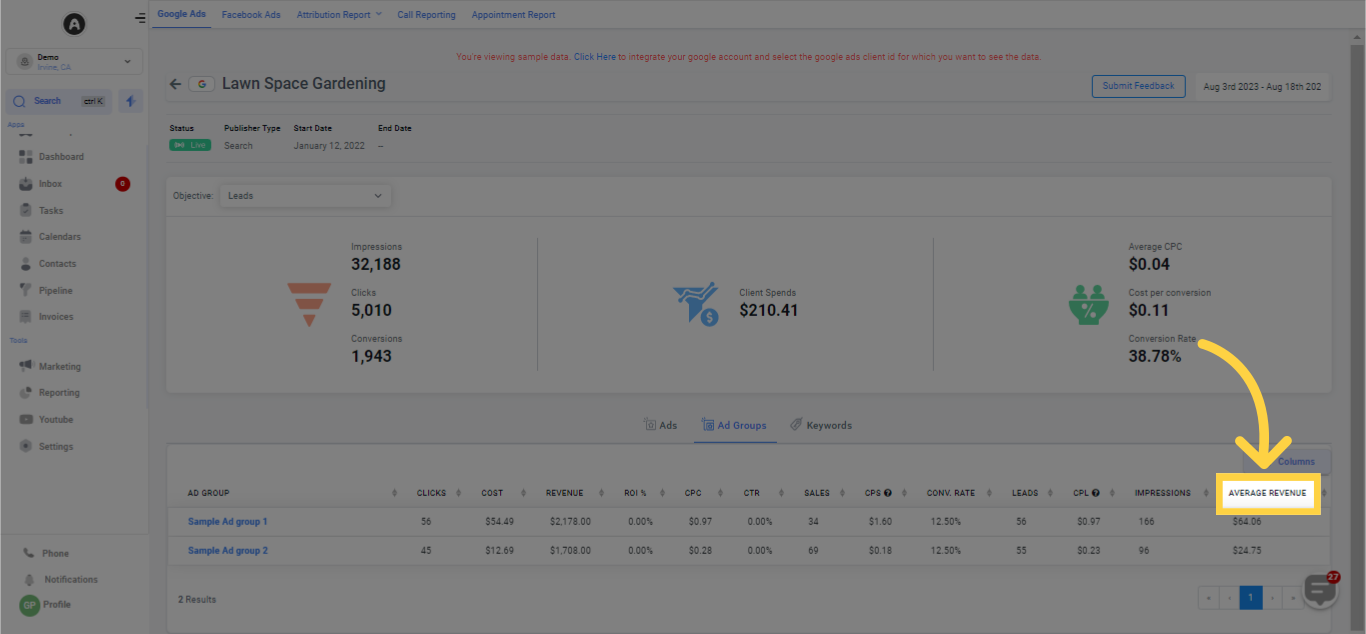
Indicates the average revenue produced from each ad group.
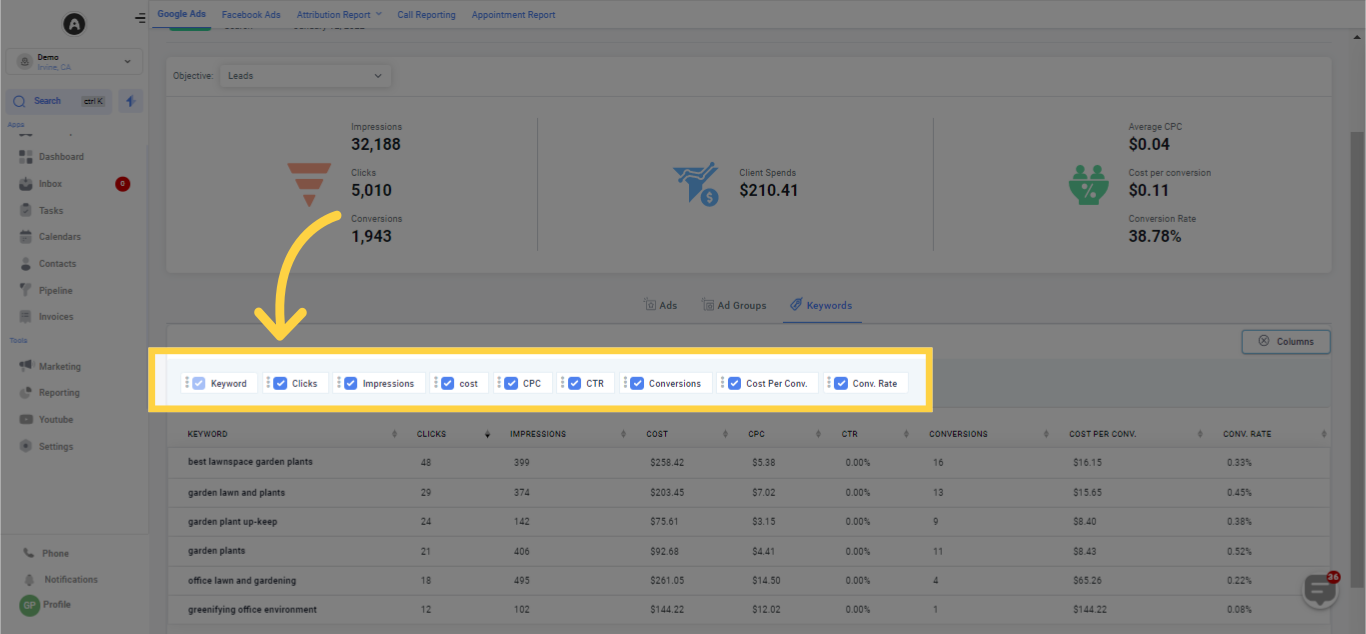
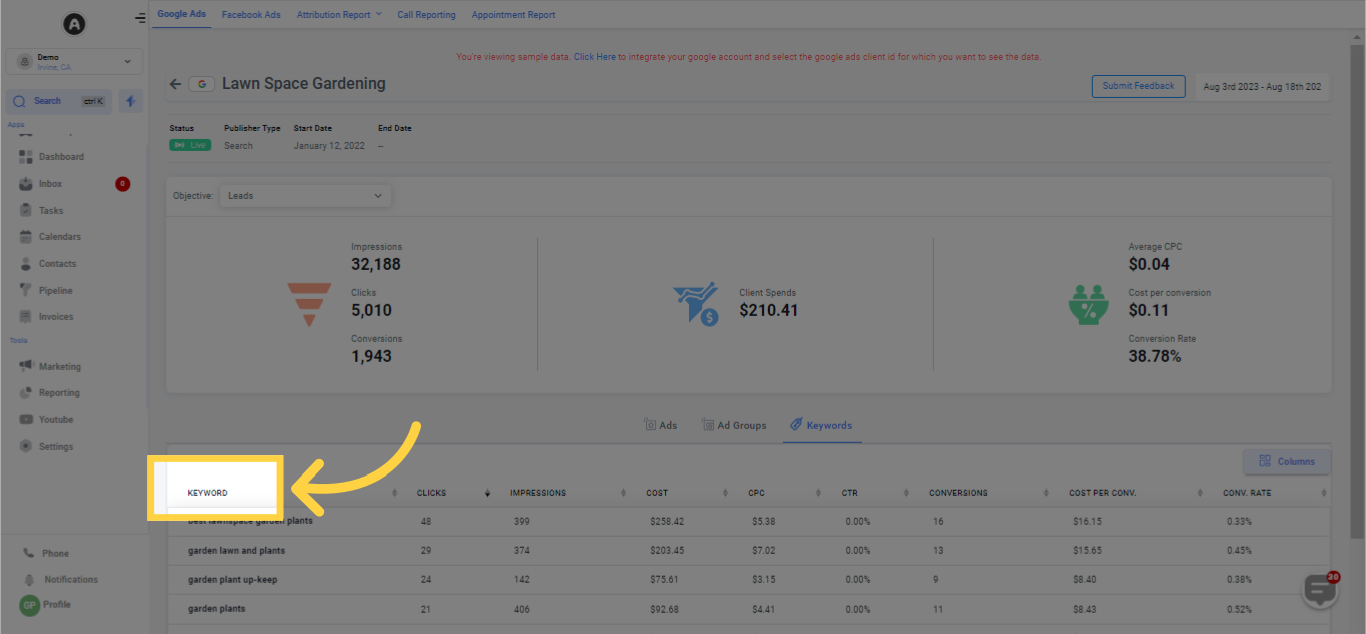
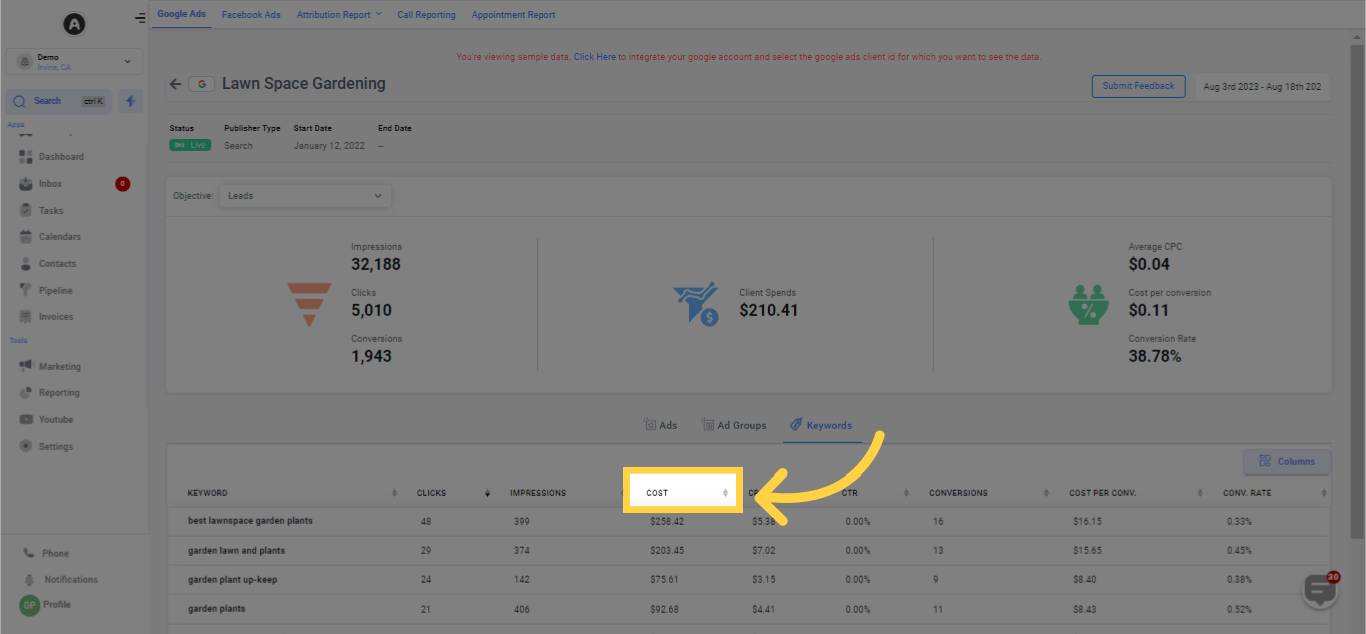
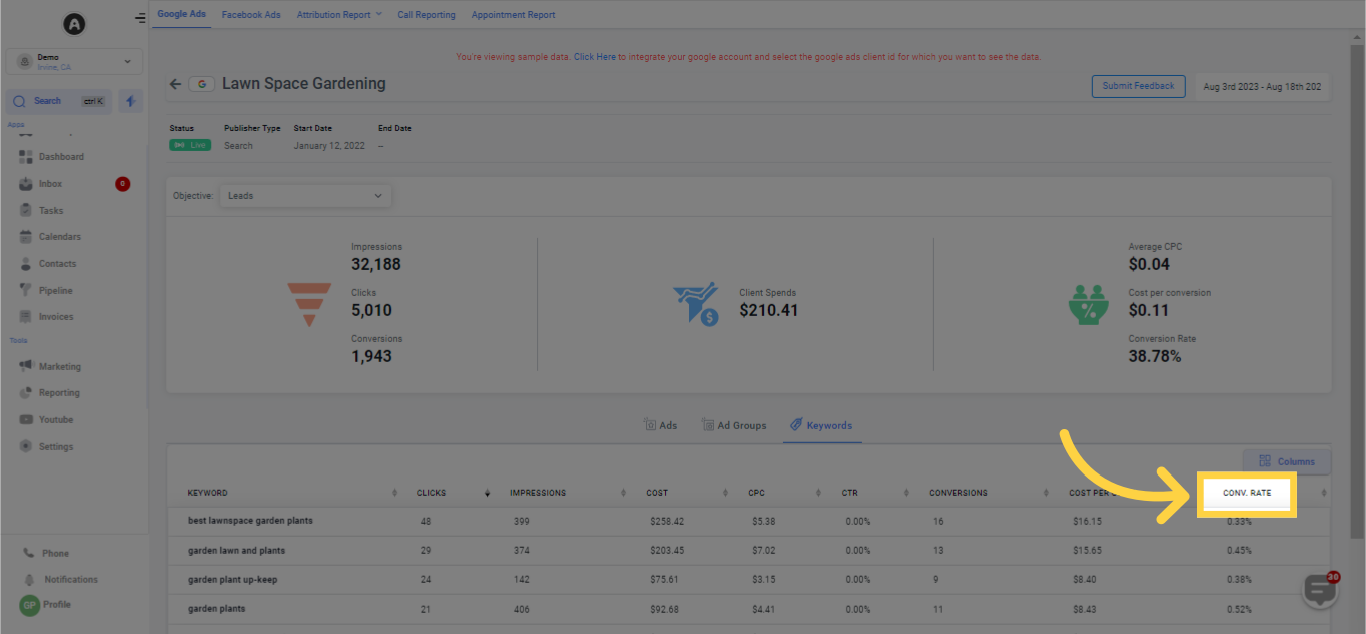
Here, you'll observe metrics associated with each keyword you've utilized within the ad campaign.
Displays all the keywords employed in the campaign.
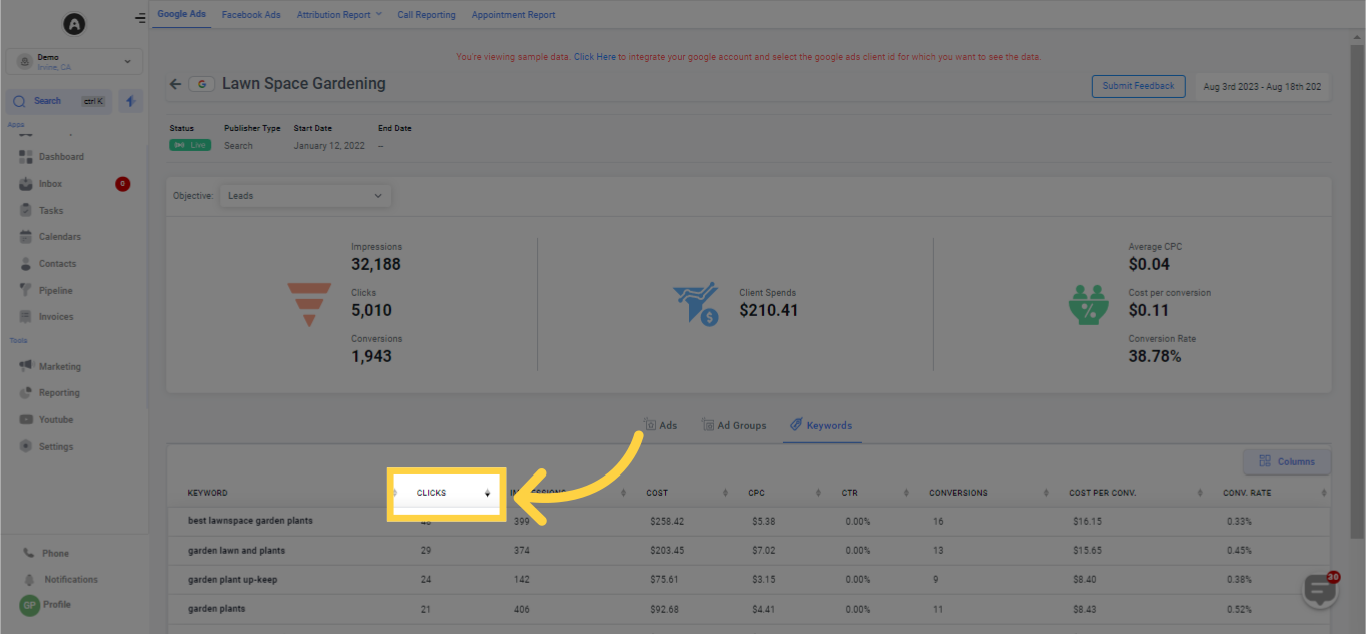
Displays the count of clicks received for each keyword on the list.
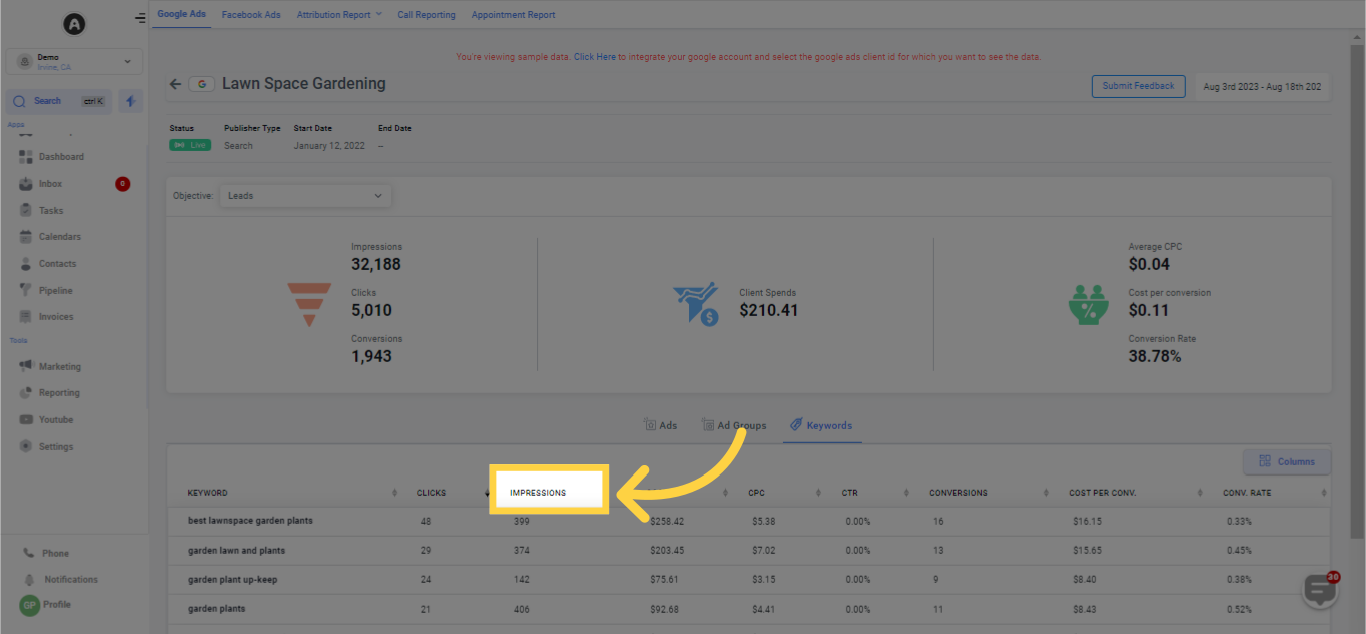
Indicates the count of times the ad for each keyword on the list was displayed.
Indicates the expenditure incurred for each keyword in the auction.
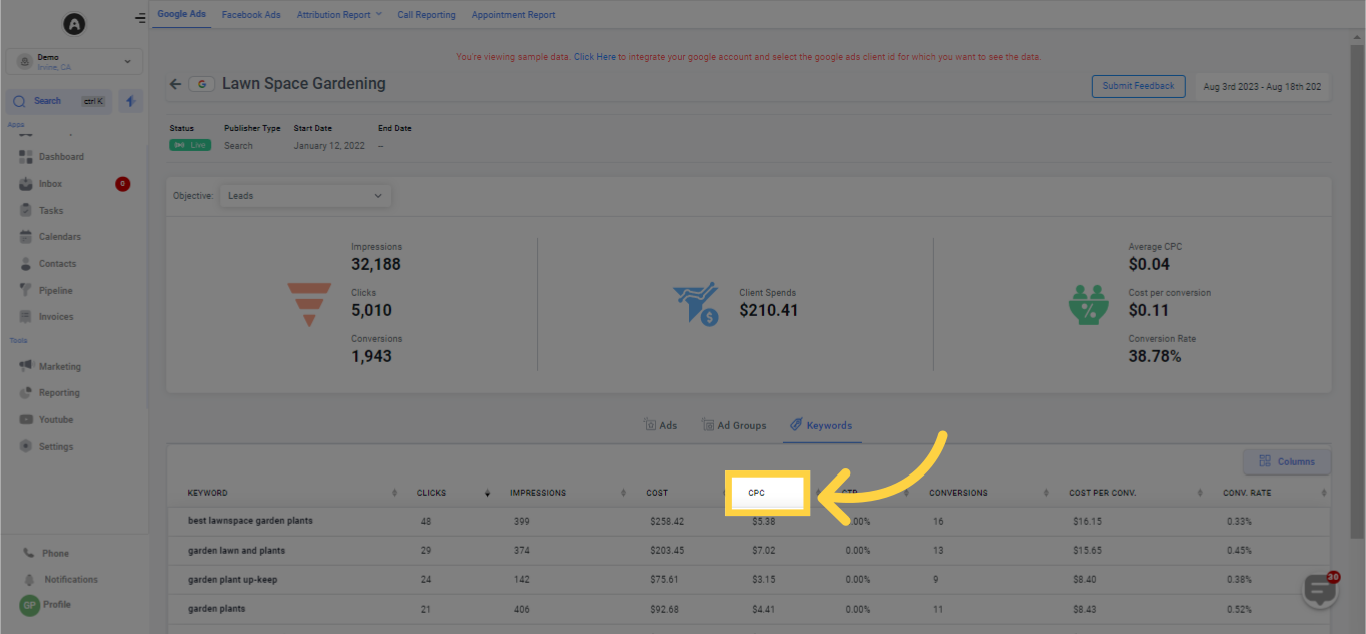
Indicates the cost per click for each keyword listed.
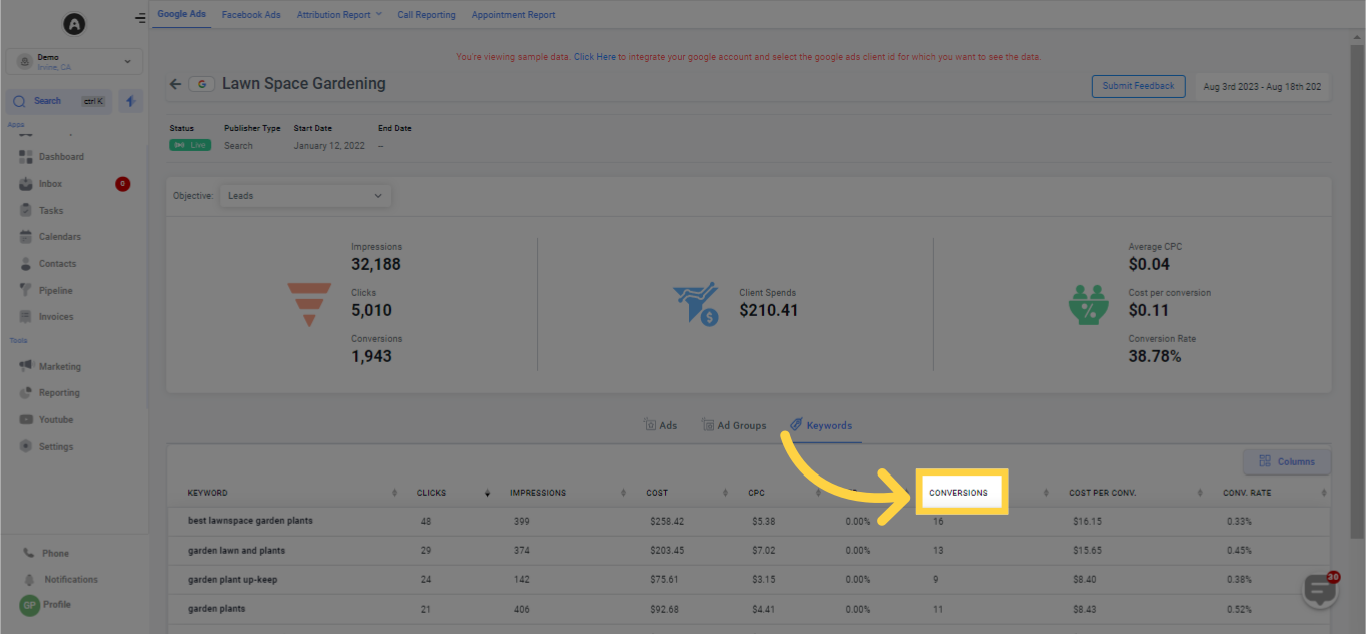
Indicates the conversions for each keyword.
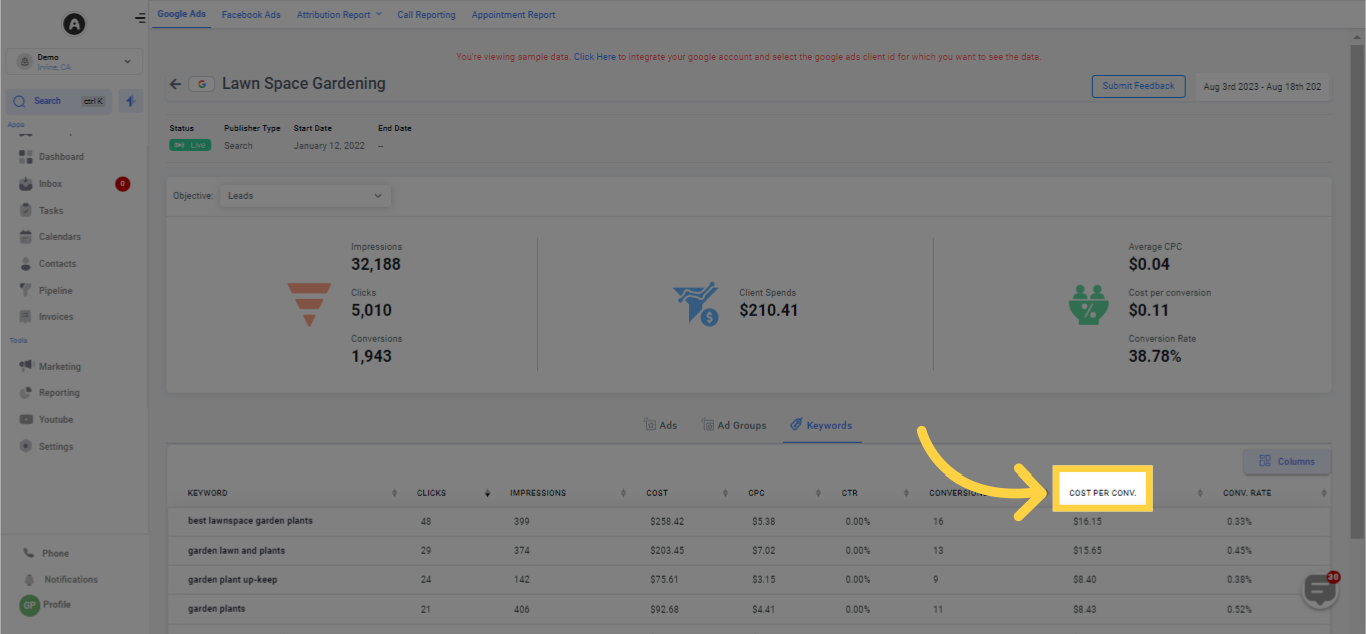
Displays the cost per conversion for each keyword.
Displays the conversion rate as a percentage for each keyword.
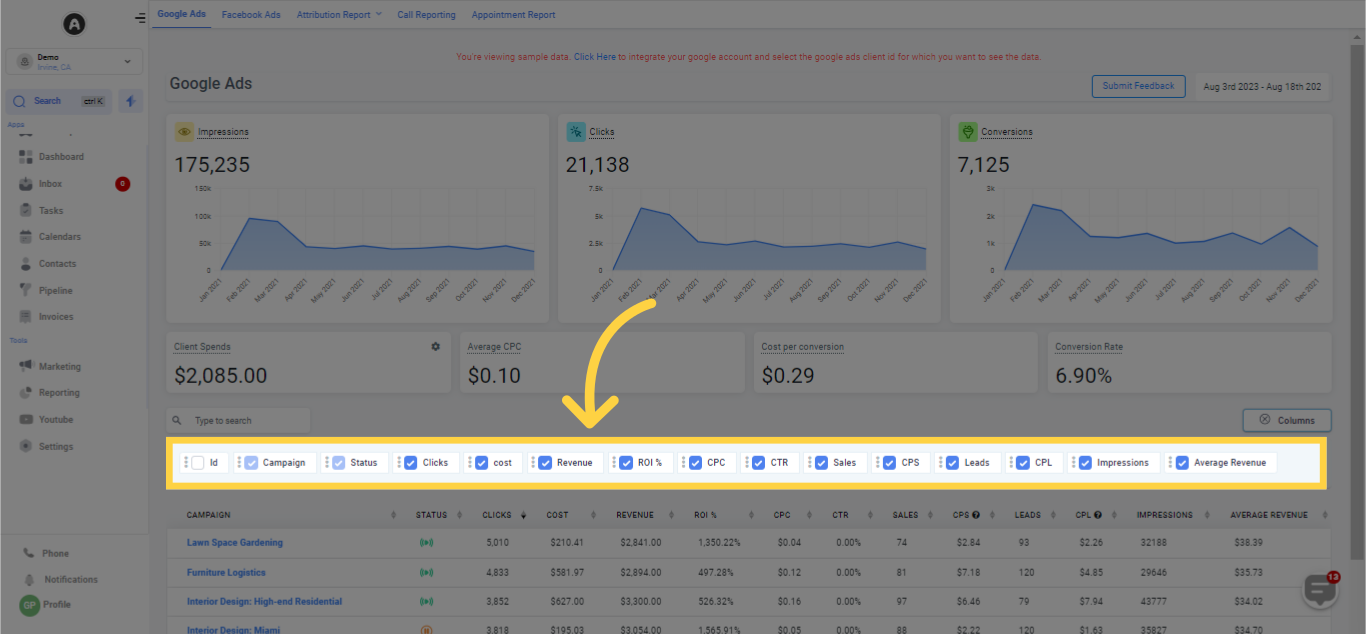
Moreover, within the Columns section, you have the freedom to select or deselect the stats you wish to see displayed in the stats column. This enables you to view only the data that matters to you in your reporting. Choose from ID, campaign, status, clicks, cost, revenue, ROI, CPC, CTR, Sales, CPS, Leads, CPL, Impressions, and Average Revenue.