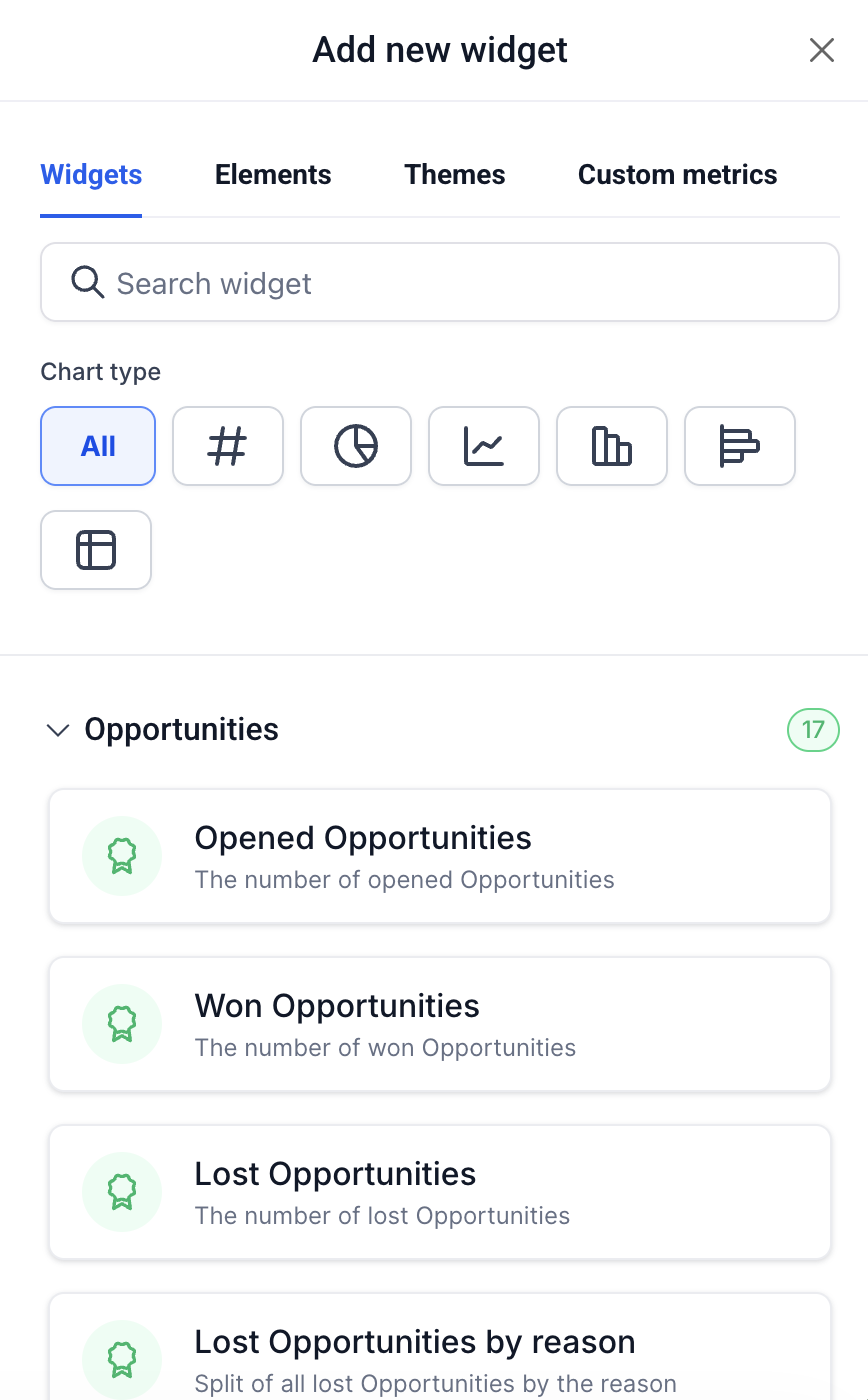
Opportunity widgets let you track and analyze your pipeline directly inside your dashboards and custom reports. From total opportunity counts and revenue trends to lost-reason breakdowns and this-month win rates, these widgets give you a full picture of how prospective patients are moving through consults, treatment plans, and closed sales, without leaving Aesthetix CRM.
Every Opportunity widget supports multiple chart types and can be filtered with conditions to scope results to a specific pipeline, stage, status, assignee, or attribution source.
There are 17 Opportunity widgets available. Each one opens with a default chart type, but you can switch it to any supported chart type from within the widget settings.
# | Widget Name | Default Chart | Metric | What It Shows | Default Filter | Date Scope |
|---|---|---|---|---|---|---|
1 | Opportunity Count | Number | Count | Total number of all opportunities | None | Dashboard date range |
2 | Opened Opportunities | Number | Count | Number of opportunities currently open | Status = Open | Dashboard date range |
3 | Opened Opportunity Value | Number | Sum of monetary value | Combined monetary value of all open opportunities | Status = Open | Dashboard date range |
4 | Won Opportunities | Number | Count | Number of won opportunities | Status = Won | Dashboard date range |
5 | Won Opportunity Value | Number | Sum of monetary value | Combined monetary value of won opportunities | Status = Won | Dashboard date range |
6 | Lost Opportunities | Number | Count | Number of lost opportunities | Status = Lost | Dashboard date range |
7 | Lost Opportunity Value | Number | Sum of monetary value | Combined monetary value of lost opportunities | Status = Lost | Dashboard date range |
8 | Lost Opportunities By Reason | Donut | Count | Breakdown of lost opportunities split by loss reason | Status = Lost | Dashboard date range |
9 | Abandoned Opportunities | Number | Count | Number of abandoned opportunities | Status = Abandoned | Dashboard date range |
10 | Abandoned Opportunity Value | Number | Sum of monetary value | Combined monetary value of abandoned opportunities | Status = Abandoned | Dashboard date range |
11 | Total Opportunity Value | Number | Sum of monetary value | Combined monetary value of all opportunities regardless of status | None | Dashboard date range |
12 | Opportunity Counts by Status | Donut | Count | Distribution of opportunities across all statuses | None | Dashboard date range |
13 | Opportunity Counts Over Time | Line | Count | How opportunity creation trends over a time period | None | Dashboard date range |
14 | Opportunity Revenue Over Time | Line | Sum of monetary value | How opportunity revenue trends over a time period | None | Dashboard date range |
15 | Won Opportunities This Month (For You) | Number | Count | Won opportunities this month assigned to the logged-in user | Status = Won + Assigned User = logged-in user | This month (fixed) |
16 | Won Opportunities Value This Month | Number | Sum of monetary value | Total won revenue this month across your whole team | Status = Won | This month (fixed) |
17 | Won Opportunities Value This Month (For You) | Number | Sum of monetary value | Total won revenue this month for the logged-in user | Status = Won + Assigned User = logged-in user | This month (fixed) |
Note: Widgets #15, #16, and #17 use a fixed date scope (This Month). They do not follow the dashboard's global date range selector unless you change that in Configure.
Note: Widgets #15 and #17 are "For You" widgets. They're scoped to whichever user is currently logged in, via a built-in Assigned User filter. When included in a scheduled report, they reflect the data of the report owner, not the recipient who receives the email.
All 17 Opportunity widgets can be switched to any of these chart types from within widget settings.
Chart Type | Best For |
|---|---|
Number | A single KPI, quick count, or value |
Donut | Distribution or breakdown by category (for example, by status or by lost reason) |
Bar | Comparing values across categories |
Line | Trends over time |
Horizontal Bar | Comparing many categories with long labels |
Table | Detailed row-level breakdown |
Widgets that support a breakdown dimension can be grouped by the fields below. Grouping is available on widgets #8, #12, #13, and #14 (Lost Opportunities By Reason, Opportunity Counts by Status, Opportunity Counts Over Time, and Opportunity Revenue Over Time).
Group By Option | What It Groups By |
|---|---|
Status | Open, Won, Lost, or Abandoned |
Assignee | The team member assigned to each opportunity |
Followers | Team members following the opportunity |
Source | The source field on the opportunity record |
Pipeline | The pipeline the opportunity belongs to |
Stage | The stage within the pipeline |
Lost Reason | The reason recorded when the opportunity was marked Lost |
Session Source | Session-level traffic channel (for example, Organic Search or Paid Social) |
Medium | Attribution medium (for example, Form, Facebook, or Calendar) |
Tip: Combine Group By with a Status condition to go deep. For example, set Status = Lost as a filter, then Group By Lost Reason to see exactly where prospective patients are falling off.
Opportunity widgets can be measured against three different date fields. The date property you choose determines which timestamp gets used when the dashboard date range is applied.
Date Property | Description |
|---|---|
Created On | When the opportunity was created (the default for most widgets) |
Updated On | When the opportunity record was last modified |
Status Change | When the opportunity's status last changed (for example, when it was marked Won or Lost) |
Important, Status Change date caveat: The Status Change date reflects the most recent status change, not when the opportunity originally entered a given status. If an opportunity is reopened after being marked Lost, the Status Change date resets. This means historical dashboard figures based on Status Change can drift over time. For stable historical reporting, use Created On and filter by Status instead.
Every Opportunity widget supports filtering through Conditions in the widget settings panel. Conditions let you scope a widget to a specific subset of opportunities, for example, only opportunities in a specific pipeline, or only those lost with a particular reason.
There are 24 condition fields available, split into standard fields and attribution fields.
Condition Field | Data Type | Available Operators | Value Input | Notes |
|---|---|---|---|---|
Status | Enum | Is / Is not / Is one of / Is none of | Open / Won / Lost / Abandoned | Setting Status = Lost unlocks the Lost Reason child field |
Assigned User | Enum | Is / Is not / Is one of / Is none of / Is empty / Is not empty | User/reference lookup | |
Followers | Enum | Is / Is not / Is one of / Is none of / Is empty / Is not empty | User/reference lookup | |
Business Name | String | Is / Is not / Is empty / Is not empty | Text input | |
Tags | Enum | Is / Is not / Is one of / Is none of / Is empty / Is not empty / Is all of | User/reference lookup | |
Primary Contact Name | Enum | Is / Is not / Is one of / Is none of / Is empty / Is not empty | User/reference lookup | |
Pipeline | Enum | Is / Is not / Is one of / Is none of | User/reference lookup | Setting a Pipeline value unlocks the Stage child field |
Lead Value | Number | Is / Is not / Is more than / Is more than equal to / Is less than / Is less than equal to / Is empty / Is not empty | Number input | |
Lost Reason | Enum (dependent) | Is / Is not / Is one of / Is none of / Is empty / Is not empty | User/reference lookup | Requires Status = Lost to be set first |
Stage | Enum (dependent) | Is / Is not / Is one of / Is none of | User/reference lookup | Requires a Pipeline to be selected first |
Source | Enum | Is / Is not | Text input | |
Custom Fields | Custom (varies by field type) | Varies by custom field type | User/reference lookup |
Attribution filters unlock additional sub-filters once the parent Attribution field is set. Select either First Attribution or Latest Attribution first, and the child fields below become available.
Condition Field | Parent Required | Available Operators | Value Input |
|---|---|---|---|
Attribution | (none) | Is | First Attribution / Latest Attribution |
Medium | Attribution | Is / Is not / Is one of / Is none of | Form / Survey / Calendar / Chat Widget / CSV Import / Manual / API / Order Form / Two Step Order Form / Facebook / TikTok / Membership / Conversation / Zapier / Other |
Session Source | Attribution | Is one of / Is none of | Direct Traffic / Organic Search / Paid Search / Social Media / Paid Social / Referral / Third Party / CRM UI / Email Marketing / Trigger Links / Other |
UTM Medium | Attribution | Contains | Text input |
UTM Source | Attribution | Contains | Text input |
UTM Campaign | Attribution | Contains | Text input |
UTM Campaign ID | Attribution | Is / Is not | Text input |
UTM Keyword | Attribution | Contains | Text input |
UTM Content | Attribution | Contains | Text input |
UTM Matchtype | Attribution | Contains | Text input |
UTM Ad ID | Attribution | Is / Is not | Text input |
UTM Ad Group ID | Attribution | Is / Is not | Text input |
How Attribution filtering works:
In the Conditions panel, set Attribution to either First Attribution or Latest Attribution.
Once set, Medium, Session Source, and all UTM fields become available.
All child fields apply against the touchpoint you selected (first or latest).
If you use Session Source or Medium in the Group By or View By dropdown, only one compound filter group is allowed, and it must include the Attribution Type. Adding multiple filter groups disables attribution-based fields in the dropdown.
For a deeper walkthrough of how attribution is captured across a patient's journey (first touch vs. latest touch, session sources, UTM tracking), see the attribution guides in Essential Guides. This article covers only how attribution shows up as filters on Opportunity widgets.
All 17 Opportunity widgets are available in both surfaces:
Dashboards, for always-on pipeline monitoring and daily check-ins
Custom Reports, for scheduled delivery and client-ready exports
For how to add, resize, and configure any widget, see the Dashboard Widgets overview and the Customizing Dashboard Widgets guide. Those guides cover the shared widget mechanics; this guide is the full reference for what each Opportunity widget specifically measures.
What is the difference between "Won Opportunity Value" and "Won Opportunities Value This Month"? "Won Opportunity Value" follows the dashboard's global date range, so it shows won revenue for whatever period you've selected. "Won Opportunities Value This Month" always shows the current calendar month, regardless of the dashboard date range selector.
Why do my Won/Lost numbers change when I look back at last month? If you're using Status Change as the date property, this is expected. Status Change reflects the most recent status change on the record, so reopened or re-lost opportunities update the date retroactively. Use Created On as the date property and filter by Status for stable historical counts.
Can I see opportunities broken down by pipeline stage? Yes. Use Opportunity Counts by Status or Opportunity Counts Over Time, then set Group By to Stage. To scope to a specific pipeline first, add a Pipeline condition filter.
What does "Lost Opportunities By Reason" show if no lost reason was recorded? Opportunities marked Lost without a reason recorded appear as a blank or "None" segment in the donut. To keep this widget clean, make Lost Reason a required field in your pipeline settings.
How do the "For You" widgets behave for team members with different pipelines? "For You" widgets filter by the logged-in user's Assigned User value and aggregate across all pipelines by default. Add a Pipeline condition to scope further.
Can I filter Opportunity widgets by a specific pipeline stage without selecting the pipeline first? No. Stage is a dependent field: it requires a Pipeline to be selected first in the Conditions panel. Once a pipeline is selected, the stages within it become available.
Do Opportunity widgets work with Quick Filters on the dashboard? Yes. Dashboard-level Quick Filters apply on top of any widget-level Conditions. If a widget has Status = Won set as a condition, a Quick Filter for Assignee narrows it further to won opportunities for that assignee.
Can I use Opportunity widgets to track how many consults turned into booked treatments? Yes. Combine an Opportunity Count or Won Opportunities widget with a Pipeline condition scoped to your consult pipeline, then compare it against Won Opportunities in your treatment-sales pipeline to see conversion from consult to sale.