SLA Widgets bring dedicated service-level analytics into your practice Dashboard and Custom Reports, right alongside your other Conversations metrics. They give your front desk managers and practice leadership a clear picture of how quickly your team is responding to patients and prospective patients across every channel, and where response times are slipping.
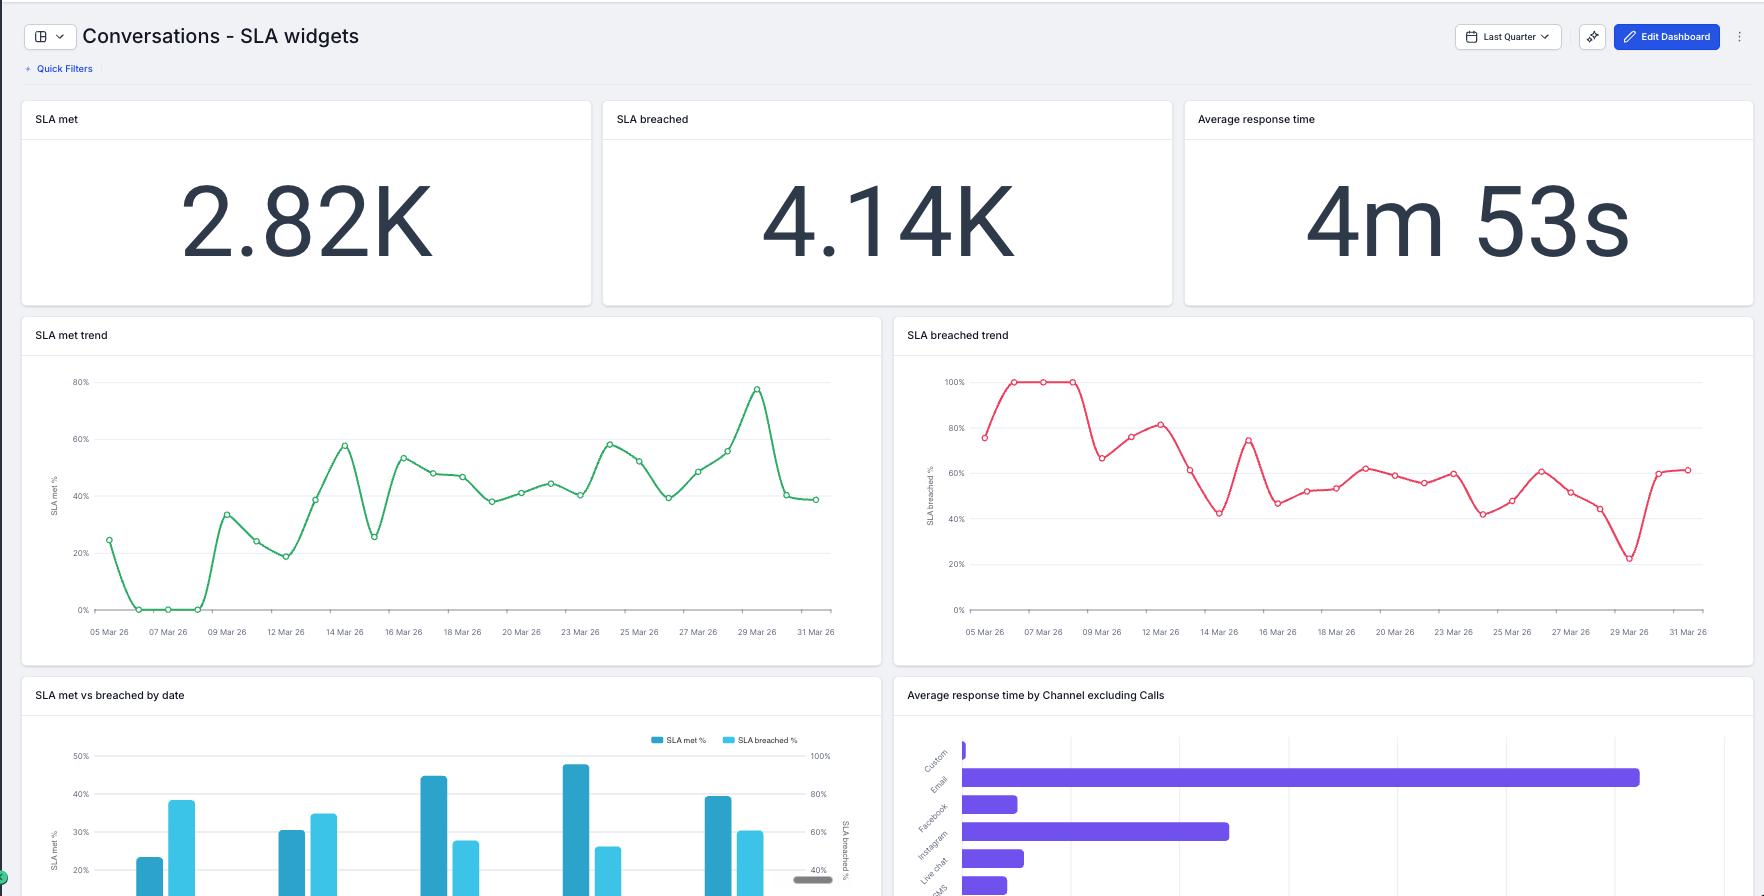
SLA Widgets are pre-built visual reporting blocks that surface service-level agreement (SLA) data directly inside any Dashboard or Custom Report in Aesthetix CRM. They live inside the Conversations widget section, alongside your existing volume, assignment, and channel widgets, so you can see SLA health in the same view where you already track conversation activity.
There are four dedicated widgets covering SLA met trend, SLA breached trend, average response time trend, and SLA performance by team member. Together they let you build a full SLA health view in minutes.
Monitor SLA health at a glance. See SLA met and breached percentages as numeric KPIs or trend lines without digging through Conversations manually.
Catch breach patterns early. The SLA breached trend surfaces the time periods where your team fell behind, so managers can investigate causes before a patient's experience is affected.
Track response speed over time. Average response time trend shows whether your team is getting faster or slower across any date range, by day, week, or month.
Hold your team accountable by person. SLA performance compares met and breached rates across users so managers have a data-backed view of individual performance.
Filter by channel. Segment SLA data by message channel (Call, SMS, Email, Web chat, Facebook, GMB, Instagram) to understand where response-time pressure is coming from.
Build precise KPIs with Custom Metrics. Combine SLA met and SLA breached counts in the formula builder to create metrics like an SLA Compliance Rate.
Dashboards & Reports access: confirm the team member has permission to view or edit dashboards, and to create or schedule Custom Reports.
SLA must be enabled in your account before any SLA widget will show data. To enable it, go to Conversations > Settings > SLA and turn it on. If SLA is not configured, every widget returns 0 and shows no data. This is expected behavior, not a bug.
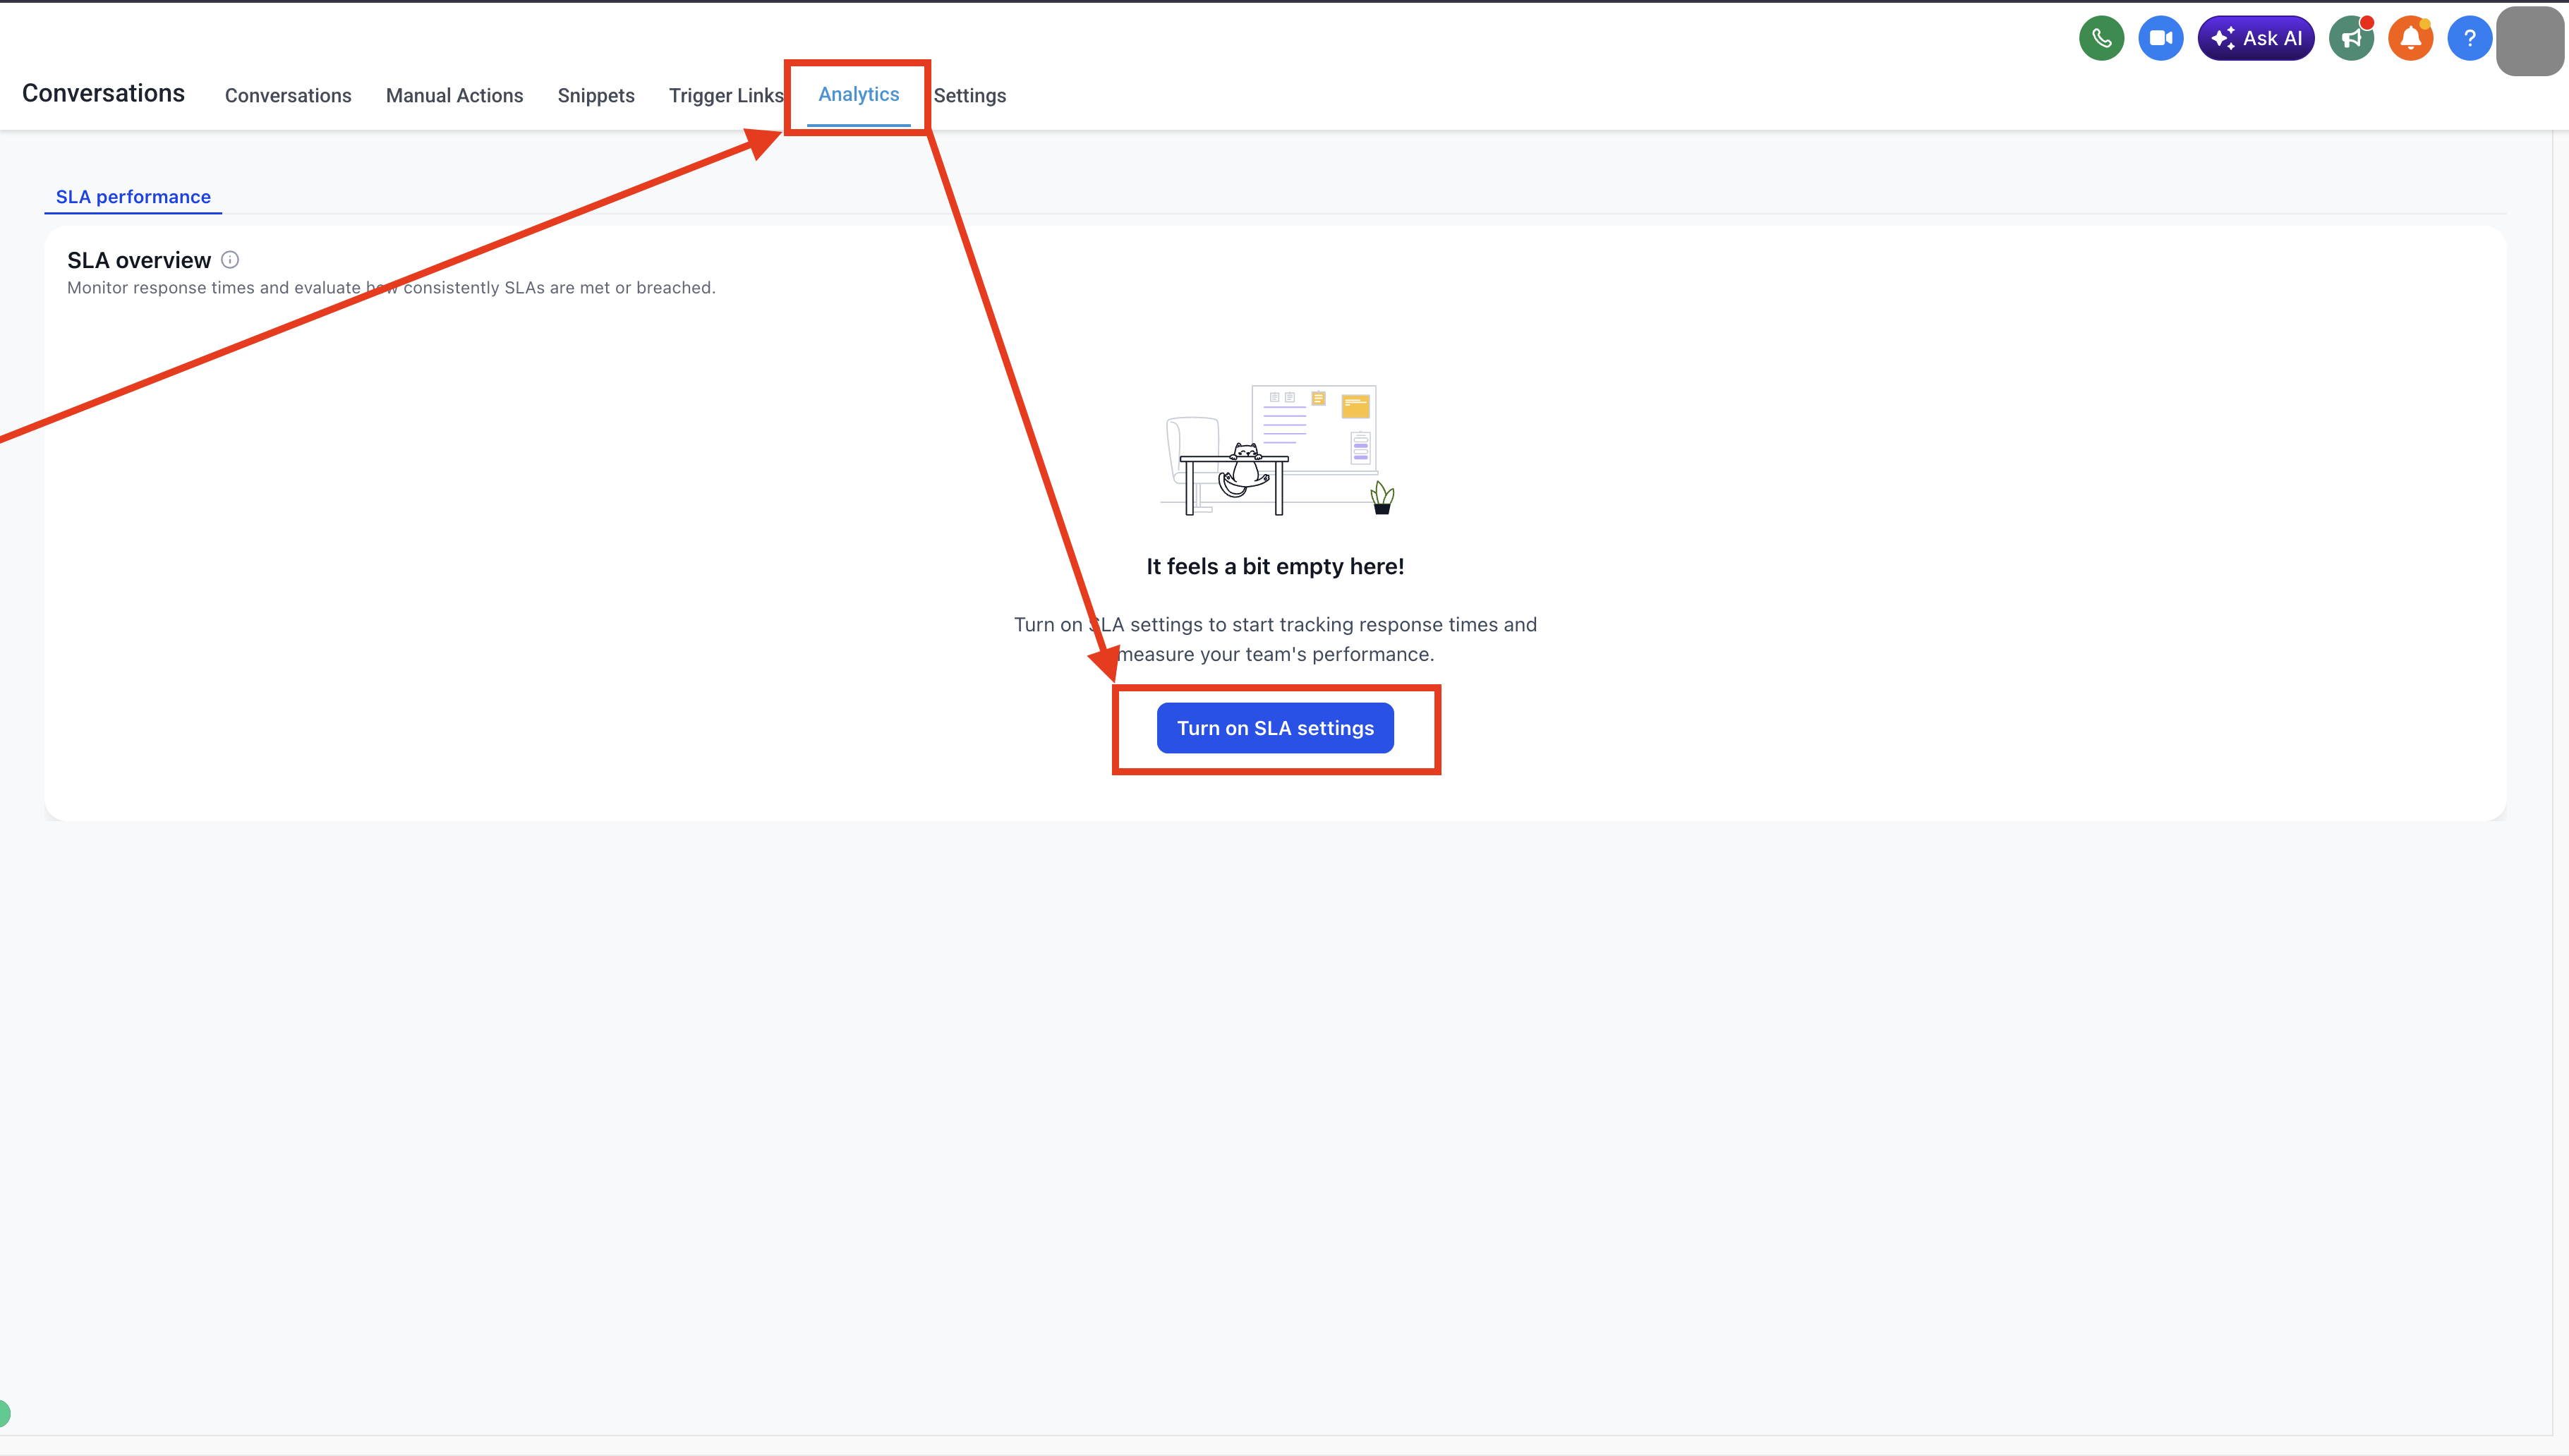
SLA Widgets are limited to a 1-year date range. All widgets on a dashboard, including SLA widgets, follow the Dashboard Date Range set at the top of the page.
Four SLA widgets are available, each configurable with its own chart type, conditions, and theme.
SLA met trend: percentage of conversations that met SLA targets over time. View by day, week, or month. Break down by Inbound at, Assigned user, or Message channel.
SLA breached trend: percentage of conversations that breached SLA thresholds over time. Useful for identifying problem periods and tracking improvement after changes.
Average response time trend: how average first response time is trending over the selected date range, viewable by day, week, or month.
SLA performance: SLA met and breached rates compared across users and message channels. Use this to benchmark team members and see where extra support is needed.
Both environments use the same four SLA widgets. Choose based on how you need to view and share the data.
Dashboard: best for always-on monitoring. Widgets live on your practice Dashboard and update automatically. Place SLA widgets alongside your existing Conversations, Email, and SMS widgets for a full communication health view.
Custom Reports: best for scheduled delivery to practice leadership. Add SLA widgets to a report layout and schedule automatic email delivery on a daily, weekly, or monthly cadence.
In your account, navigate to Dashboards and open the dashboard you want to edit (or create a new one).
Click Edit Dashboard in the top right corner.
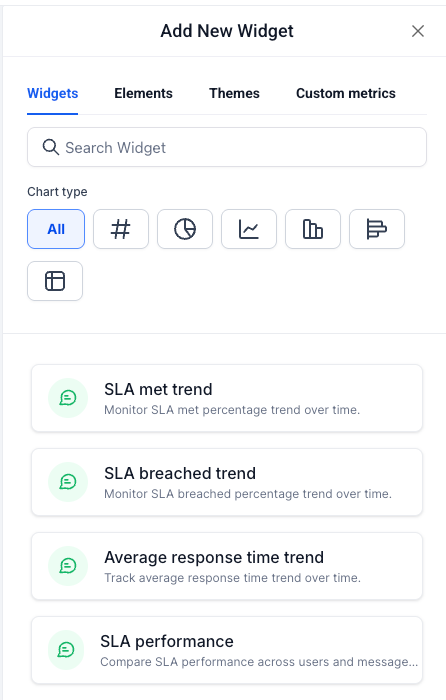
Click + Add Widget. The widget panel opens on the right side.
Scroll down to the Conversations section. The four SLA widgets are listed at the bottom, below New Conversations started.
Click the widget you want to add. It is placed on your dashboard canvas.
Configure the widget using the Configure and Conditions tabs (see below).
Click Save Changes to publish the widget to your dashboard.
Tip: add SLA met trend and SLA breached trend side by side for a quick SLA health view. Pair them with the numeric SLA met and SLA breached widgets at the top of the dashboard for an at-a-glance summary.
In your account, go to Reporting > Custom Reports and open an existing report or click New Report.
Choose to start from a blank canvas, use a template, or import an existing dashboard layout.
Click Add Widget / Element in the top left of the report builder.
Scroll to the Conversations section and drag the SLA widgets you want into your report layout.
Configure each widget using the Configure and Conditions tabs.
Click Save.
Click Send or Schedule to set up automatic email delivery of the report.
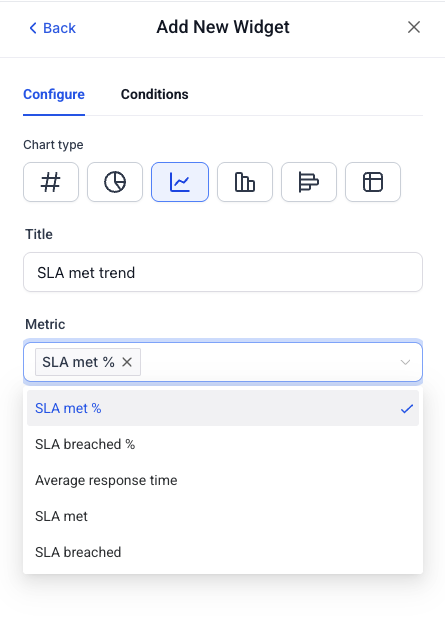
Each SLA widget has a Configure tab and a Conditions tab in the Edit Widget panel.
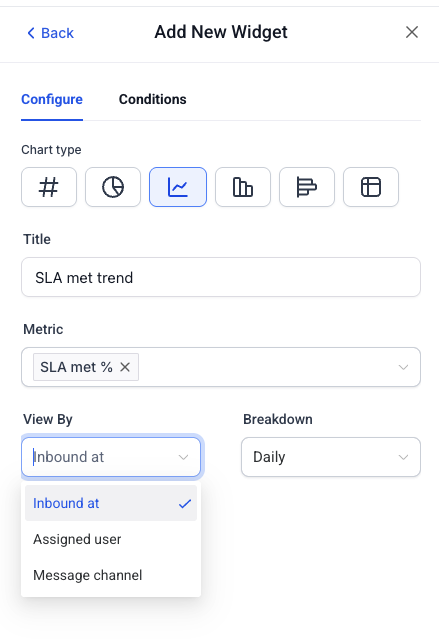
The Configure tab controls how the widget looks, which metric it displays, and how data is grouped.
Chart type: choose from Numeric (#), Donut, Line, Bar, Horizontal Bar, or Table. Availability varies by widget.
Title: rename the widget to suit your dashboard or the audience viewing it.
Metric: select from SLA met %, SLA breached %, Average response time, SLA met (count), or SLA breached (count).
View By: controls the primary grouping dimension. Options are Inbound at, Assigned user, or Message channel.
Breakdown: controls the time granularity for trend widgets. Options are Daily, Weekly, or Monthly.
Date range: defaults to the Dashboard Date Range. Override with a custom range if needed. Maximum range is 1 year.
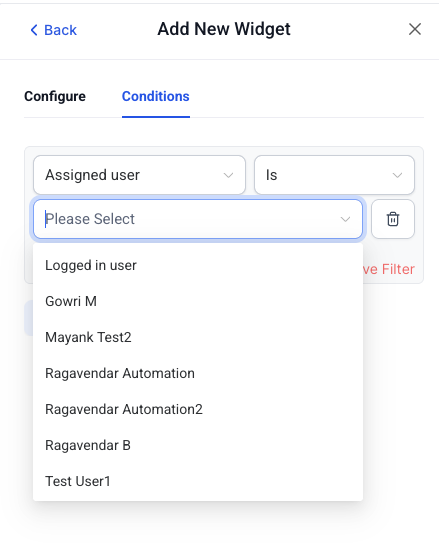
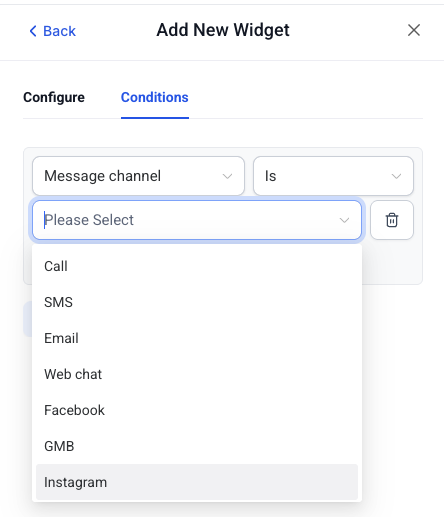
Add filters to control exactly which conversation data the widget displays. Conditions narrow your dataset to specific team members or channels.
Assigned user: logged in user, or any team member in your account. Filter SLA data to a specific team member's conversations.
Message channel: Call, SMS, Email, Web chat, Facebook, GMB, or Instagram. Filter SLA data by the channel the conversation came through.
Match widget colors to your dashboard's look and feel. Select from the available theme presets or customize the colors.
SLA met and SLA breached are already available as dimensions in Custom Metrics. Use them in the formula builder to create KPIs that combine SLA data into a single number.
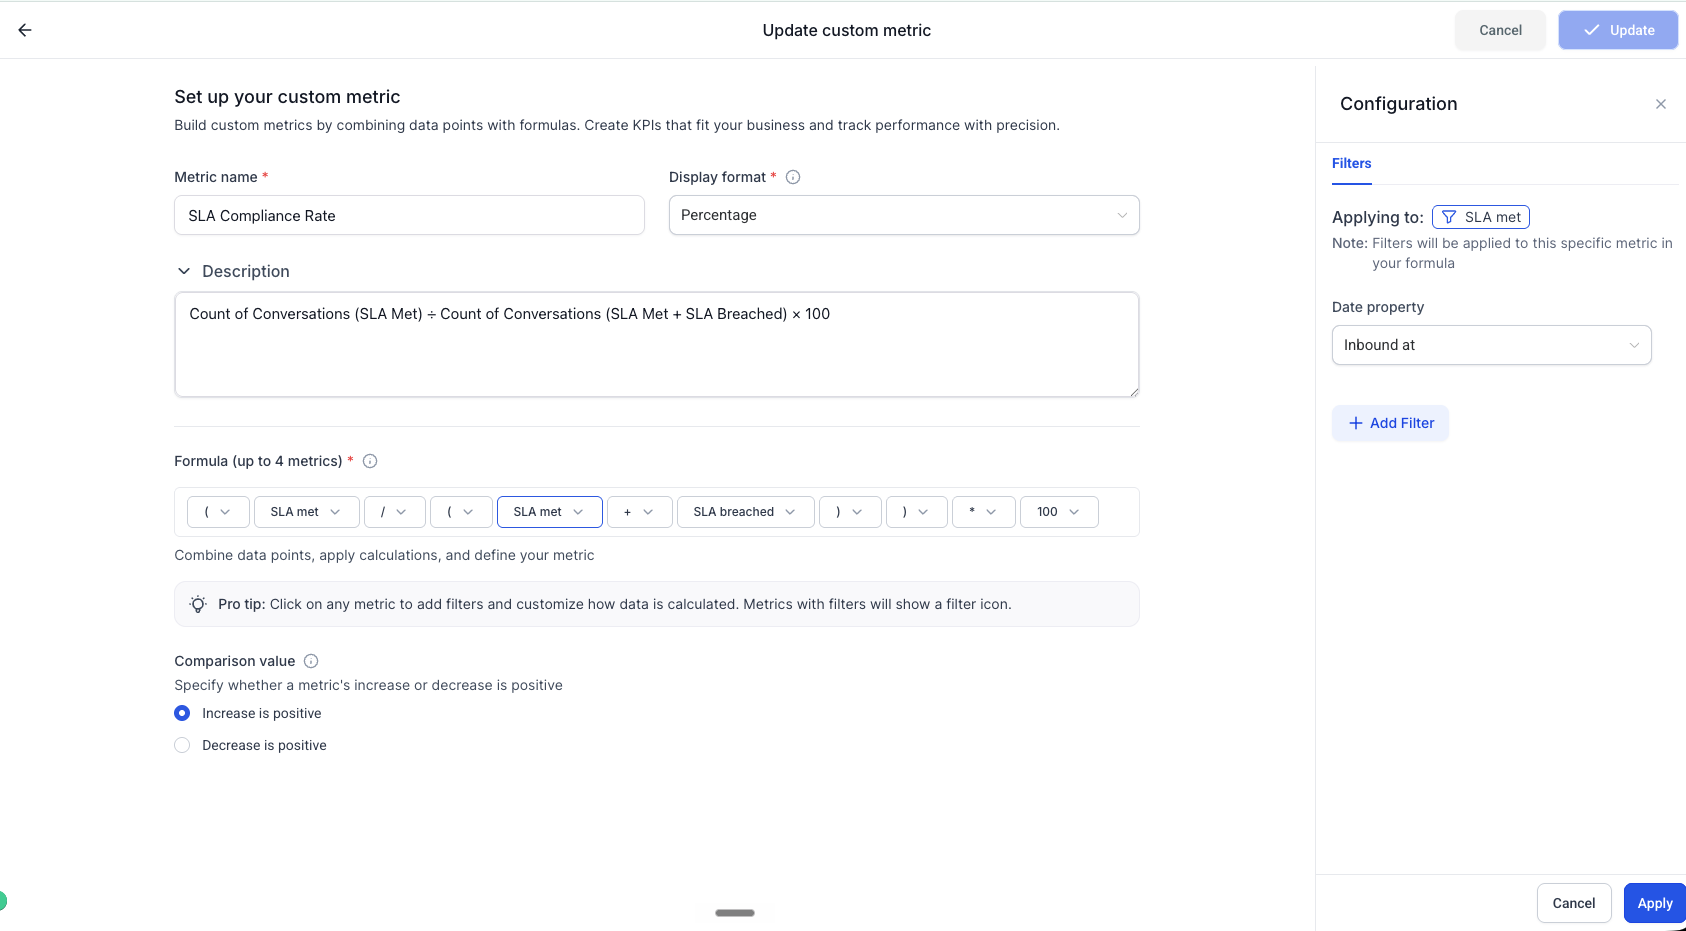
Go to Dashboards > Custom Metrics and click Create Custom Metric.
Set Metric name to SLA Compliance Rate and Display format to Percentage.
In the Formula builder, enter: ( SLA met / ( SLA met + SLA breached ) ) x 100
Click on SLA met in the formula to open the Configuration panel on the right.
Under Filters, set Date property to Inbound at and add any additional filters needed.
Repeat for the SLA breached metric in the formula.
Set Comparison value to Increase is positive, since a higher compliance rate is better.
Click Create.
SLA Compliance Rate: ( SLA met / ( SLA met + SLA breached ) ) x 100
SLA Breach Count: SLA breached, raw count for a period
SLA Met Count: SLA met, raw count for a period
Q: Where are the SLA widgets in the widget panel? They are in the Conversations section, listed at the bottom, below New Conversations started (This Week).
Q: What is the maximum date range for SLA widgets? SLA widgets support a maximum date range of 1 year.
Q: What metrics are available in SLA widgets? SLA met %, SLA breached %, Average response time, SLA met (count), and SLA breached (count).
Q: What are the View By options? Inbound at, Assigned user, and Message channel.
Q: Which message channels can I filter by? Call, SMS, Email, Web chat, Facebook, GMB, and Instagram.
Q: Can I filter SLA data to a specific team member? Yes. Use the Assigned user condition in the Conditions tab and select any team member in your account, or choose Logged in user to show only the current user's conversations.
Q: Can I combine SLA widgets with other Conversations widgets on the same dashboard? Yes. All Conversations widgets, including volume, assignment, channel distribution, and SLA, can be placed on the same dashboard for a unified view.
Q: Can I schedule an SLA report for practice leadership? Yes. Add SLA widgets to a Custom Report and schedule automatic email delivery on a daily, weekly, or monthly cadence.
Q: Is SLA data available in Custom Metrics? Yes. SLA met and SLA breached are available in the Custom Metrics formula builder. Use them to build KPIs like SLA Compliance Rate.
Q: Why is my SLA widget showing no data? The most common cause is that SLA is not enabled for your account. Go to Conversations > Settings > SLA and enable it first. Once enabled, the widgets begin populating with data going forward. Other causes: the selected date range has no SLA activity, the date range exceeds 1 year, or the filters are too narrow.
Q: Which plans include SLA Widgets? SLA Widgets are available on all plans that include Dashboards & Reporting.
