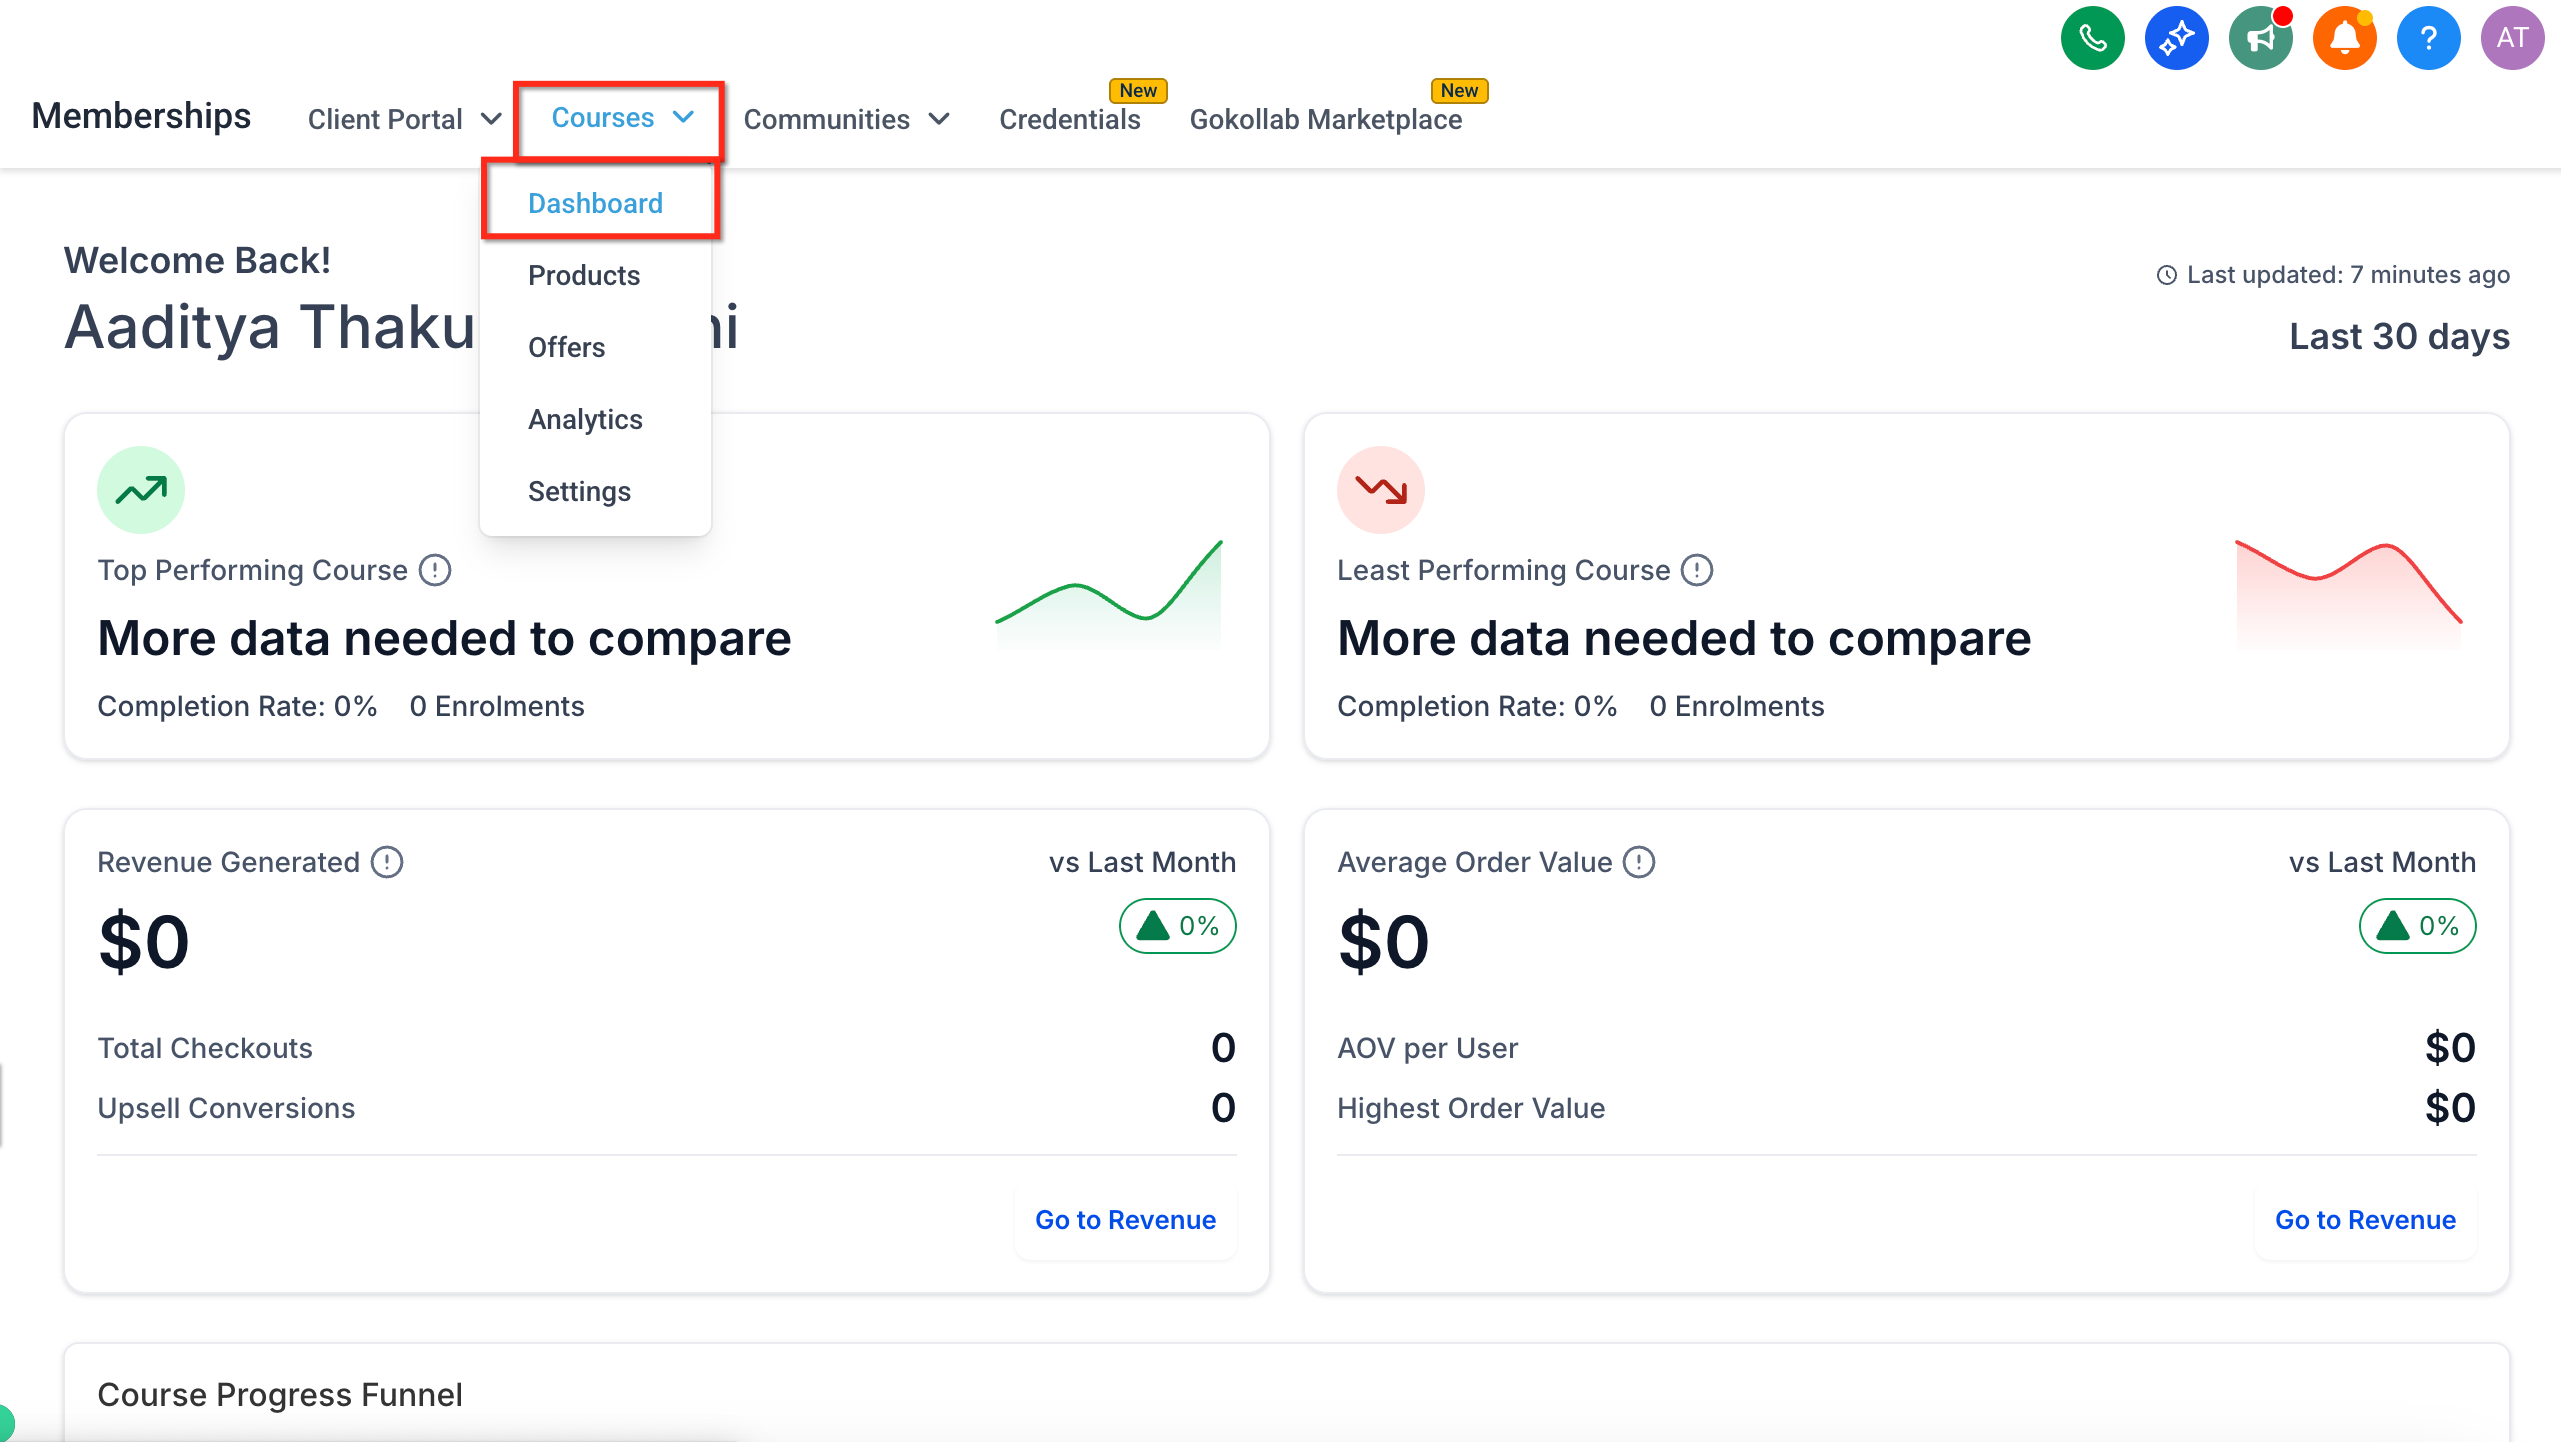
The Courses dashboard gives you a 30-day snapshot of how your memberships, course products, and bundle offers are performing, all in one place. It lives under Marketing > Memberships, and it's the first screen you see when you open Courses.
Click Marketing in the left-hand menu.
Click Memberships.
The dashboard opens automatically for course creators. If you land on another screen instead, click the Dashboard tab at the top.
A dedicated setup isn't required. The dashboard is enabled automatically for every account that has courses, and it pulls in your existing membership and course data the next time you open the section.
A few tips for working with it:
Pin the dashboard to your sidebar for one-click access.
If you want a cleaner view while you're still building out your first courses, use the ••• menu to remove sample data.
Use the Revenue or Funnel cards (below) to jump straight into the deeper analytics pages behind each metric.
Data refreshes every 6 hours, so check back periodically rather than expecting real-time updates.
The dashboard covers the past 30 days and is organized into cards for course performance, revenue, average order value, and learner progress. It also shows your Sites, Previous Memberships, and Next Membership Products, so you can see at a glance what's live and what's coming up.
These cards show which of your courses are doing well and which ones need attention.
Top Performing Course: the course with the highest engagement over the past 30 days.
Least Performing Course: the course with the lowest engagement or completion rate.
Metrics shown: Completion Rate (the percentage of enrolled patients or clients who finished the course) and Enrollments (the total number who signed up).
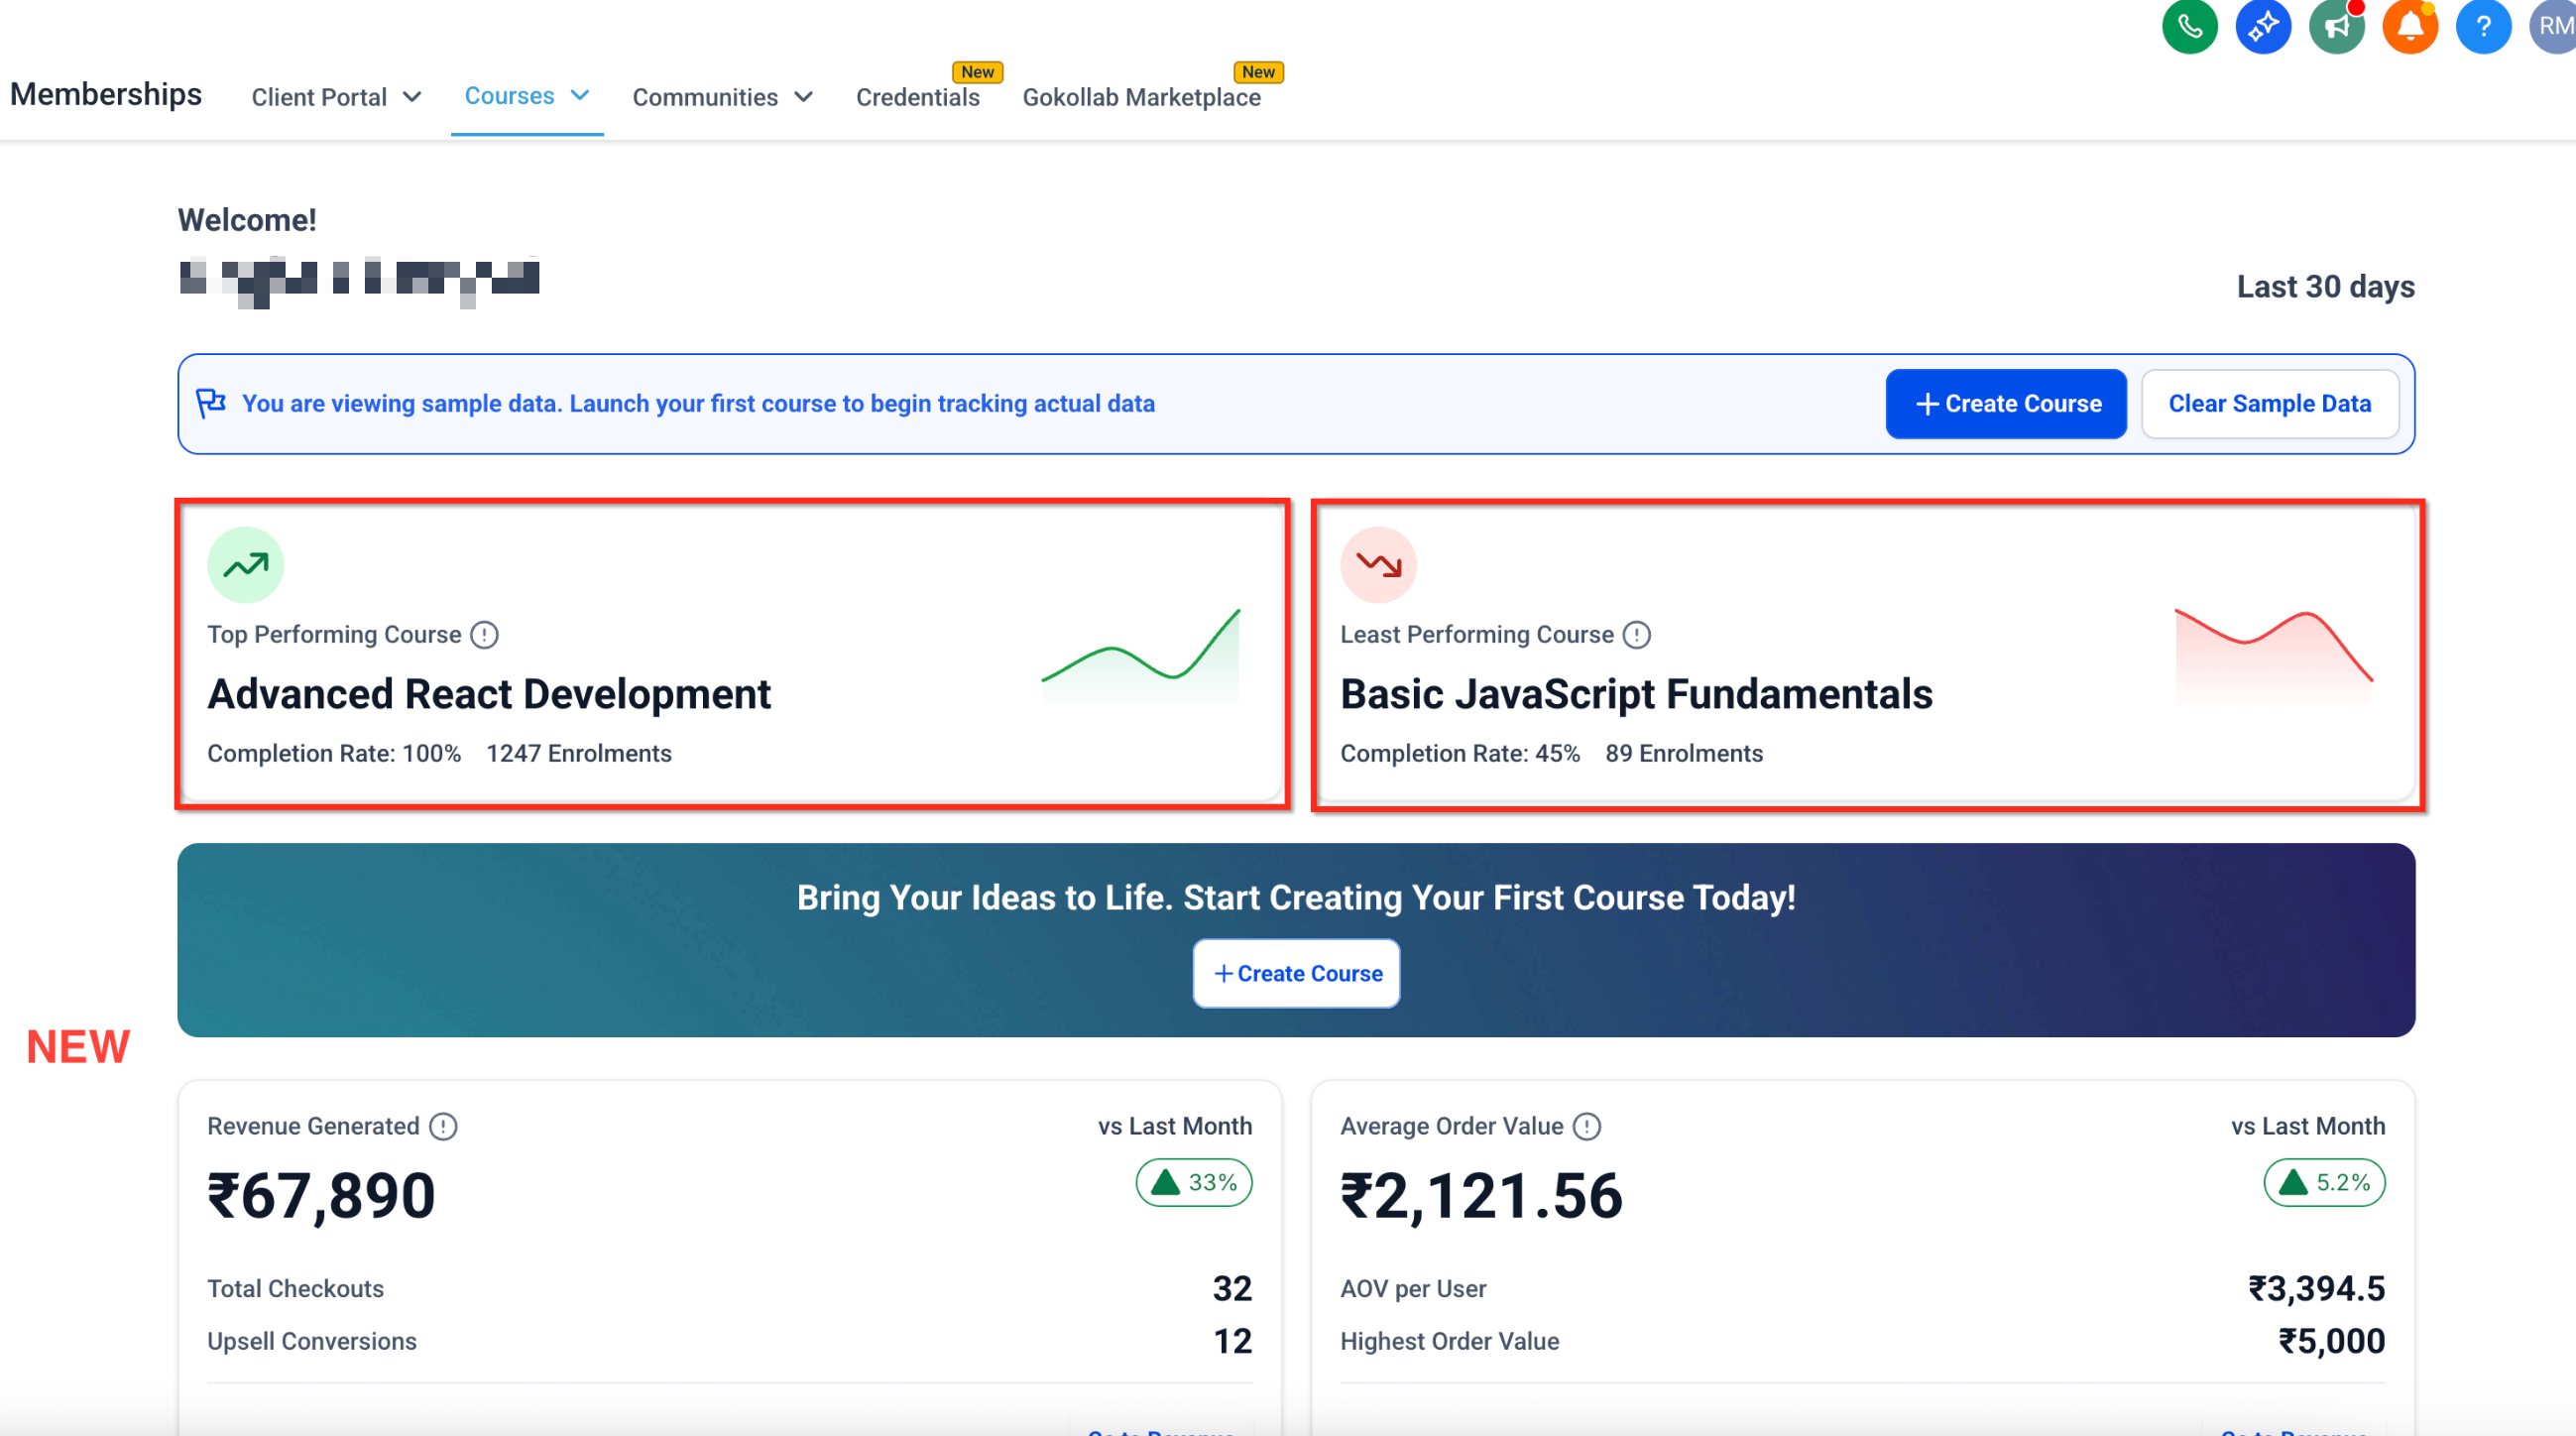
Click a course name to open its Course Details page, where you can dig into engagement, content, and completion performance for that course specifically.
This card gives you a quick read on what your courses are earning.
Revenue Generated ($): total revenue from courses over the last 30 days.
vs Last Month: percentage change compared to the previous month.
Total Checkouts: number of completed purchases.
Upsell Conversions: number of successful upsells made through course offers.
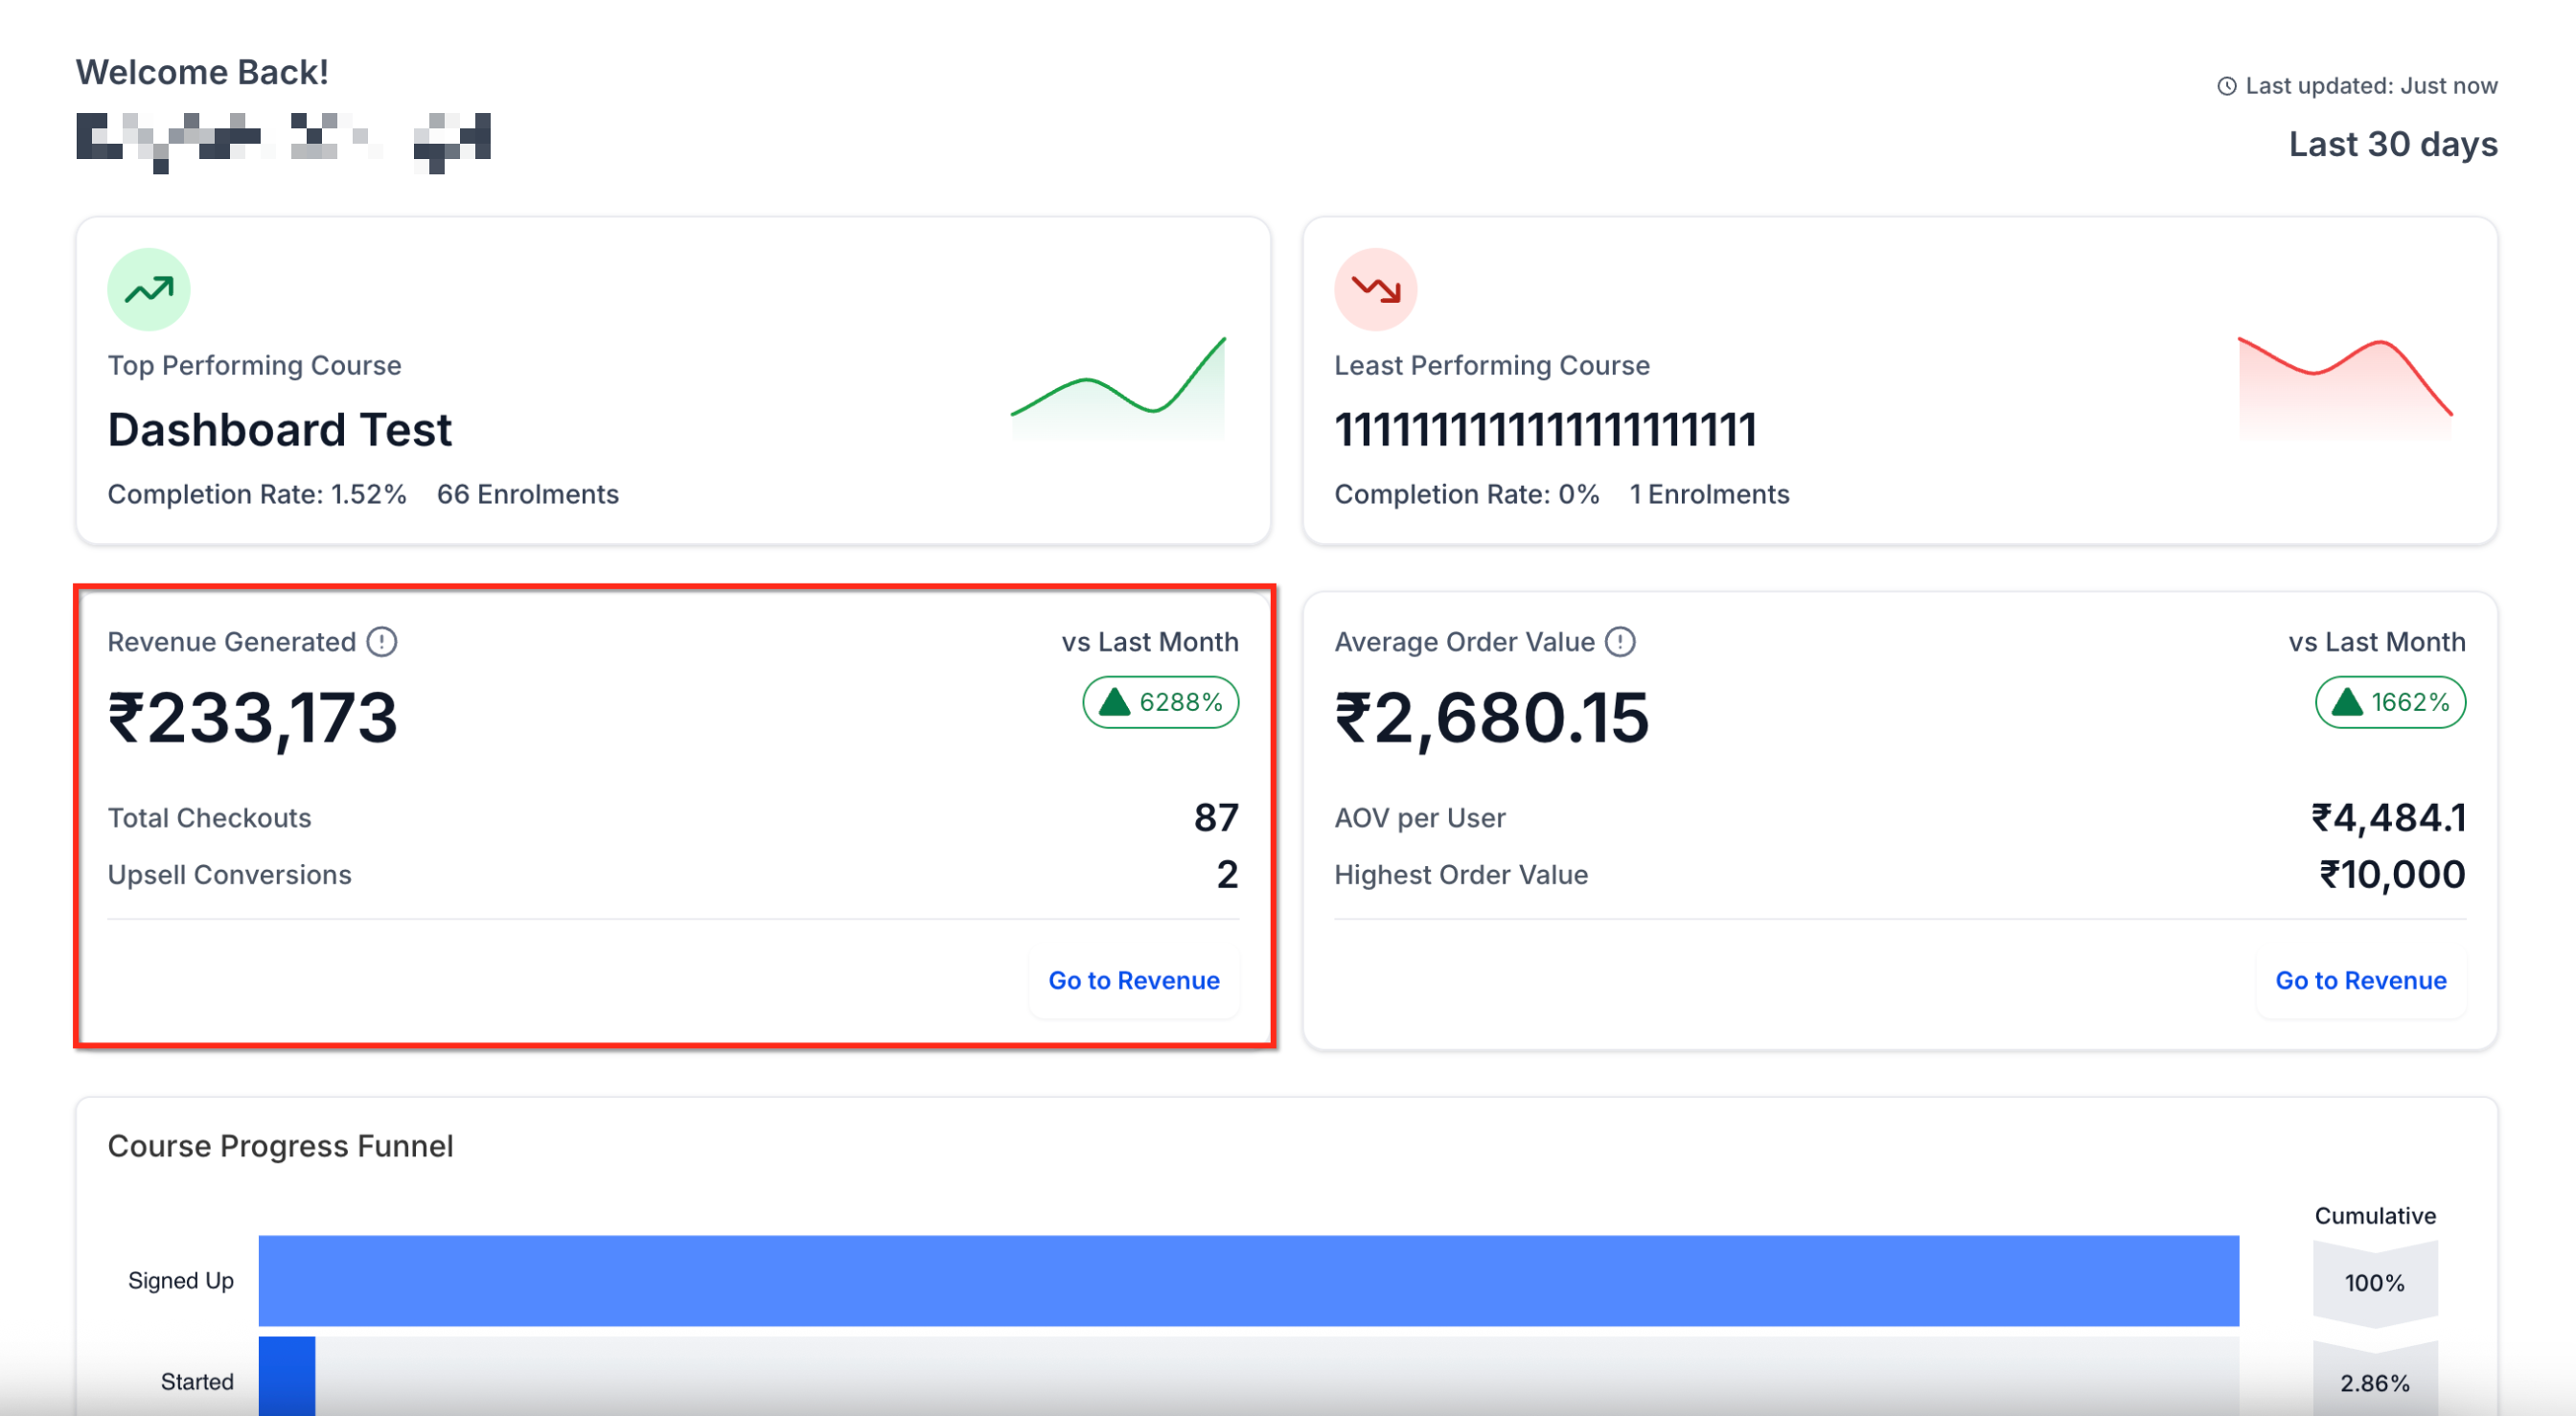
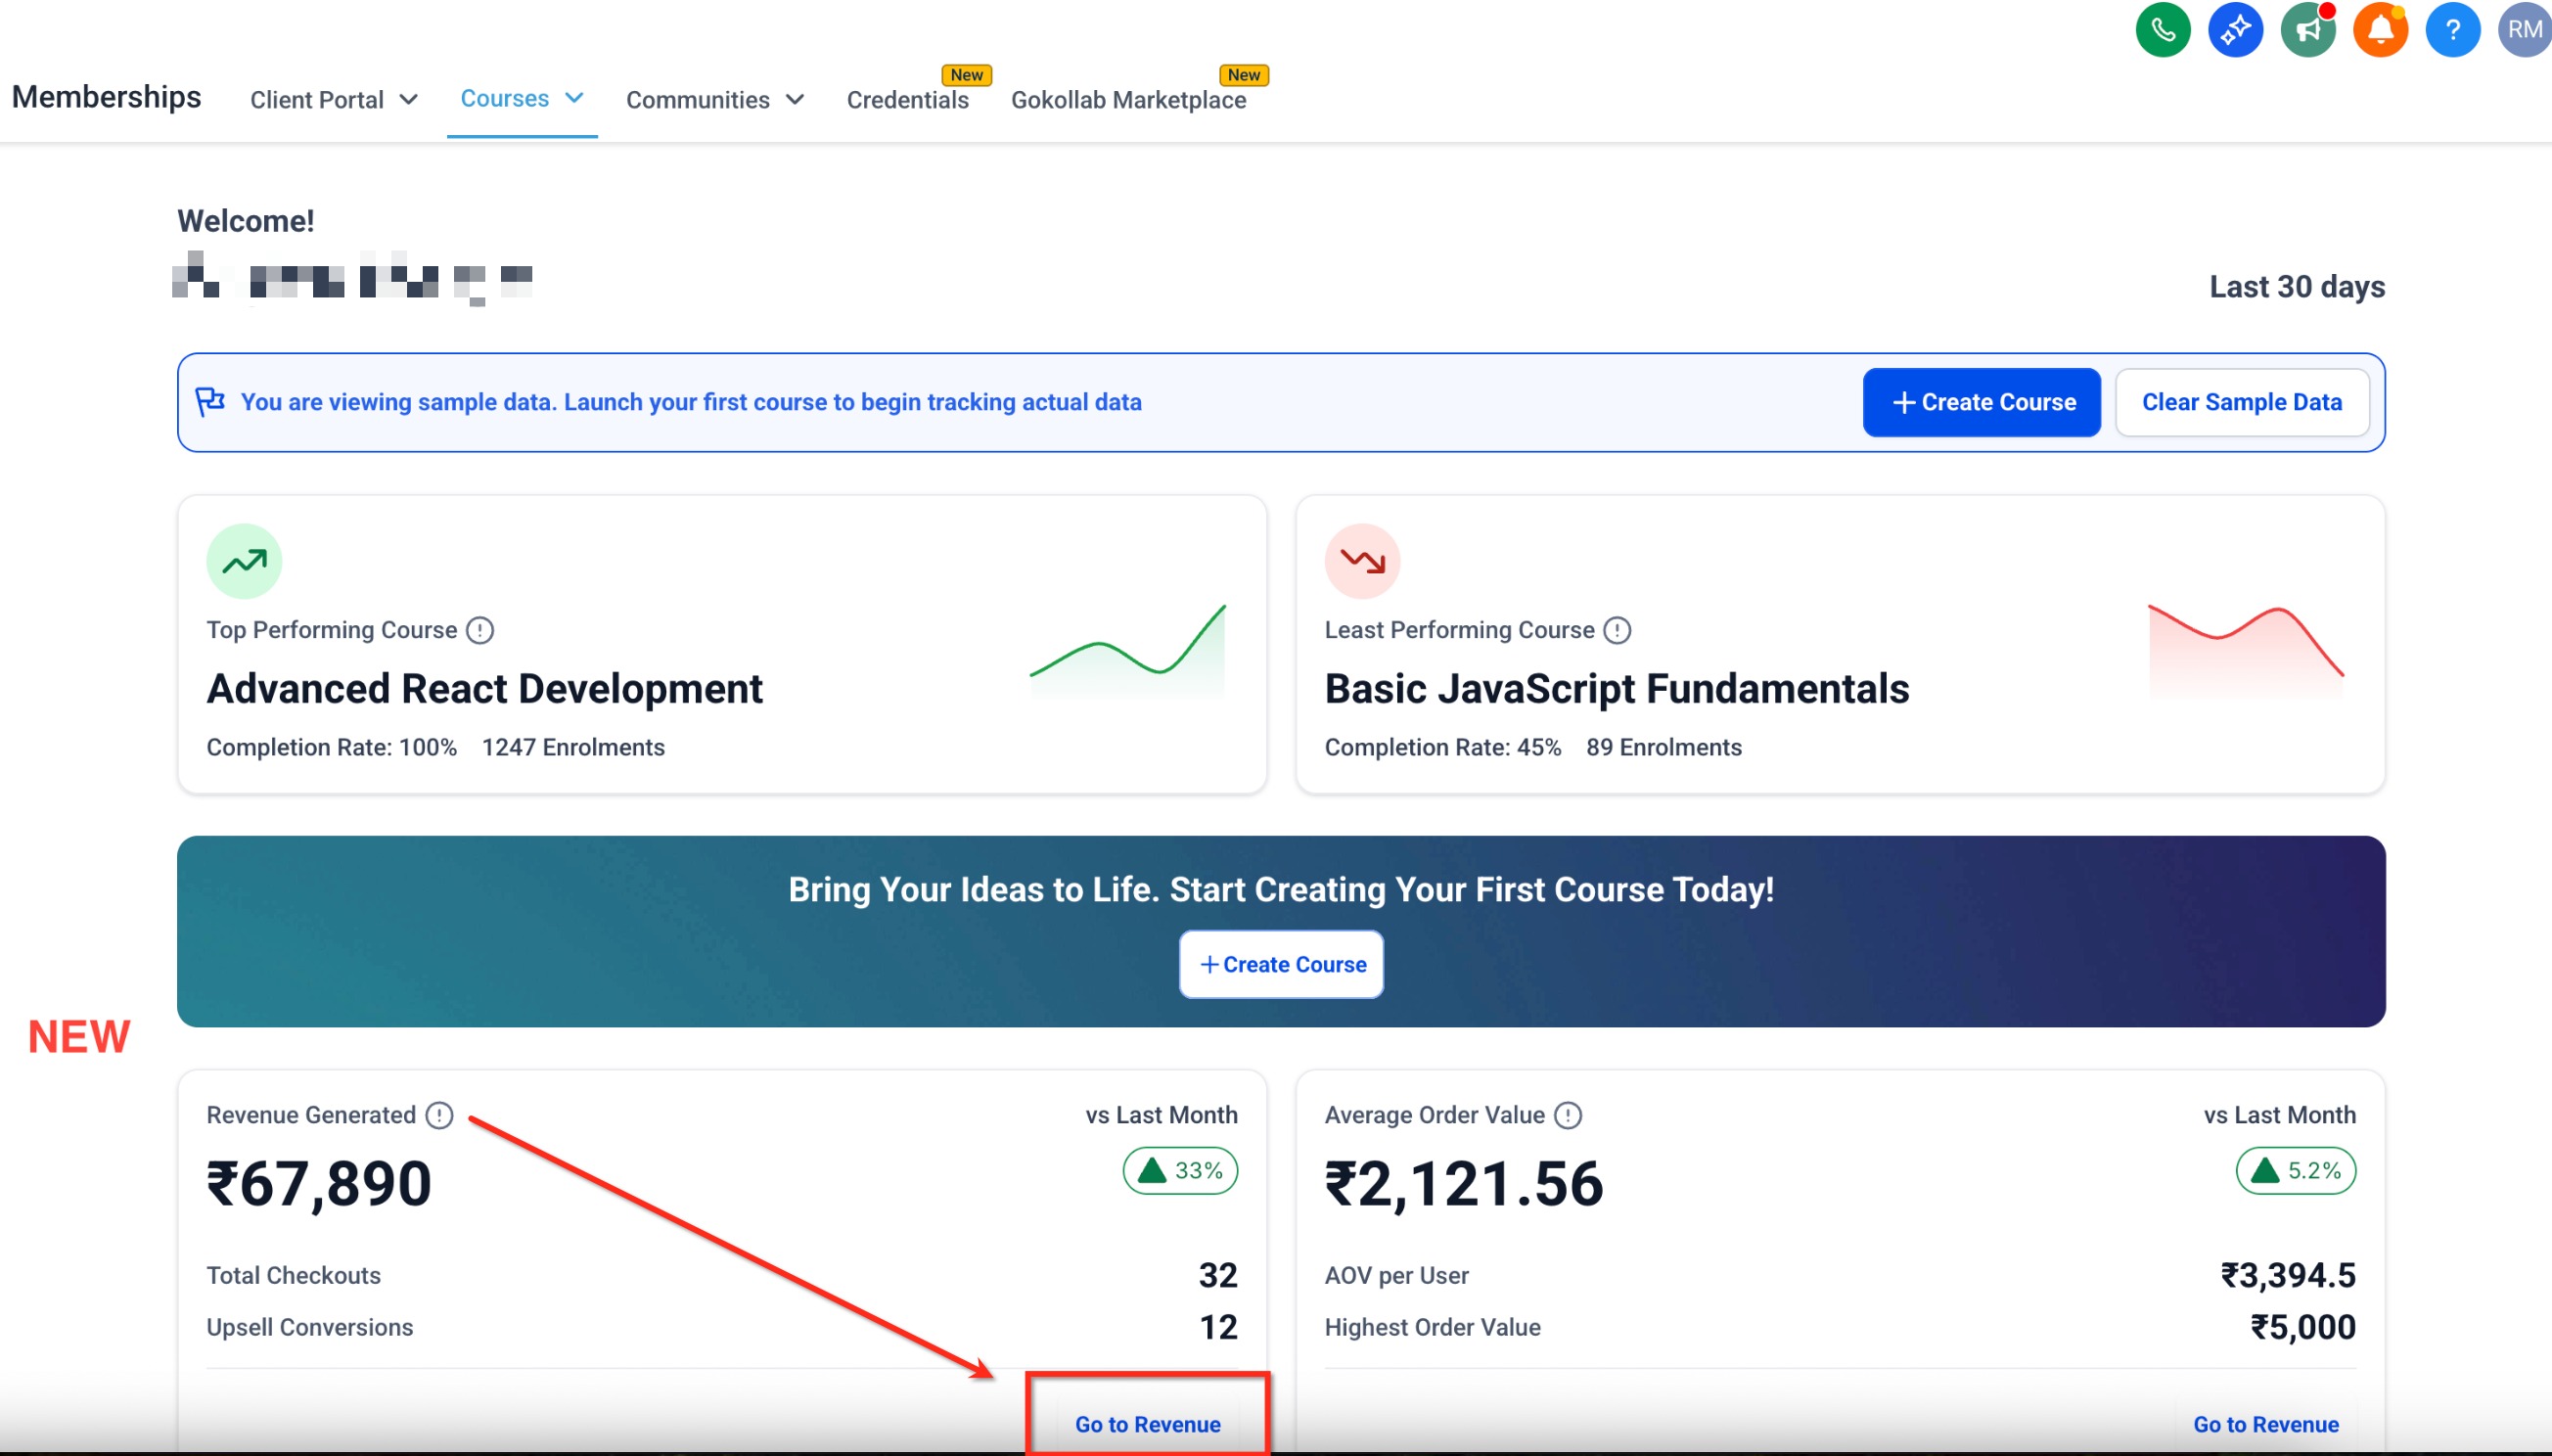
Click Go to Revenue to open detailed revenue analytics, transaction breakdowns, and purchase history.
Tip: If you're selling paid courses or memberships, route checkout through AX Pay, Aesthetix CRM's built-in payment processor. It offers better rates than Stripe and keeps all of your course revenue in the same reporting you already use for the rest of your practice. See the AX Pay help article for setup details.
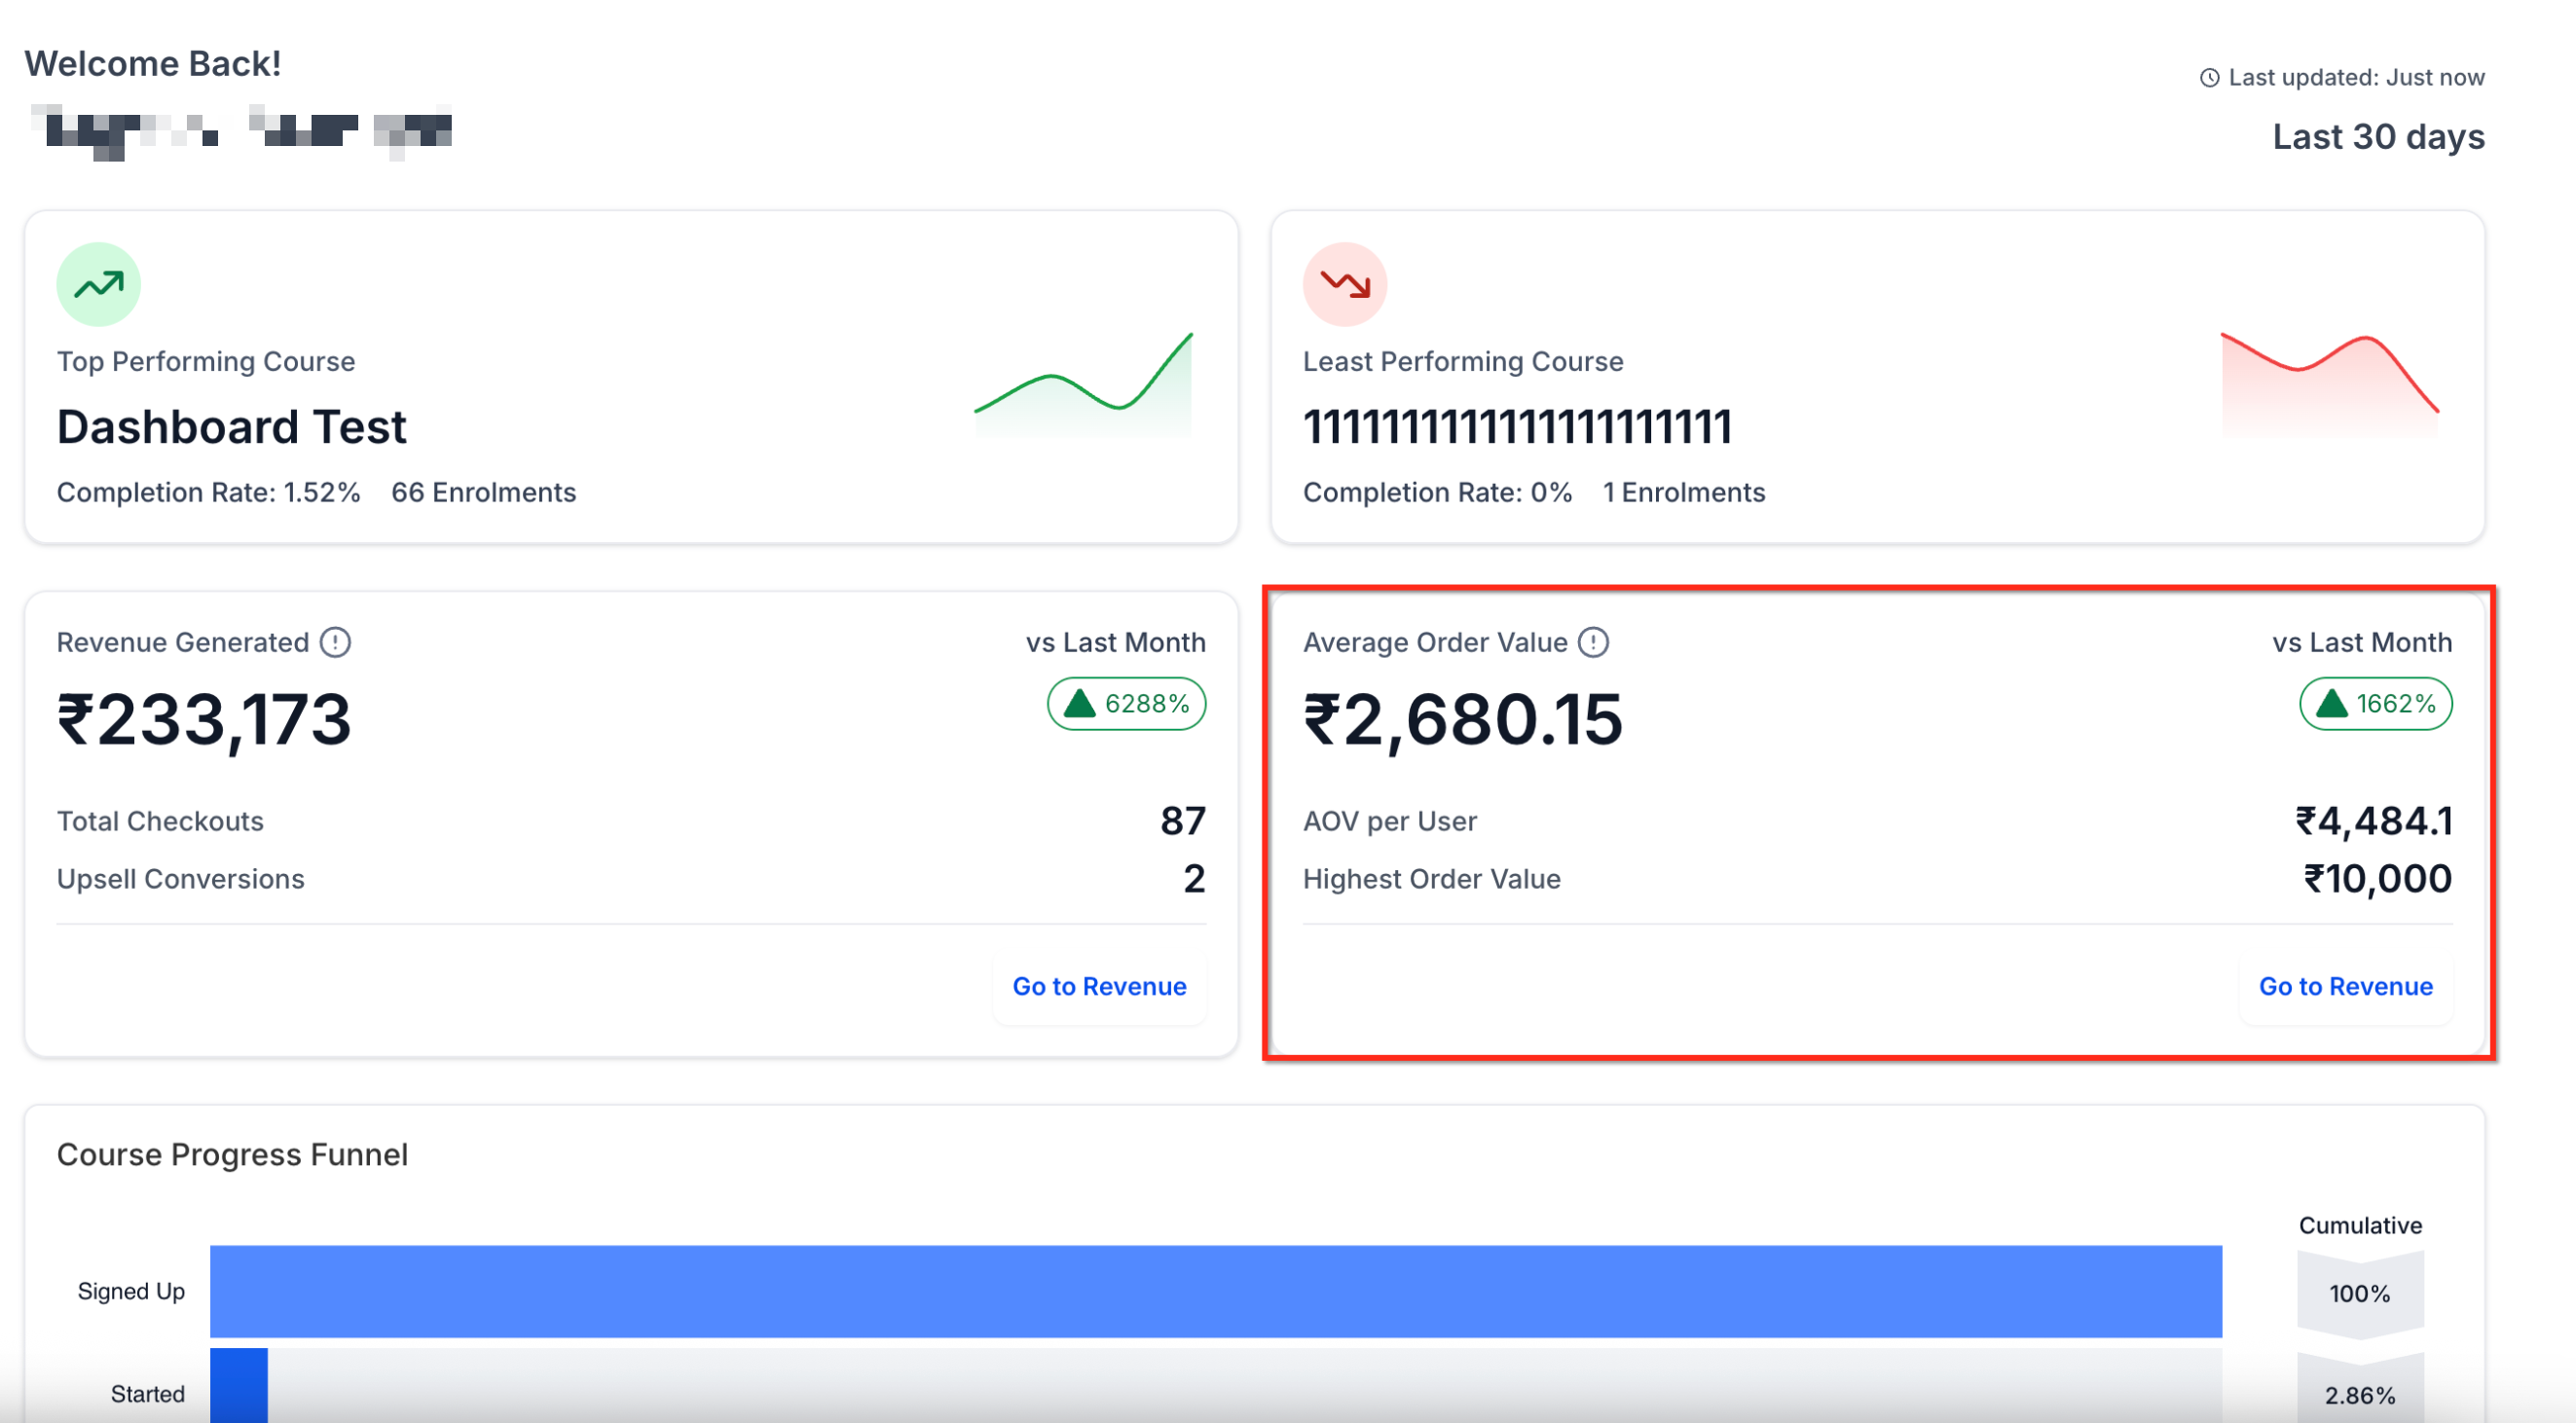
This card shows how much revenue you earn on average per learner.
AOV per User: total revenue divided by total learners.
Highest Order Value: the largest single transaction recorded in the past 30 days.
vs Last Month: percentage change compared to the previous period.
This visualization tracks how learners move through your course, from sign-up to completion.
Signed Up: number of people who registered for your courses.
Started: learners who began engaging with lessons or modules.
Completed: learners who finished the course.
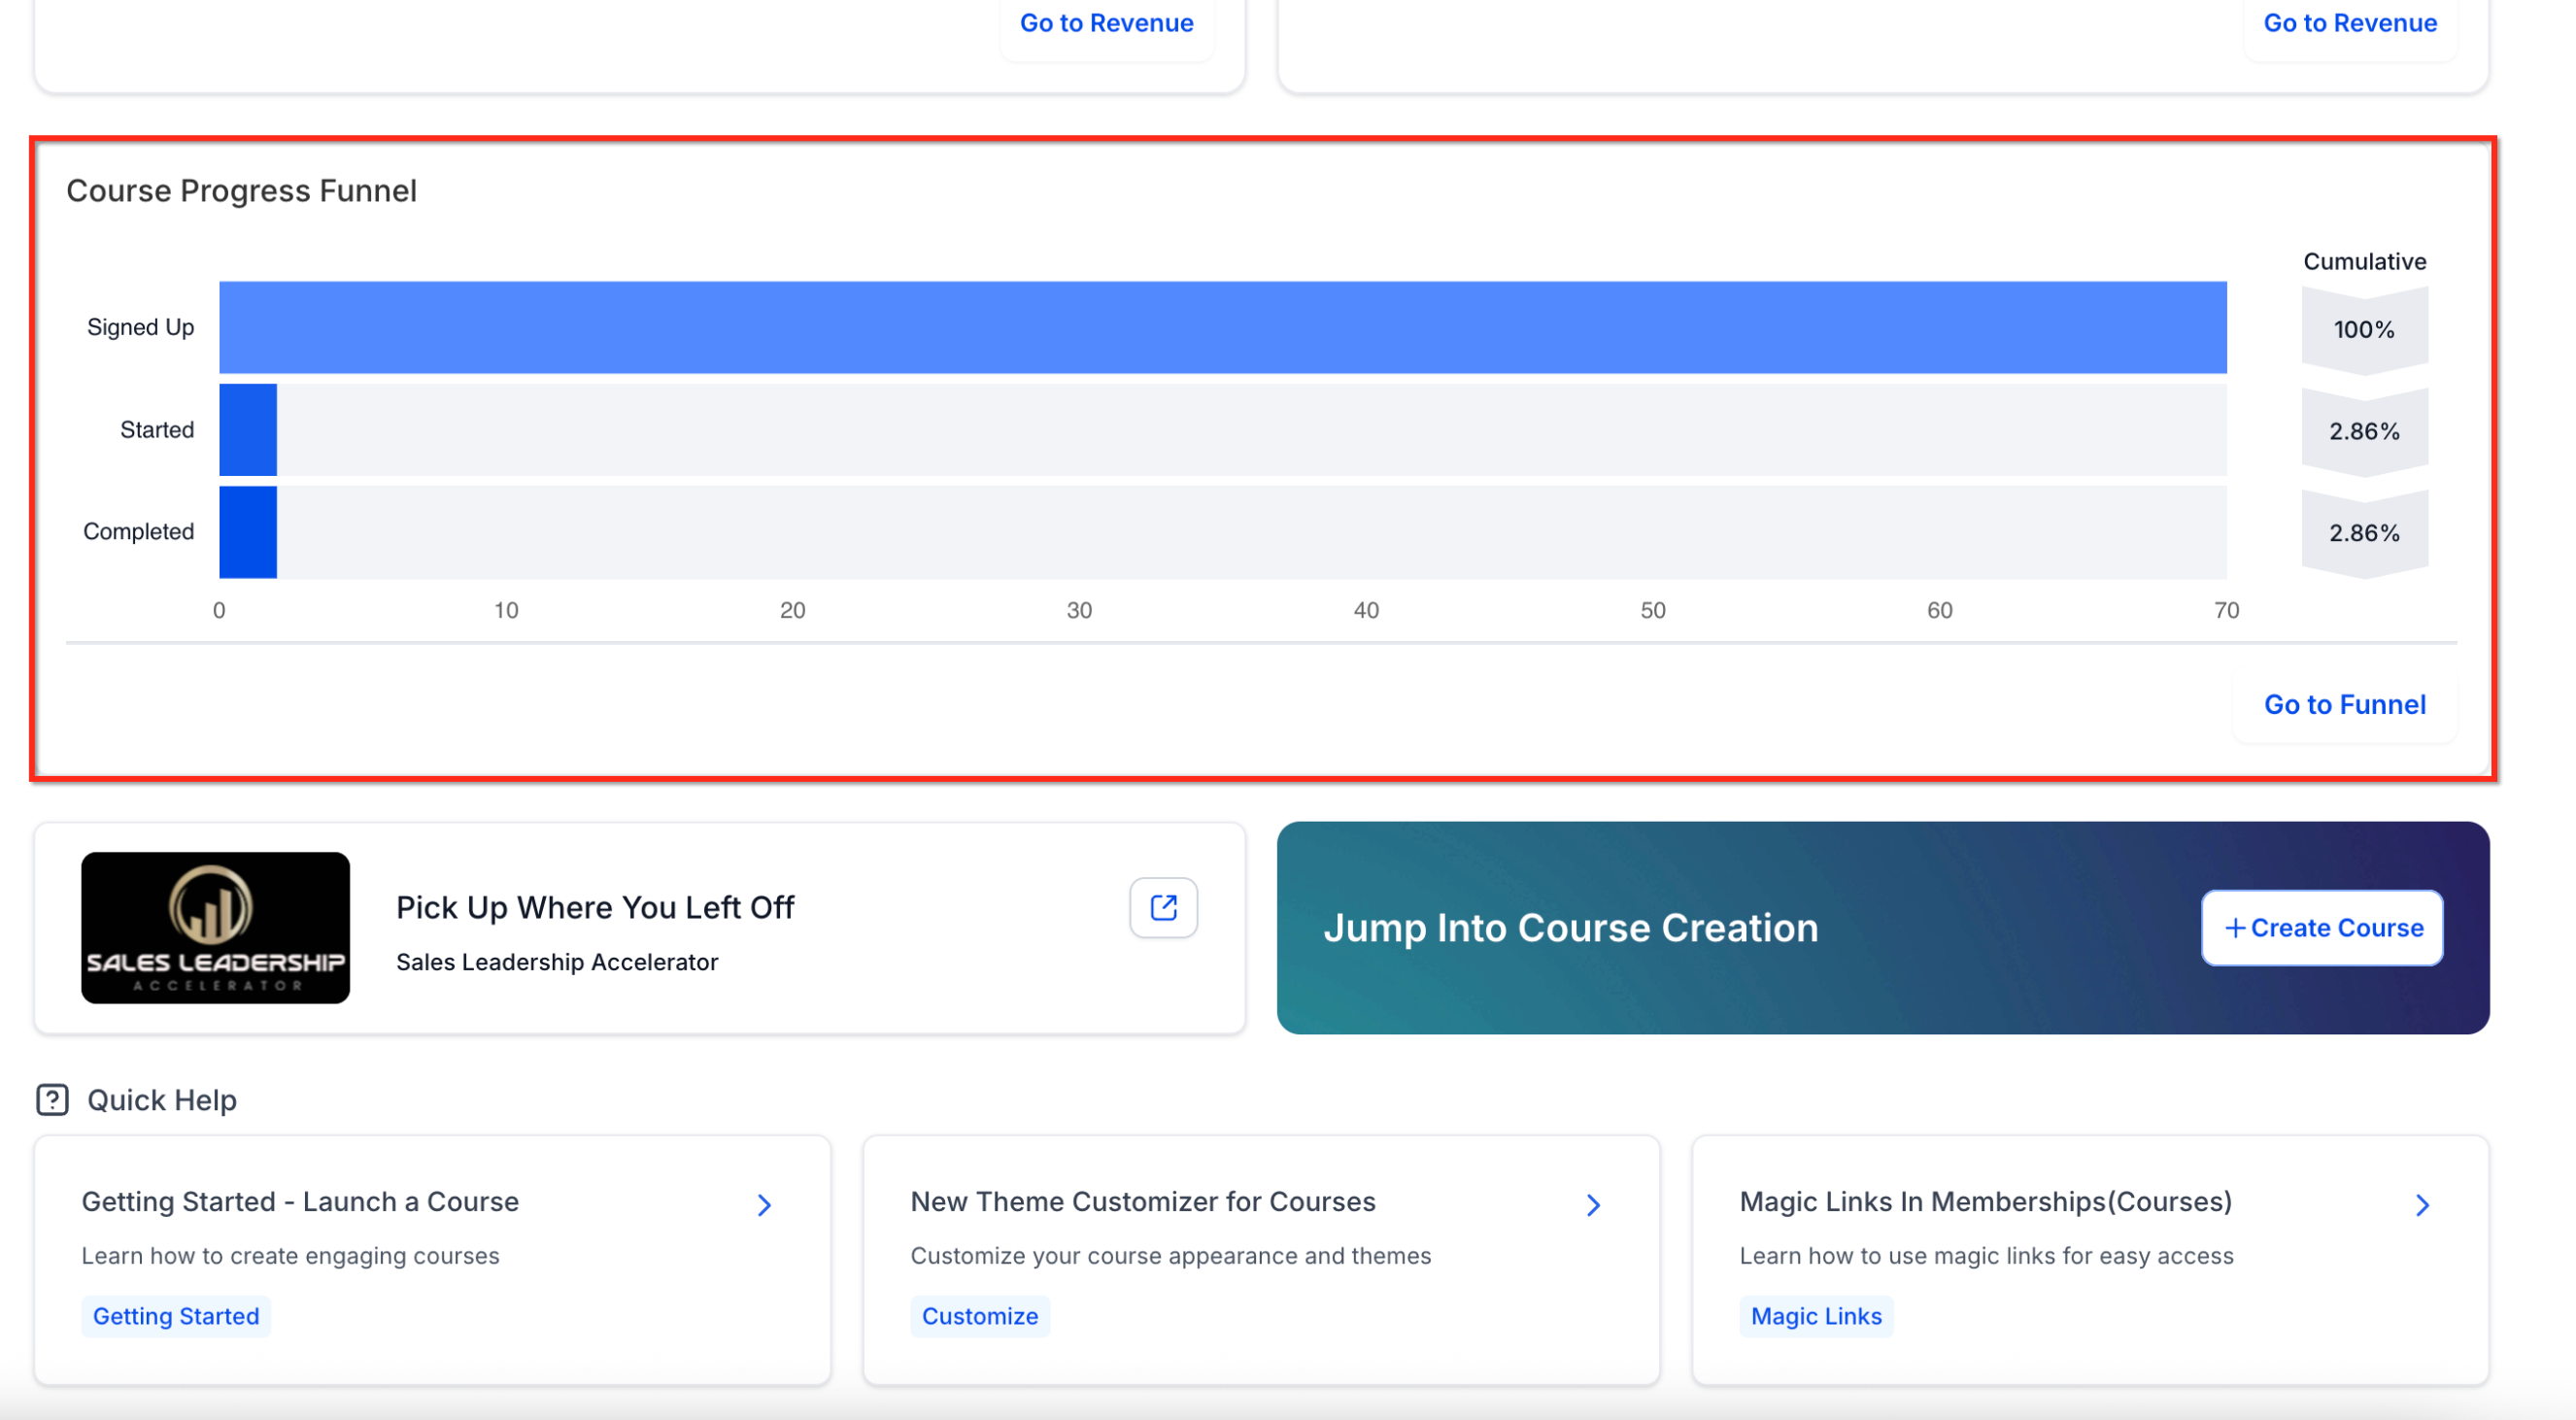
The cumulative percentage on the right side shows what proportion of learners progressed to each stage, so you can quickly spot where people are dropping off.
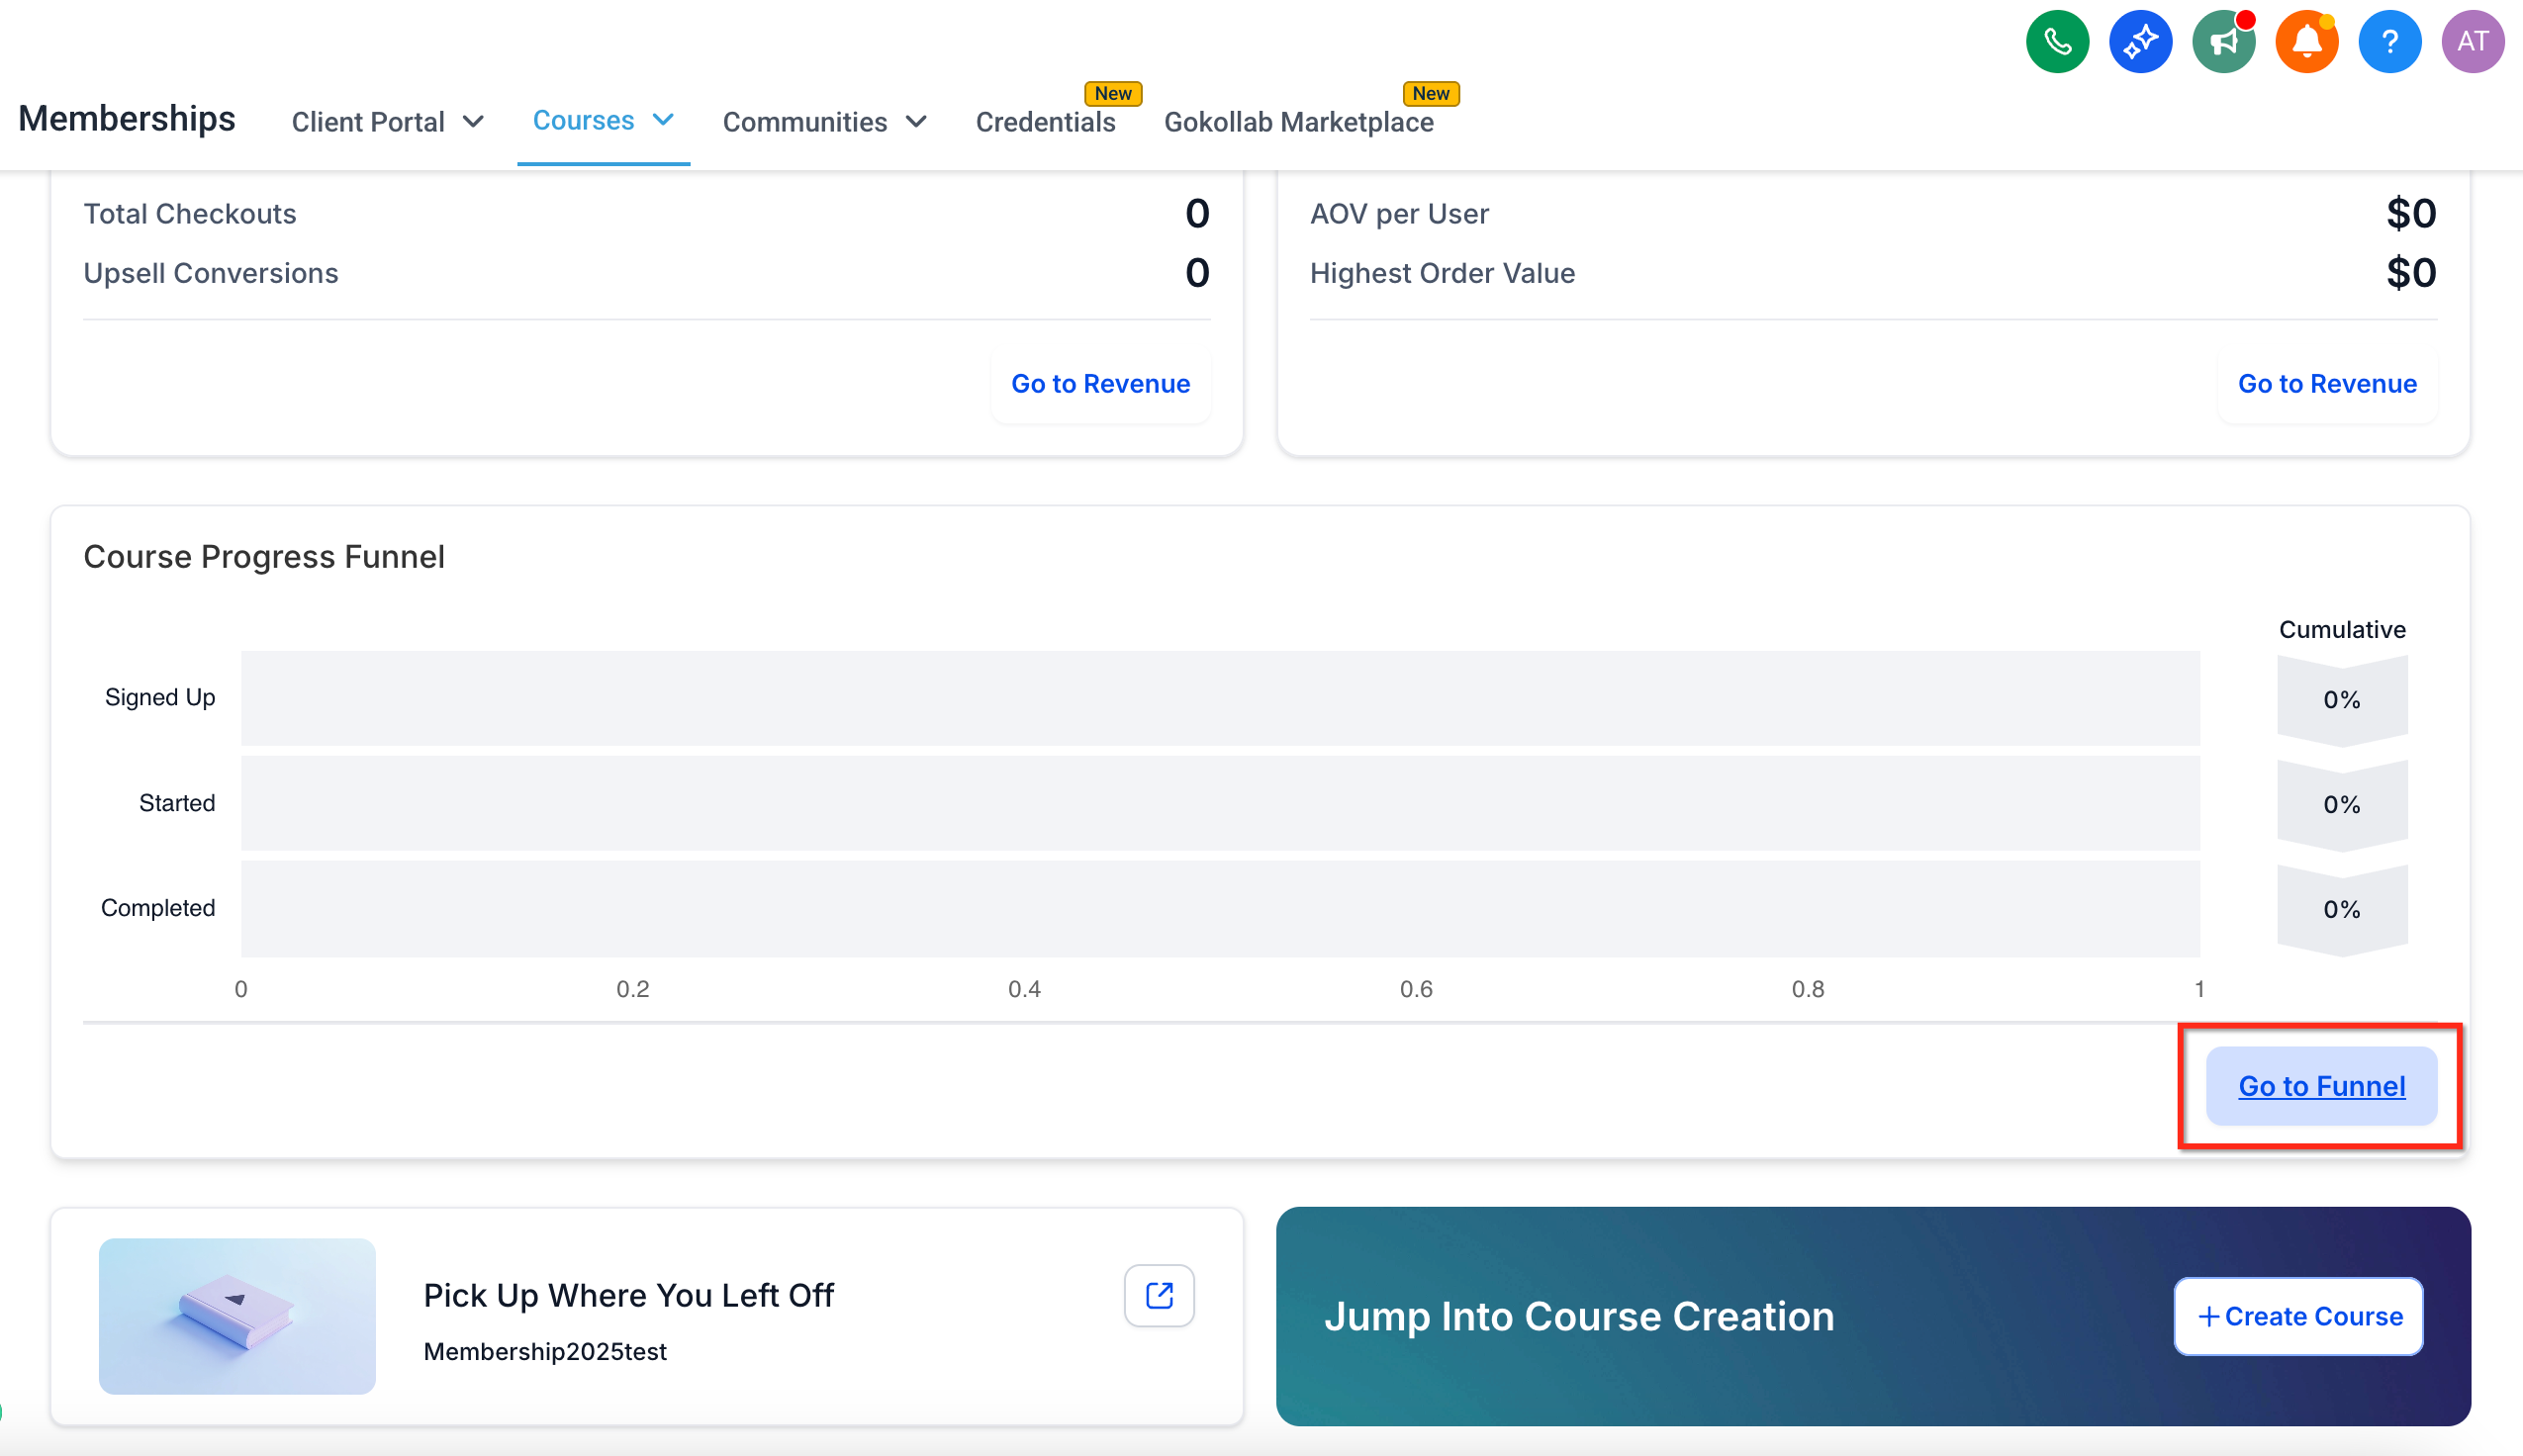
Click Go to Funnel to view detailed course progress analytics, learner-level data, and export options.
Use the Top vs. Least Performing Course cards to decide where to invest your optimization efforts, such as improving lesson content or adjusting pricing.
Check Revenue and AOV trends monthly to measure the impact of pricing or promotional changes.
Review the Course Progress Funnel regularly to identify where learners drop off and improve completion rates.
If you want to trigger follow-up emails, texts, or tasks based on course activity (a patient completing a course, purchasing a bundle, or dropping off mid-course), set that up in Workflows rather than from the dashboard itself.
If your courses include quizzes, quiz results and scoring are managed separately in Quiz Builder and aren't reflected on this dashboard.
The dashboard tracks how your courses are performing, but members finding those courses is a separate experience: inside a Community's Learning tab, members can filter and sort your course list themselves.
Topic: narrows courses to the subject or category assigned to each one.
Difficulty: helps members find courses suited to their experience level.
Language: narrows courses to the language assigned to each one.
Title, Newest, or Oldest: sorts the filtered results.
These options are powered by the Topic, Difficulty, and Language values you assign on each course, so keeping that metadata accurate helps members find the right content faster as your library grows. Filtering only organizes courses a member can already see. It doesn't grant access to restricted courses or override group, course, offer, or enrollment permissions.
To filter, a member opens the group's Learning tab and selects one or more Topic, Difficulty, or Language values. Courses matching that criteria stay in the results, and the member can apply a sort option or select Reset all at any time to clear the active filters.
Do I need to migrate anything to use the dashboard? No. Your existing course and membership data updates automatically, and the dashboard reflects it the next time you open Courses.
Why don't I see any revenue data? Revenue cards only populate once at least one paid checkout has been processed through Aesthetix CRM's payment processing (including AX Pay) or Stripe. If you haven't sold a paid course or membership yet, these cards will stay empty.
Can I export the dashboard data? Yes. Click Export > CSV in the upper-right corner to download your 30-day aggregates.
How do I change which metrics appear? The metric tiles are fixed for now. There isn't a way to add or remove cards from this view.
Will checking the dashboard use up my API limits? No. Dashboard queries run on our servers and don't count against any API allotment.
Is the dashboard available on mobile? Yes, it's fully responsive and works on tablets and phones as well as desktop.
How often does the data update? Every 6 hours. If you just processed a sale or a learner just completed a course, give it a little time before expecting the numbers to reflect it.
Where do I see analytics for a single course instead of all of them? Click that course's name from the Top or Least Performing Course card to open its dedicated Course Details page.
Can members filter or sort courses in a Community's Learning tab? Yes. Members can filter by Topic, Difficulty, and Language, and sort by Title, Newest, or Oldest. Filtering only narrows what's visible among courses a member can already access, it doesn't unlock restricted courses.
