Custom Metrics let you build the KPIs that matter most to your practice right inside your Dashboard and reports. Instead of exporting numbers to a spreadsheet, you combine data from different sources, apply your own formula, and see results like cost-per-booked-consult or revenue-per-lead update automatically. You build and manage Custom Metrics from the Dashboard.
A Custom Metric is a widget you design yourself. You pick the data points, combine them with a formula, choose how the result displays (a whole number, a decimal, a percentage, or a currency value), and drop it onto any dashboard or report. Because you control the formula, you're not limited to the metrics Aesthetix CRM tracks out of the box.
Key benefits:
Personalized KPIs: Combine data from multiple sources into metrics tailored to your practice, such as cost per booked consult, revenue per lead, or consult win rate.
Efficient setup: Build a new metric from scratch or clone an existing one to save time and keep your reporting consistent.
Smart formula editor: Insert metrics from different data sources, add operators and constants, and get live validation as you build.
Flexible display options: Show results as Integer, Float, Currency, or Percentage, whichever fits the KPI.
Trend direction controls: Decide whether an increase or a decrease in a metric should read as positive, so your dashboard reflects your practice's actual goals.
Customizable charts: Rename charts, apply themes, and compare results across different date ranges.
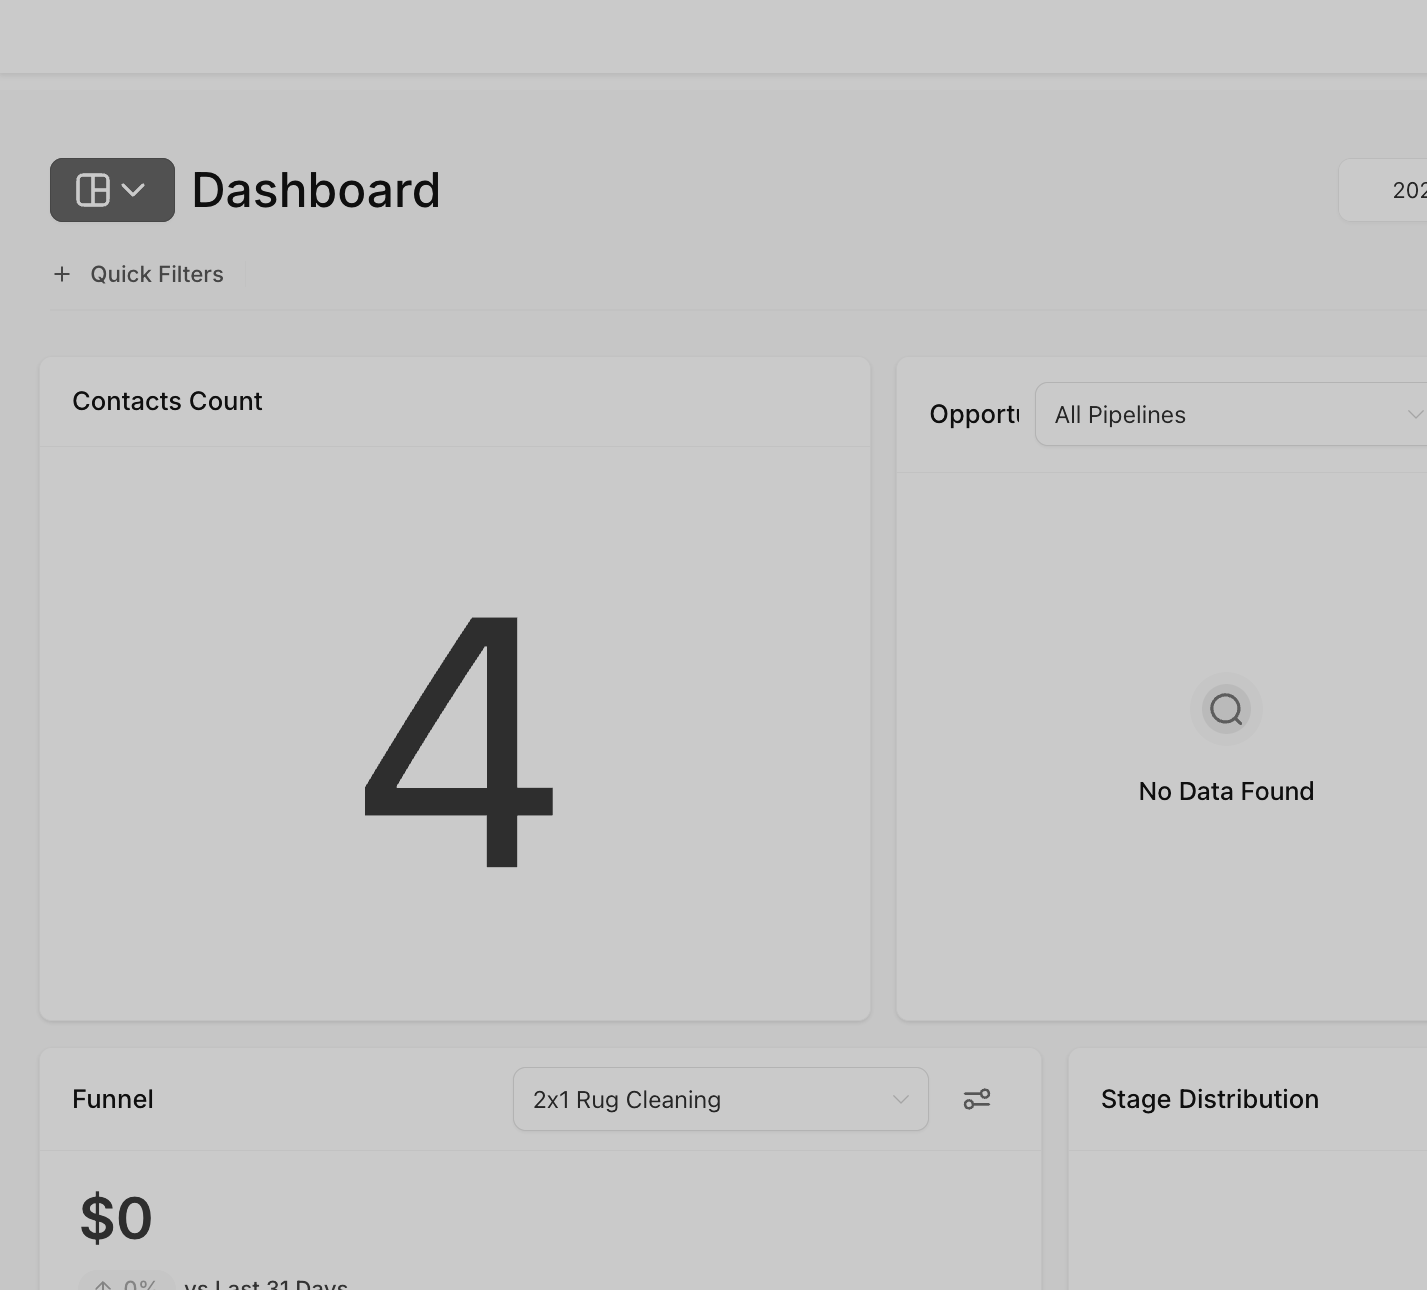
From the left-hand menu, click Dashboard to open your reporting view. This is where you manage widgets and build new custom metrics.
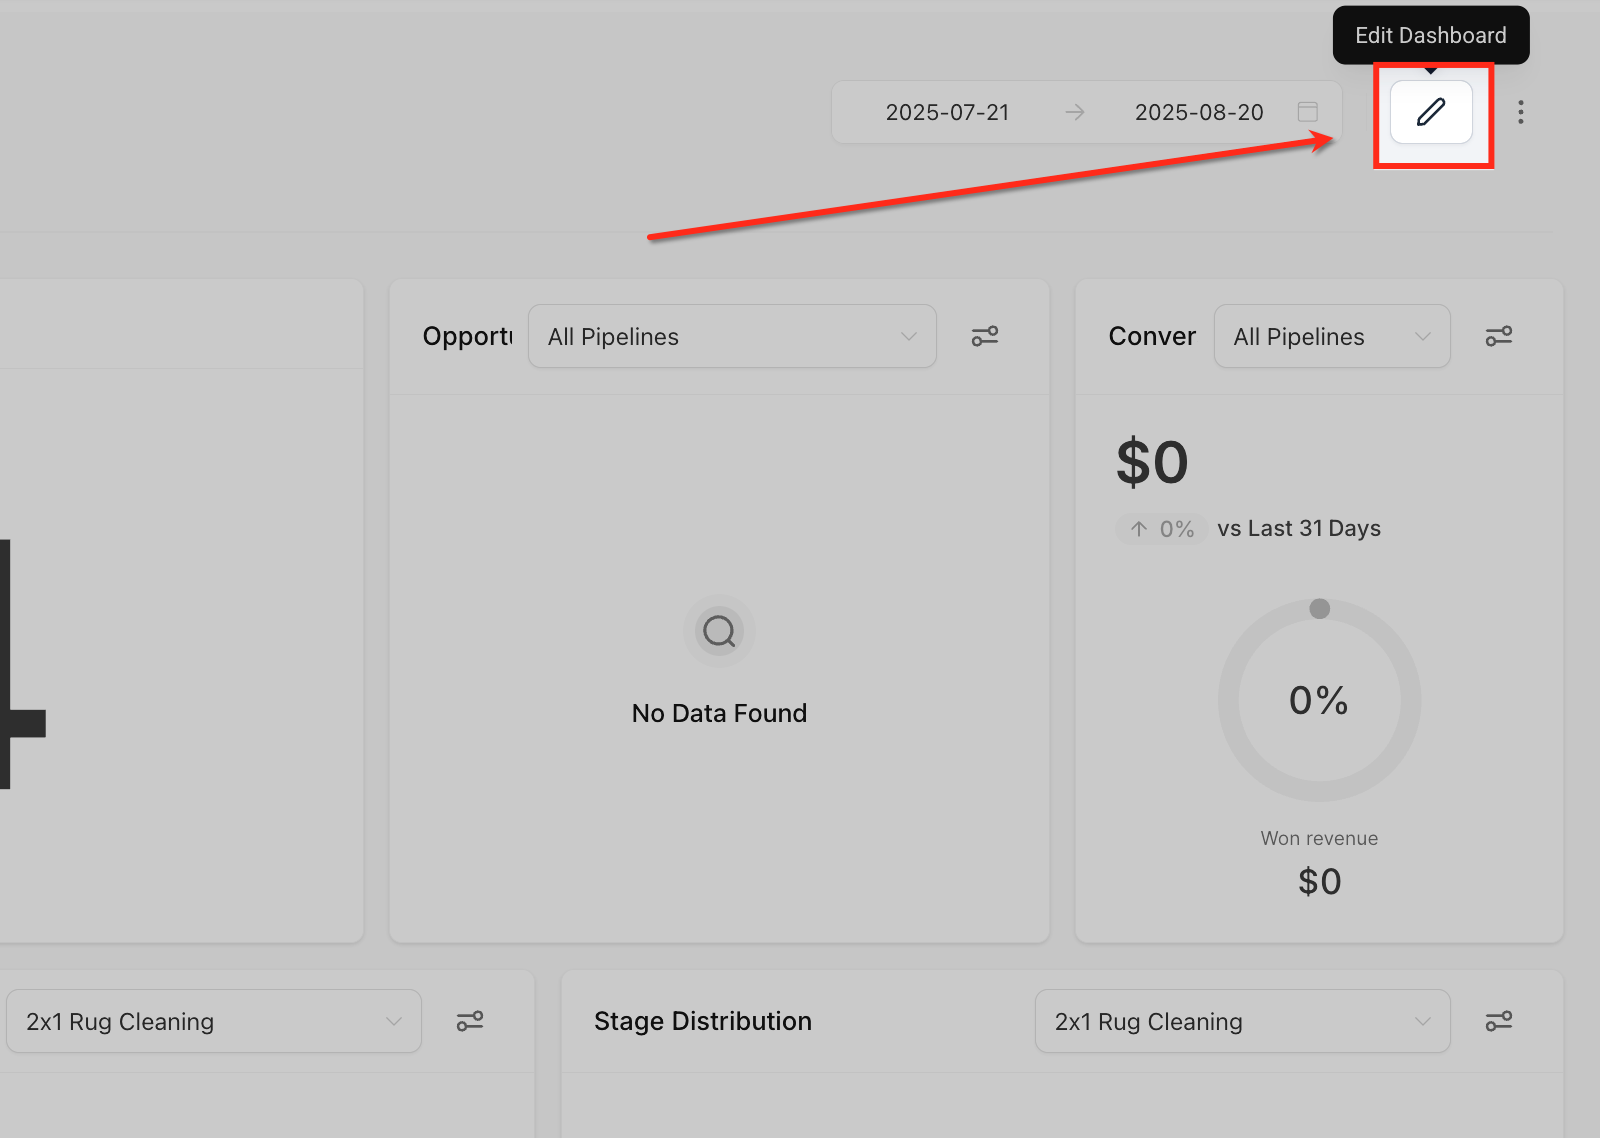
Click the Edit Dashboard icon at the top right. This unlocks edit mode so you can add or configure widgets, including custom metrics.
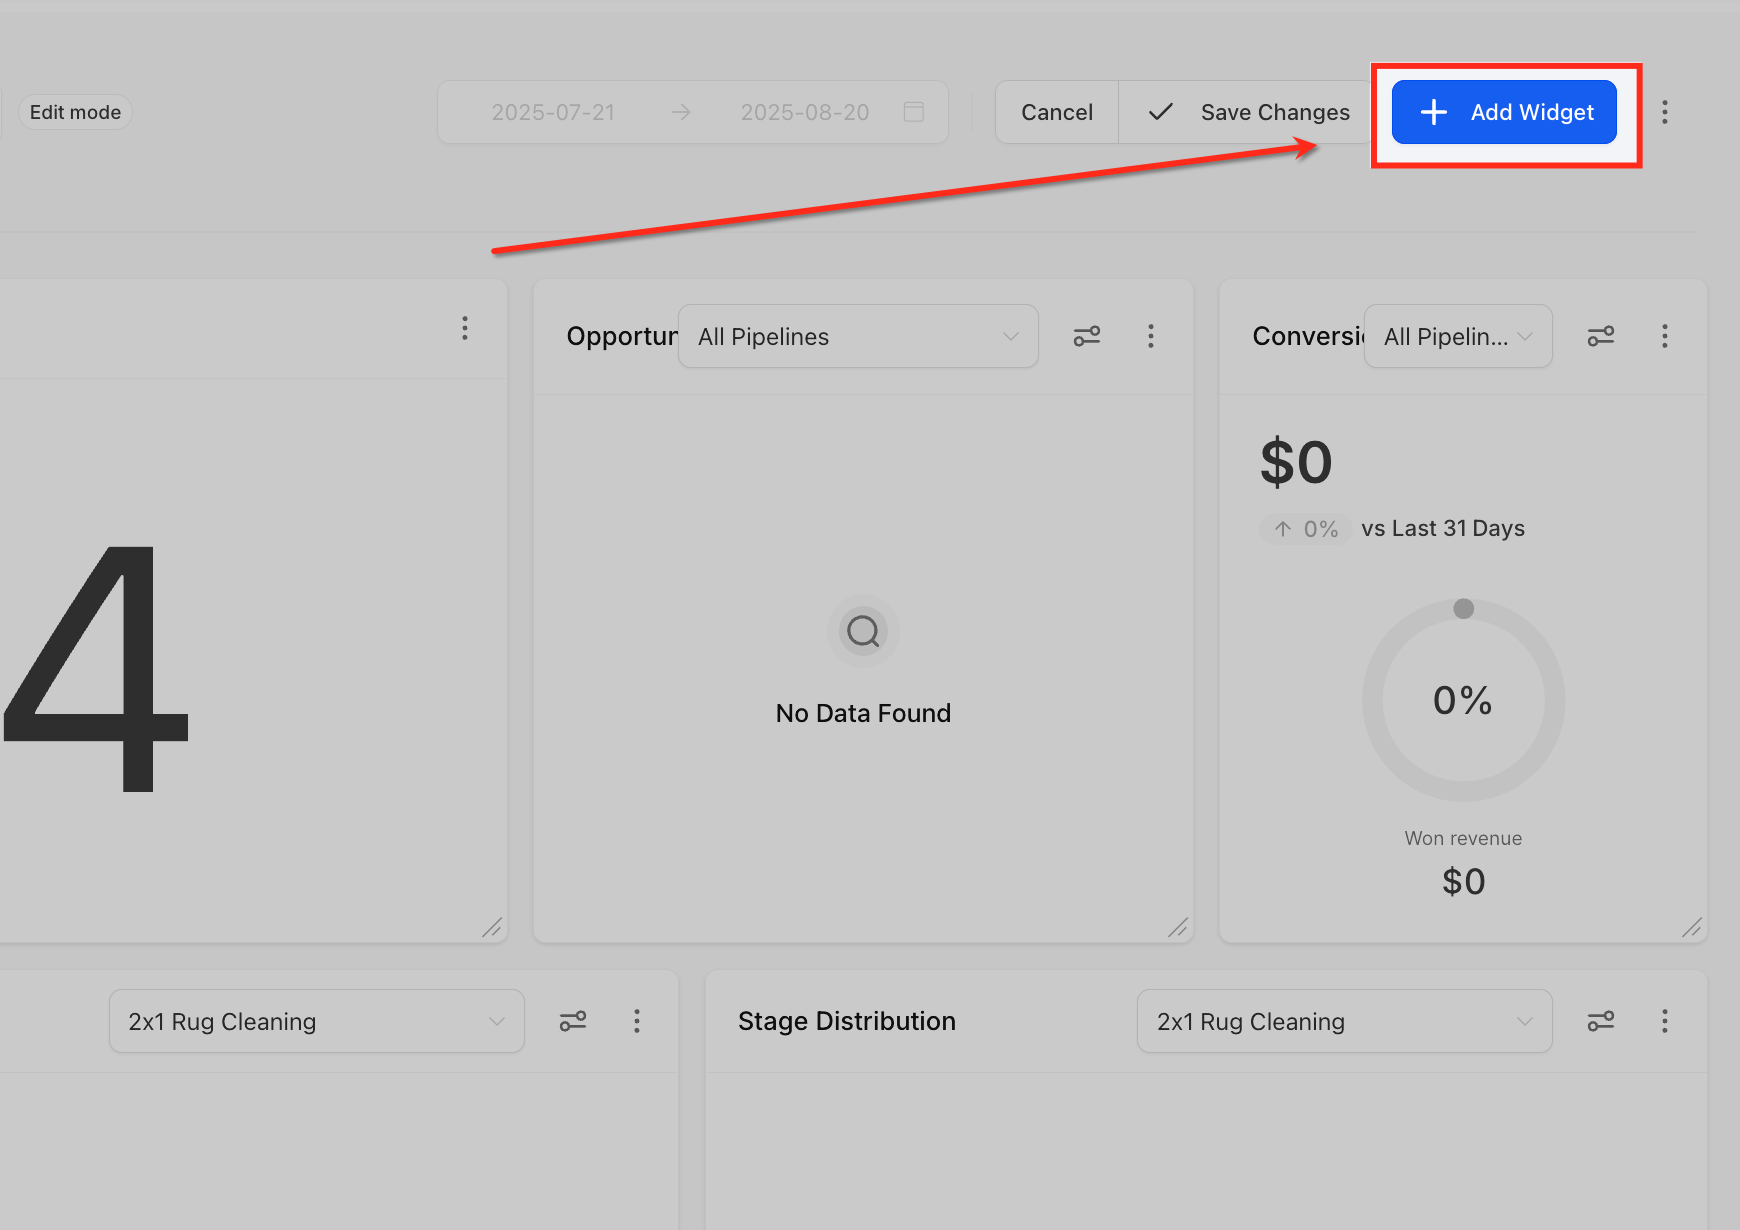
In edit mode, click Add Widget at the top right. This opens the panel for inserting any widget type, including custom metrics.
From the widget options panel, click the Custom Metrics tab. This is where you build and manage your own KPIs.
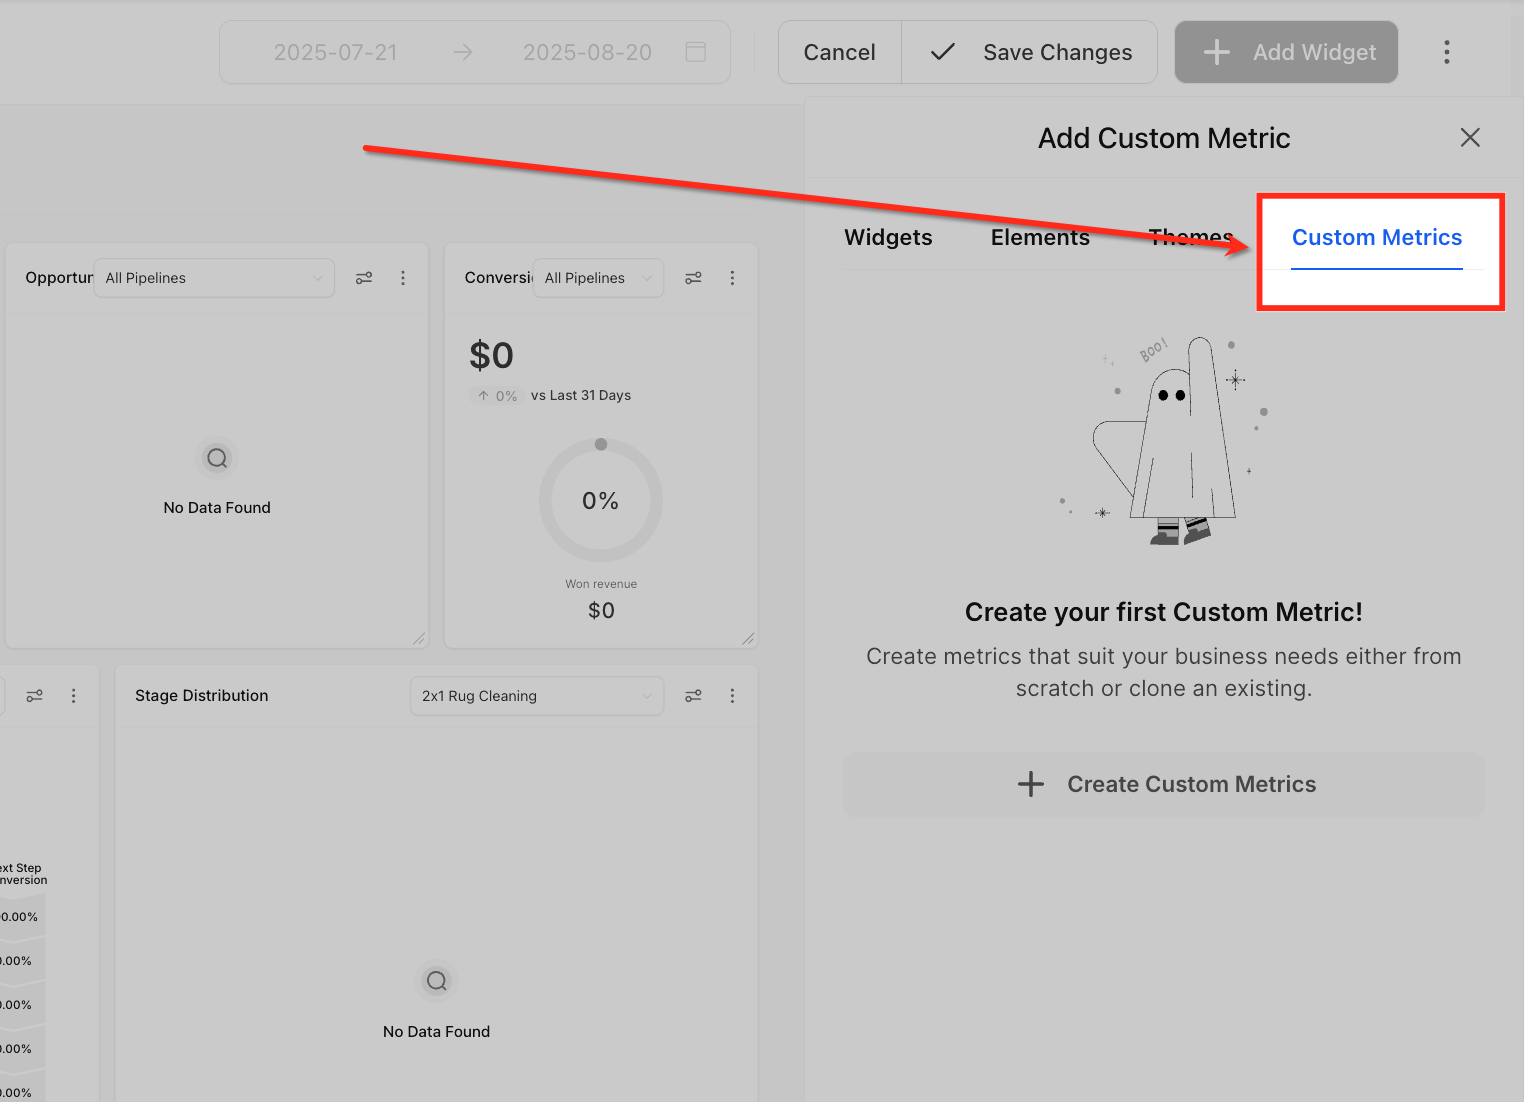
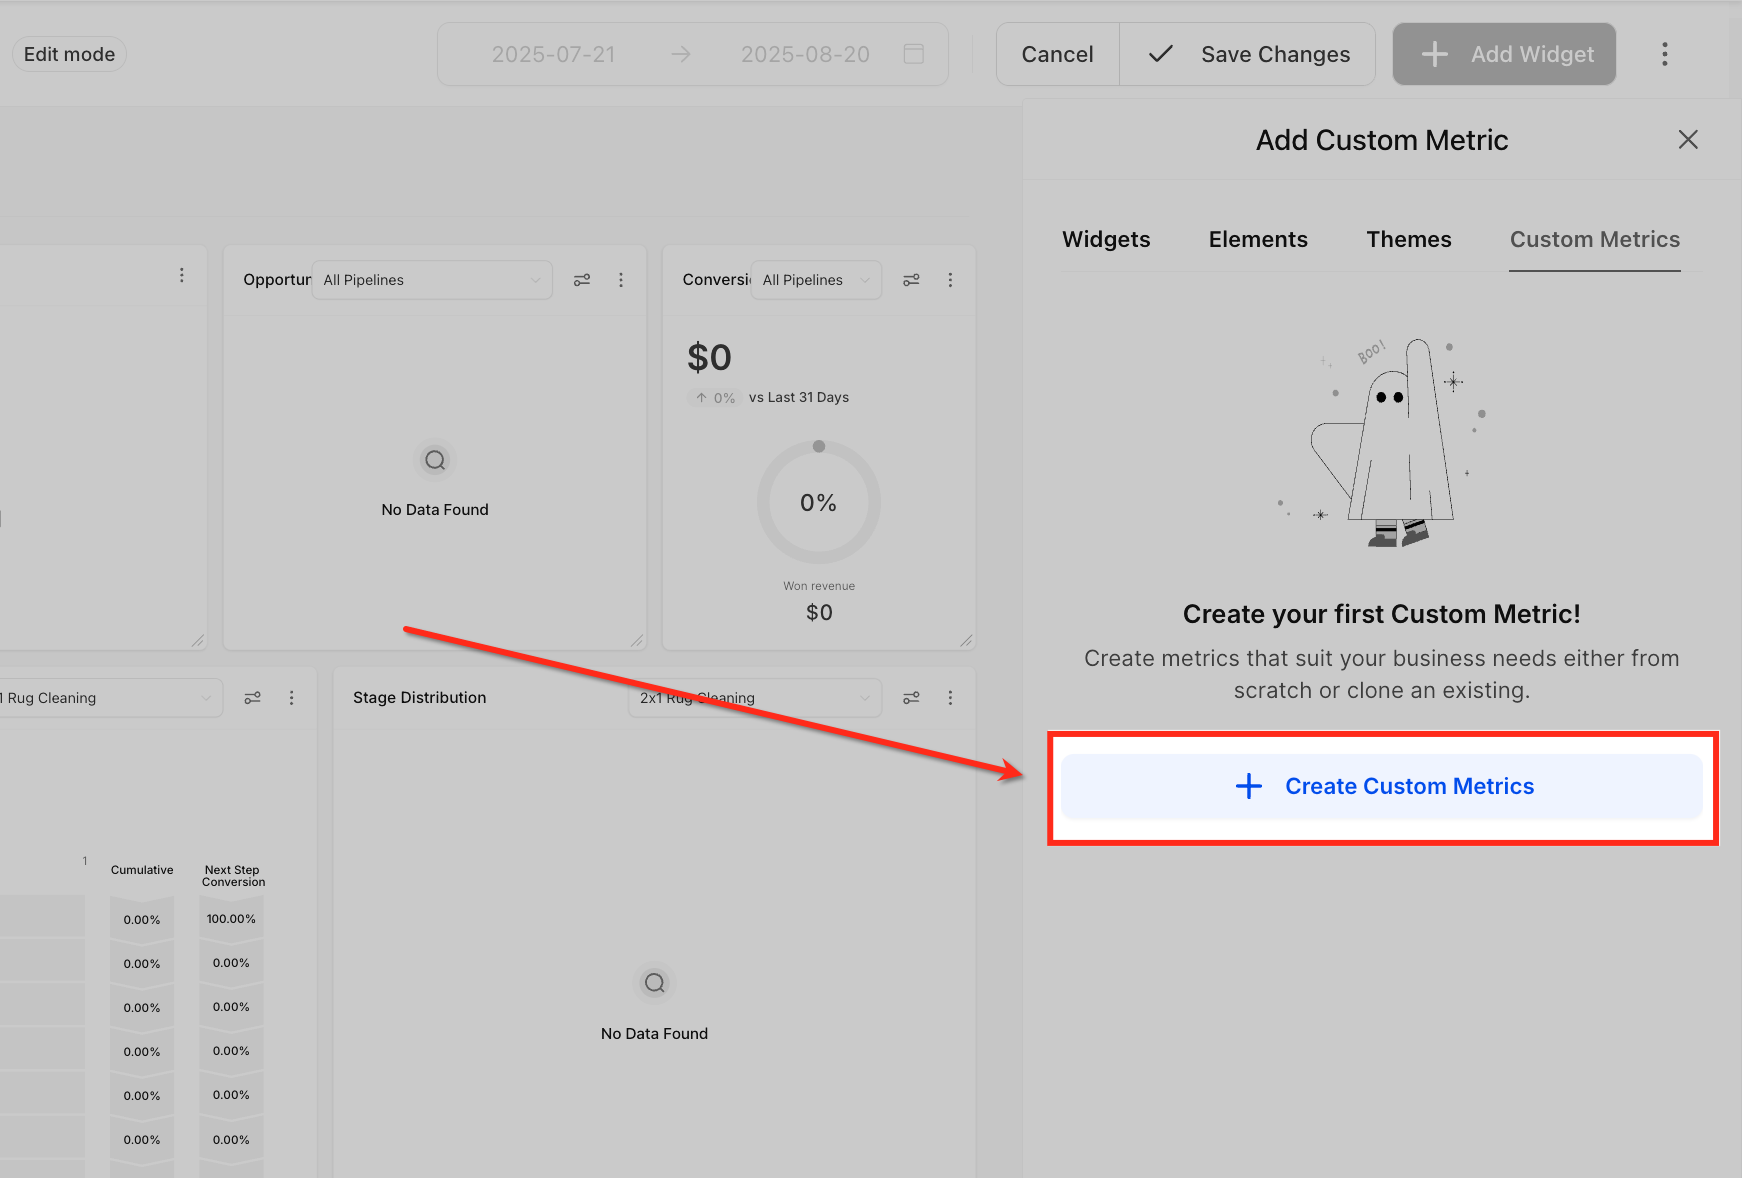
Click + Create Custom Metrics to start the setup flow.
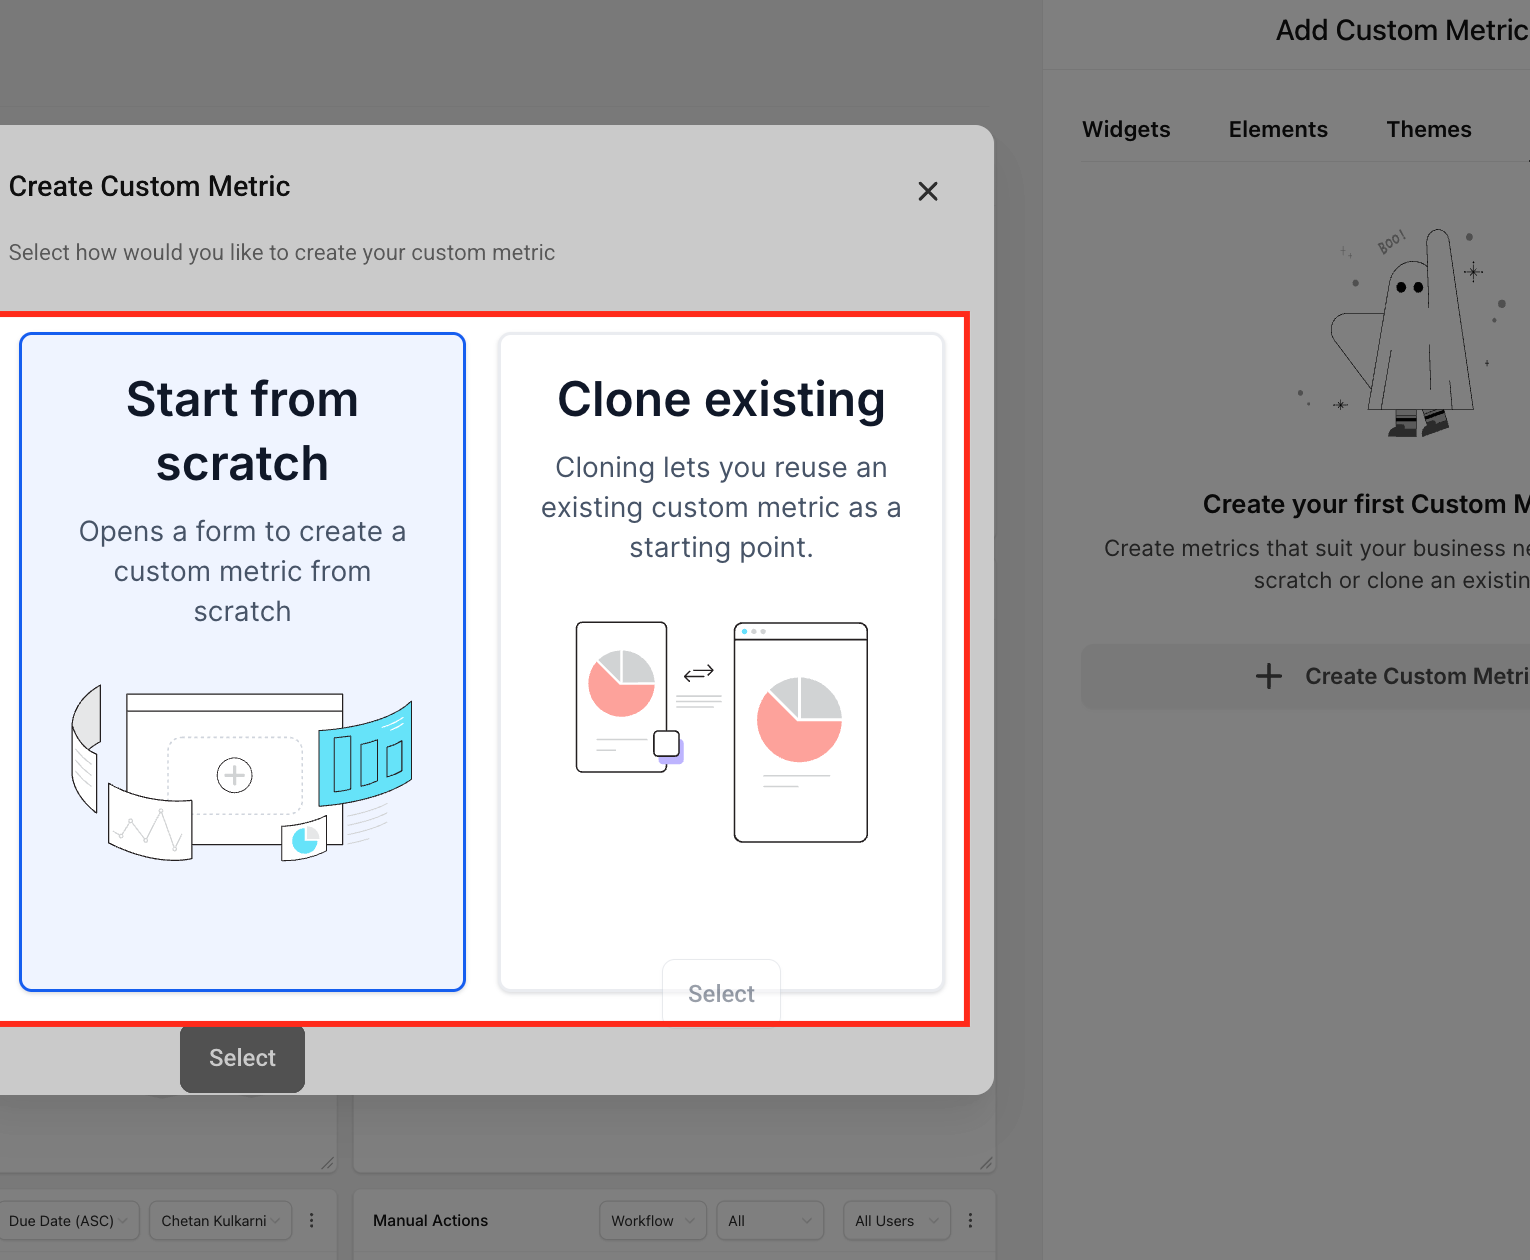
Select Start from scratch to build a brand new metric, or Clone existing to reuse and adapt a metric you already built.
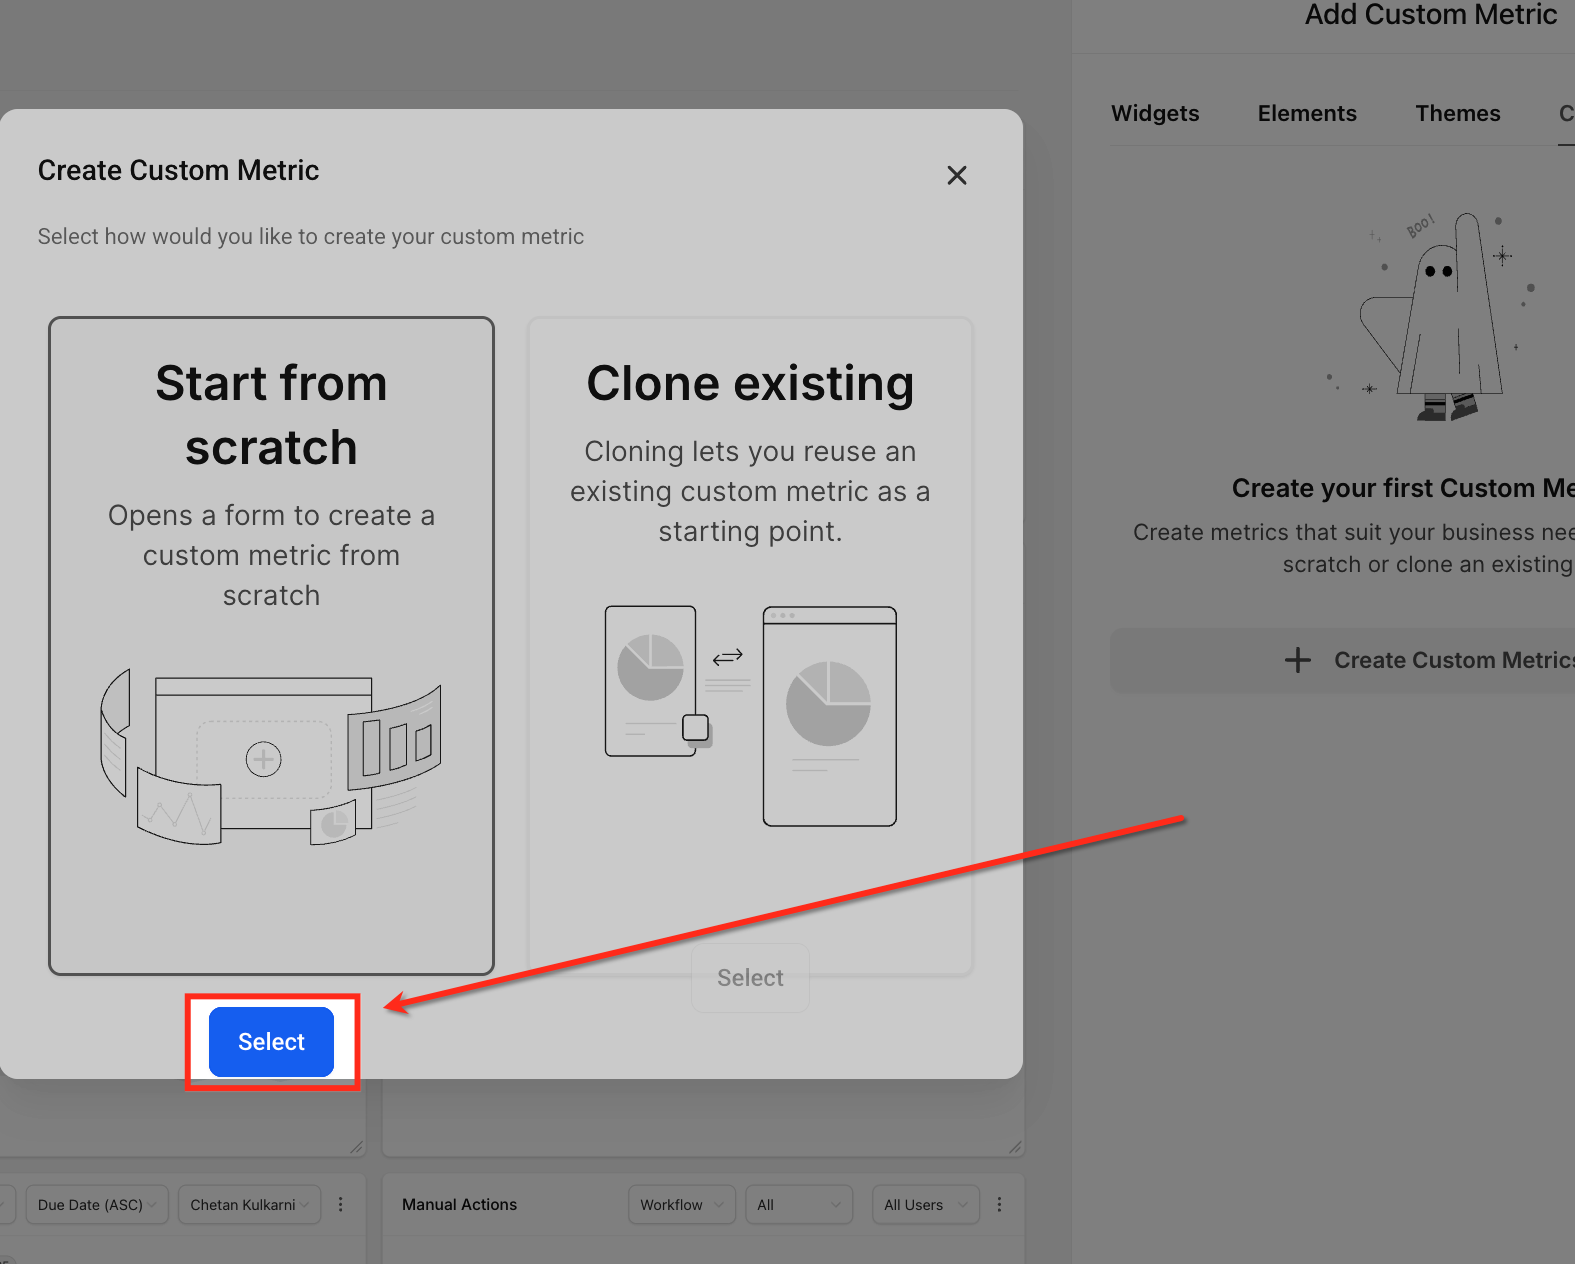
After choosing Start from scratch or Clone existing, click Select at the bottom to open the setup form.
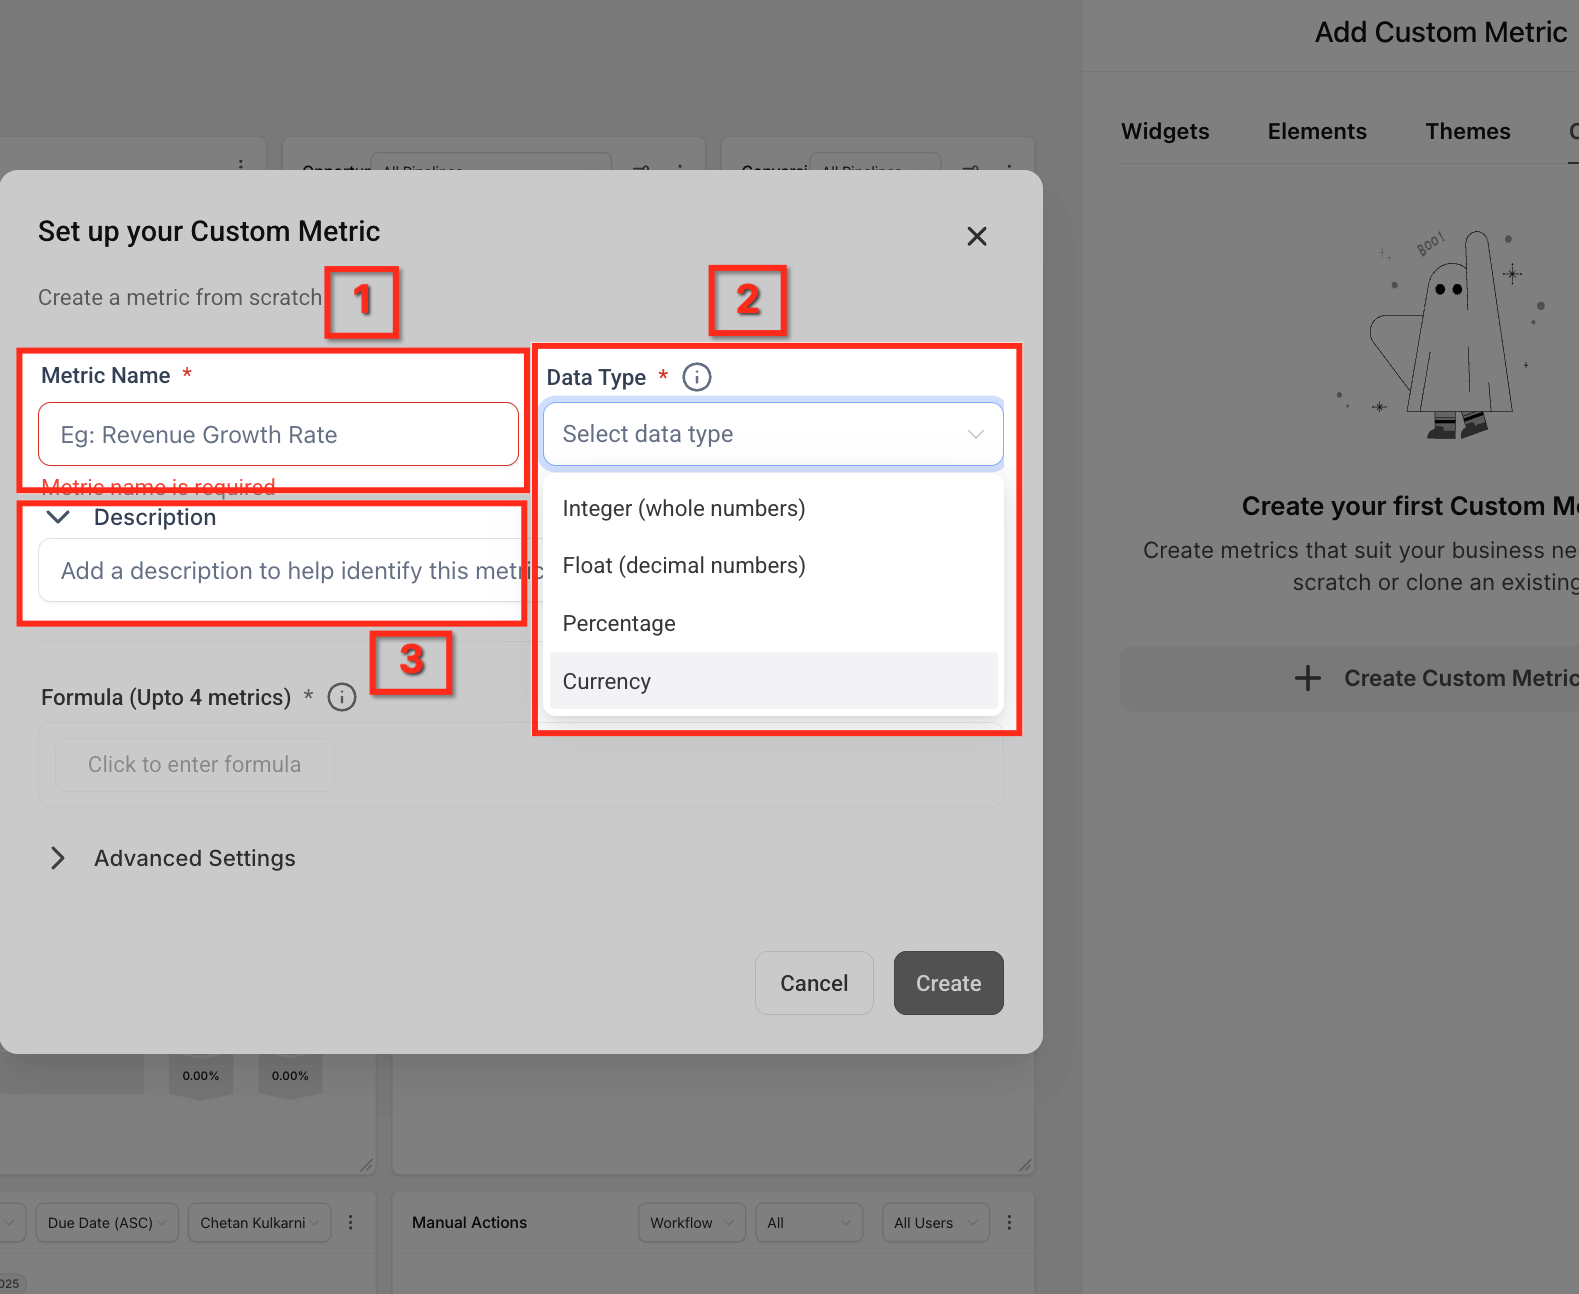
Fill in:
Metric Name: A clear name, such as "Cost per Booked Consult" or "Revenue Growth Rate," so the metric is easy to identify later.
Data Type: How the value should display: Integer (whole numbers), Float (decimals), Percentage, or Currency.
Description: A short note explaining the purpose of the metric for you and your team.
The Formula field is where you define how the metric calculates. You can combine up to four metrics, apply operators (+, -, x, /), and add constants. This lets you build KPIs that reflect your practice, rather than being limited to standard reports. For example, to calculate a consult win rate, divide Won Opportunities by New Leads and multiply by 100 to display it as a percentage.
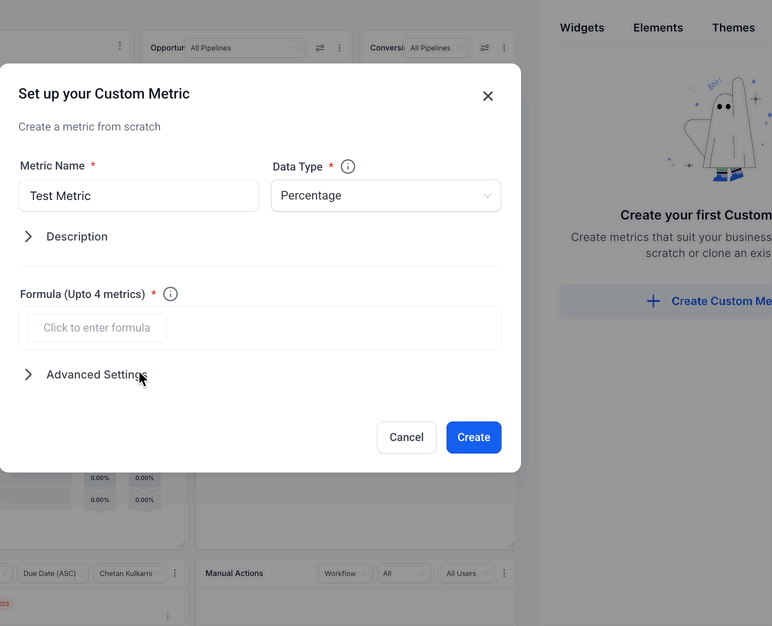
In Advanced Settings, choose the date property that applies to each metric in your formula. This keeps the calculation tied to the correct time dimension.
For example, if your formula includes Page Views and Appointments, each has its own date property:
Page Views → Visited On (the date the page was viewed)
Appointments → Created On (the date the appointment was scheduled)
The dropdown options here change based on the metrics you selected in the formula step, showing only the date fields relevant to each one. Matching Page Views (Visited On) with Appointments (Created On), for instance, lets you measure how many site visits actually turned into booked appointments within the same window.
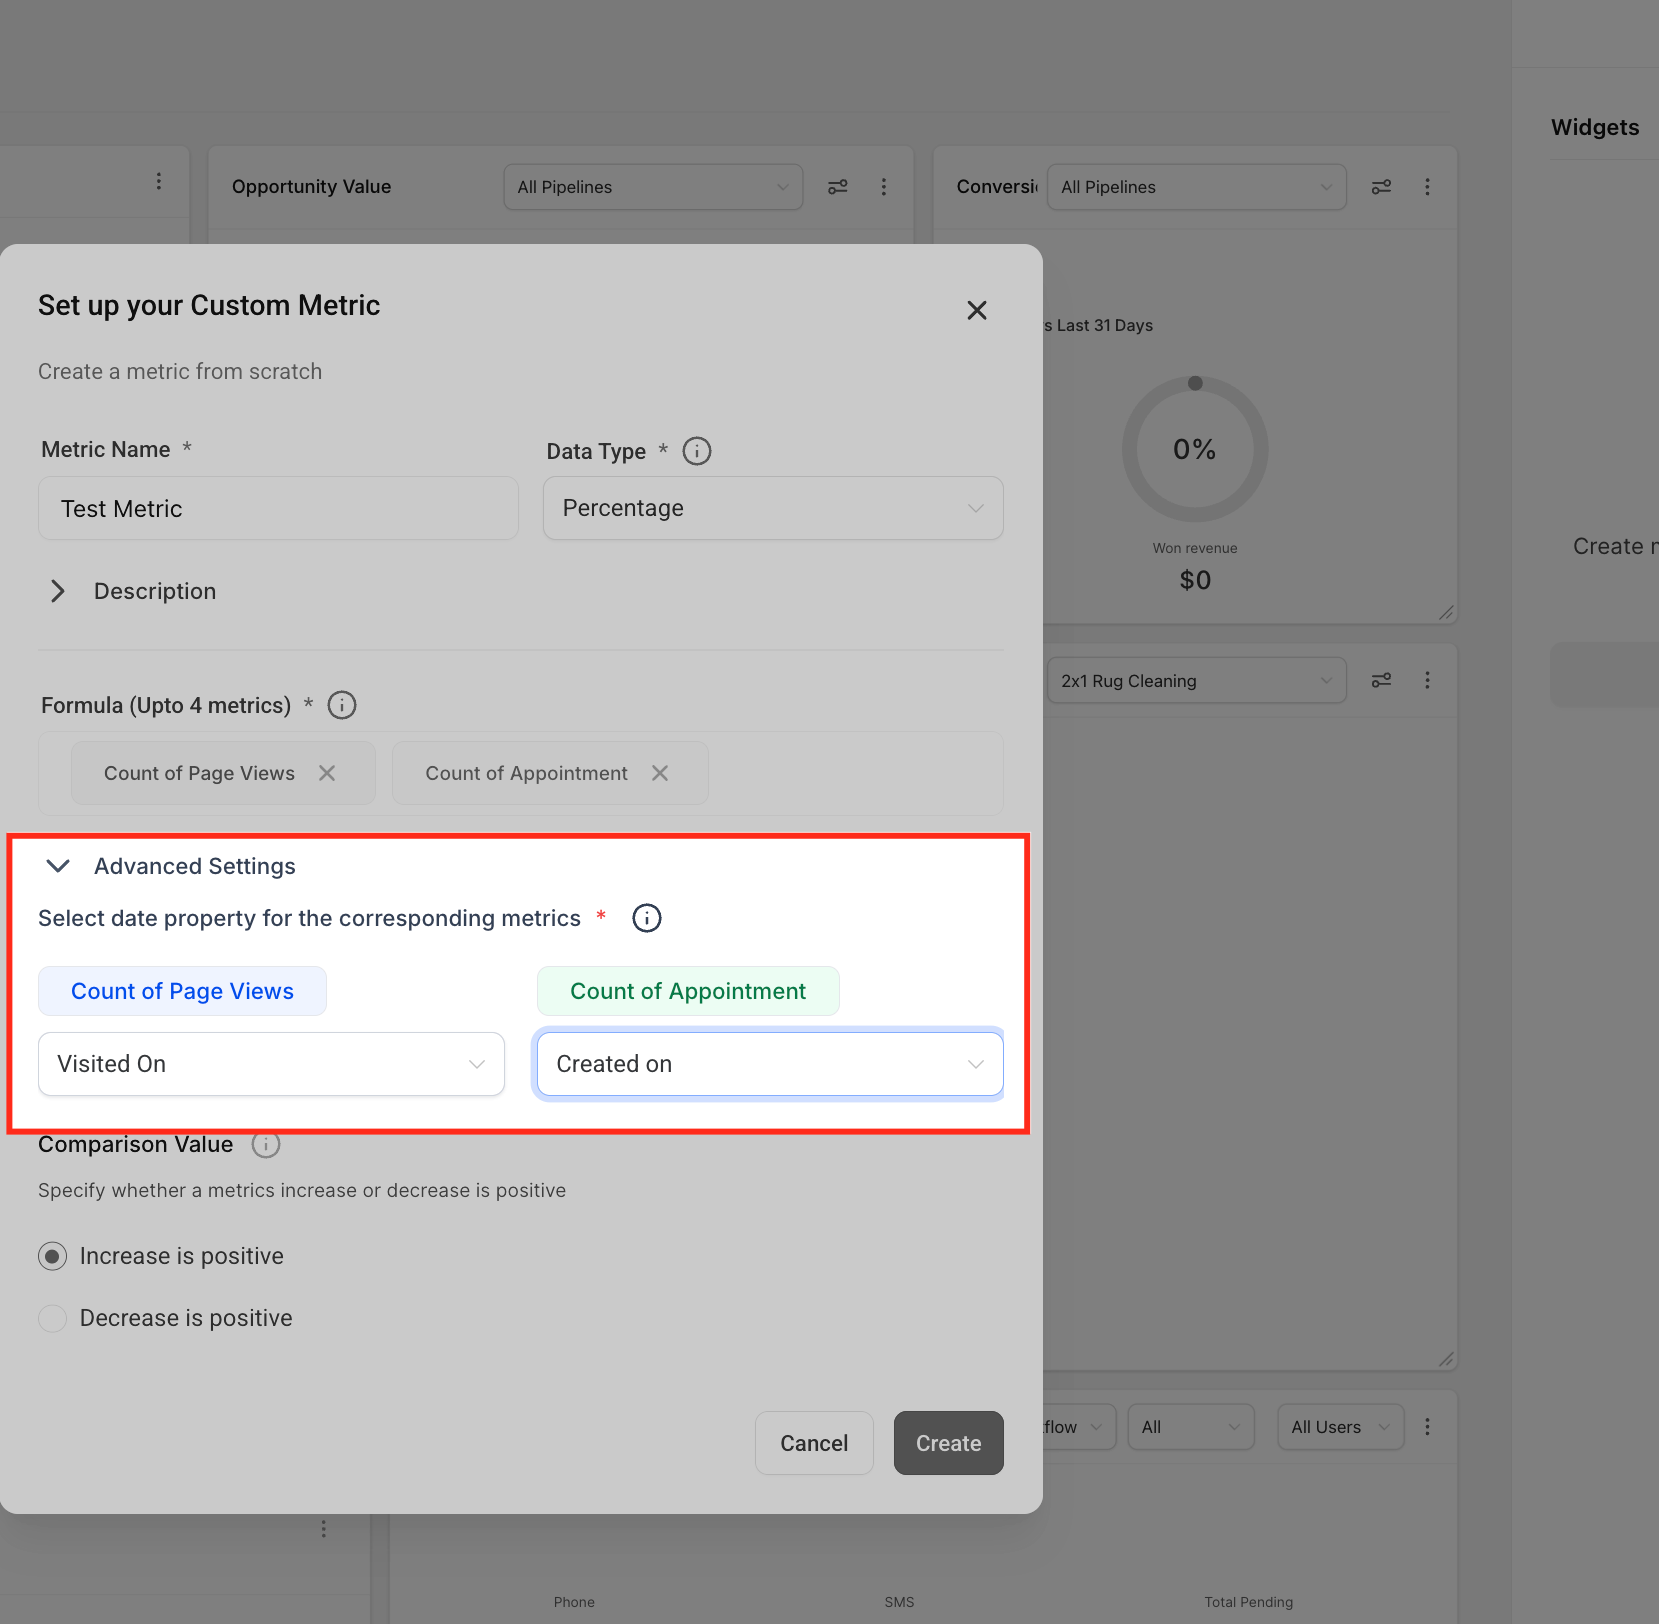
In Comparison Value, decide whether an increase or a decrease in the metric should count as positive:
Increase is positive: Choose this when a higher number means growth, such as revenue, booked appointments, or new leads.
Decrease is positive: Choose this when a lower number means improvement, such as response time or patient churn.
Getting this right matters: it's what tells your dashboard whether a change in the metric should be flagged as good news or bad news.
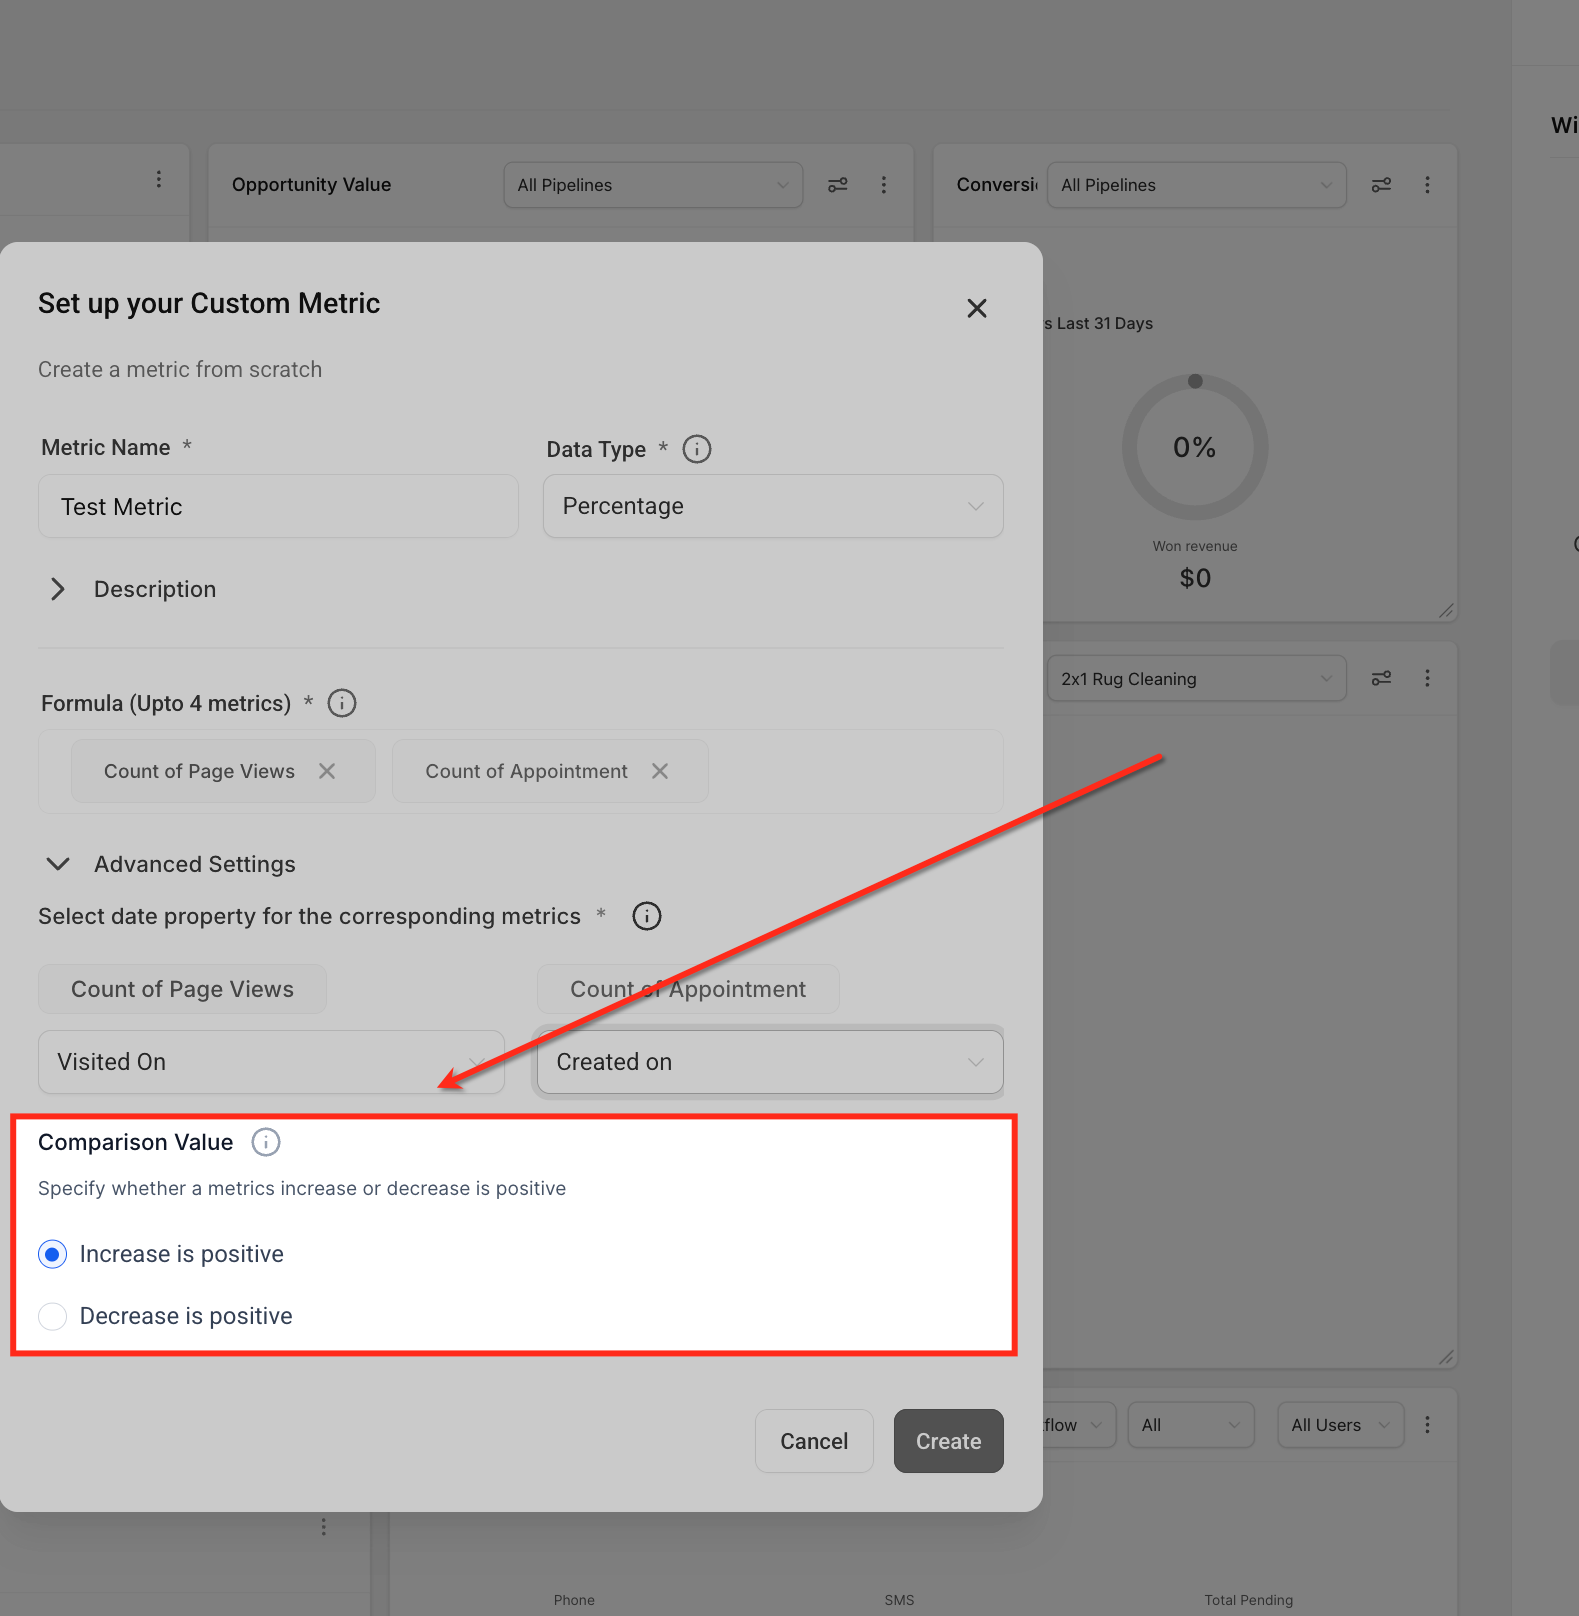
Once the details, formula, and settings are complete, click Create to save. The metric is now available to add as a widget on any dashboard or custom report.
Metric-level filtering lets you narrow any single metric in your formula, without affecting the others. Filter leads by tag, opportunities by pipeline or owner, calls by staff member, and more.
From your Dashboard, enter Edit Mode, click Add Widget, and open an existing custom metric or create a new one.
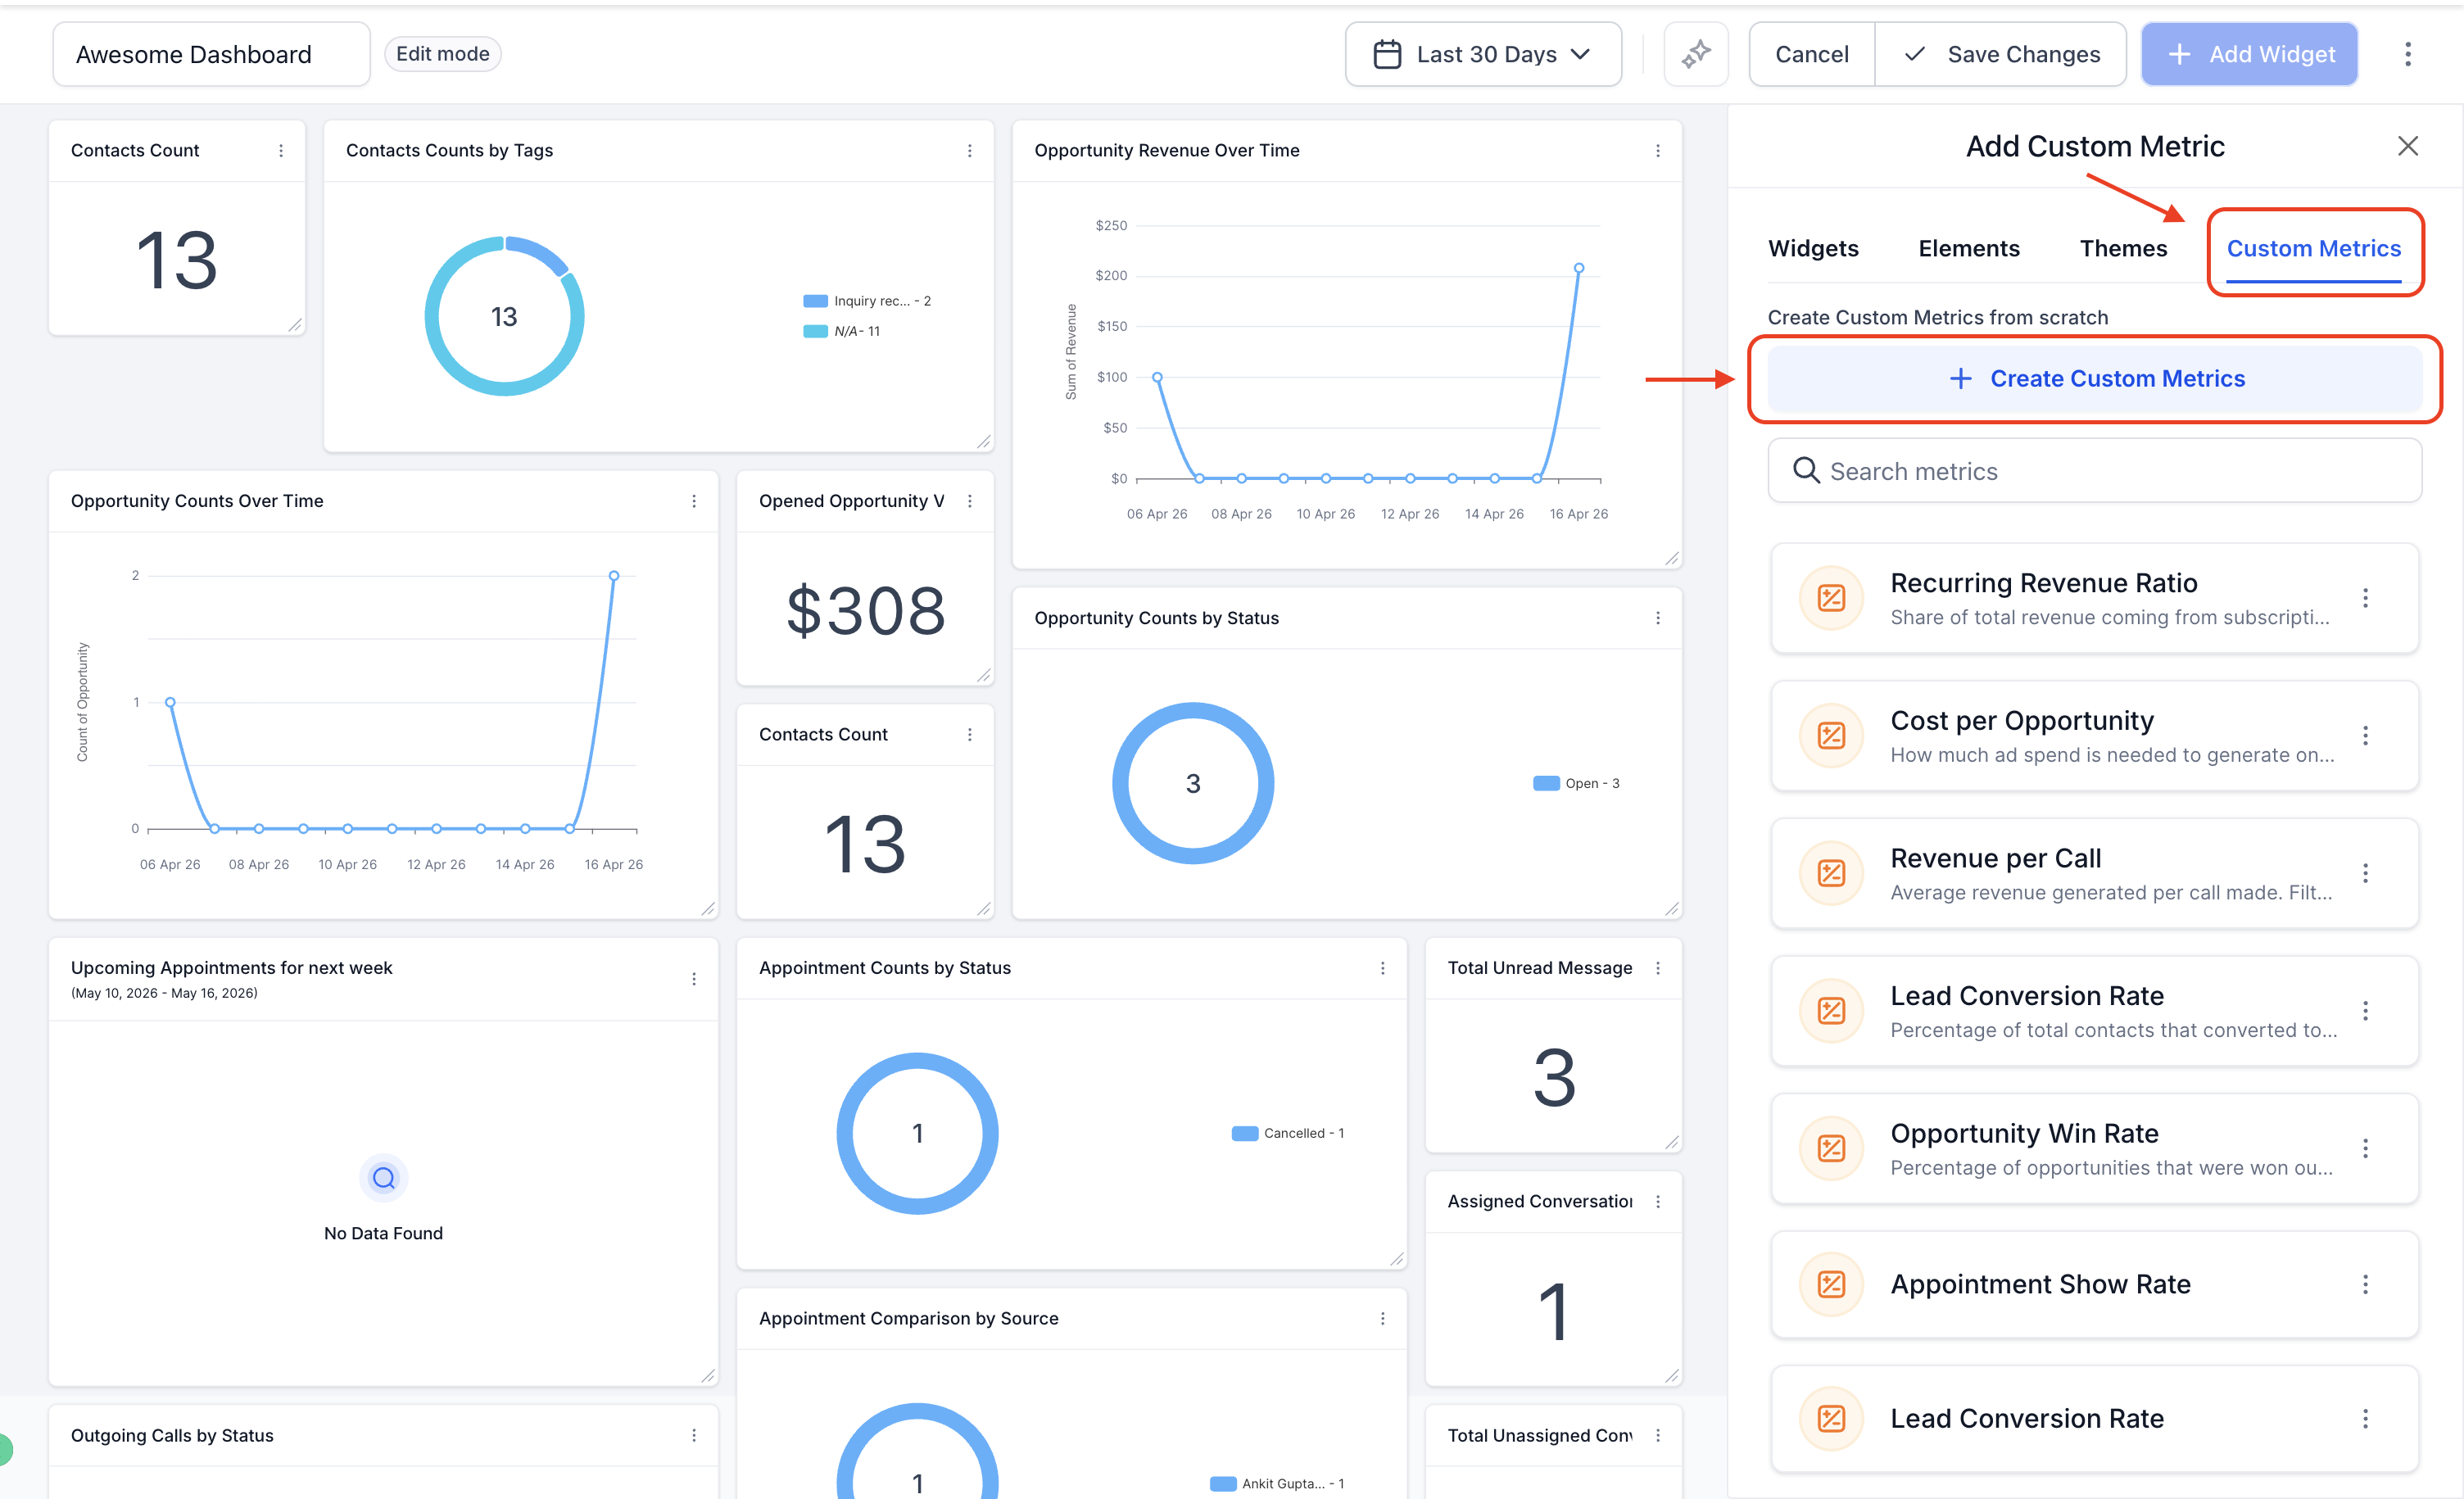
In the formula builder, add your metric tokens as usual.
Tip: Click any metric token in your formula to add filters and customize how that specific metric's data is calculated.
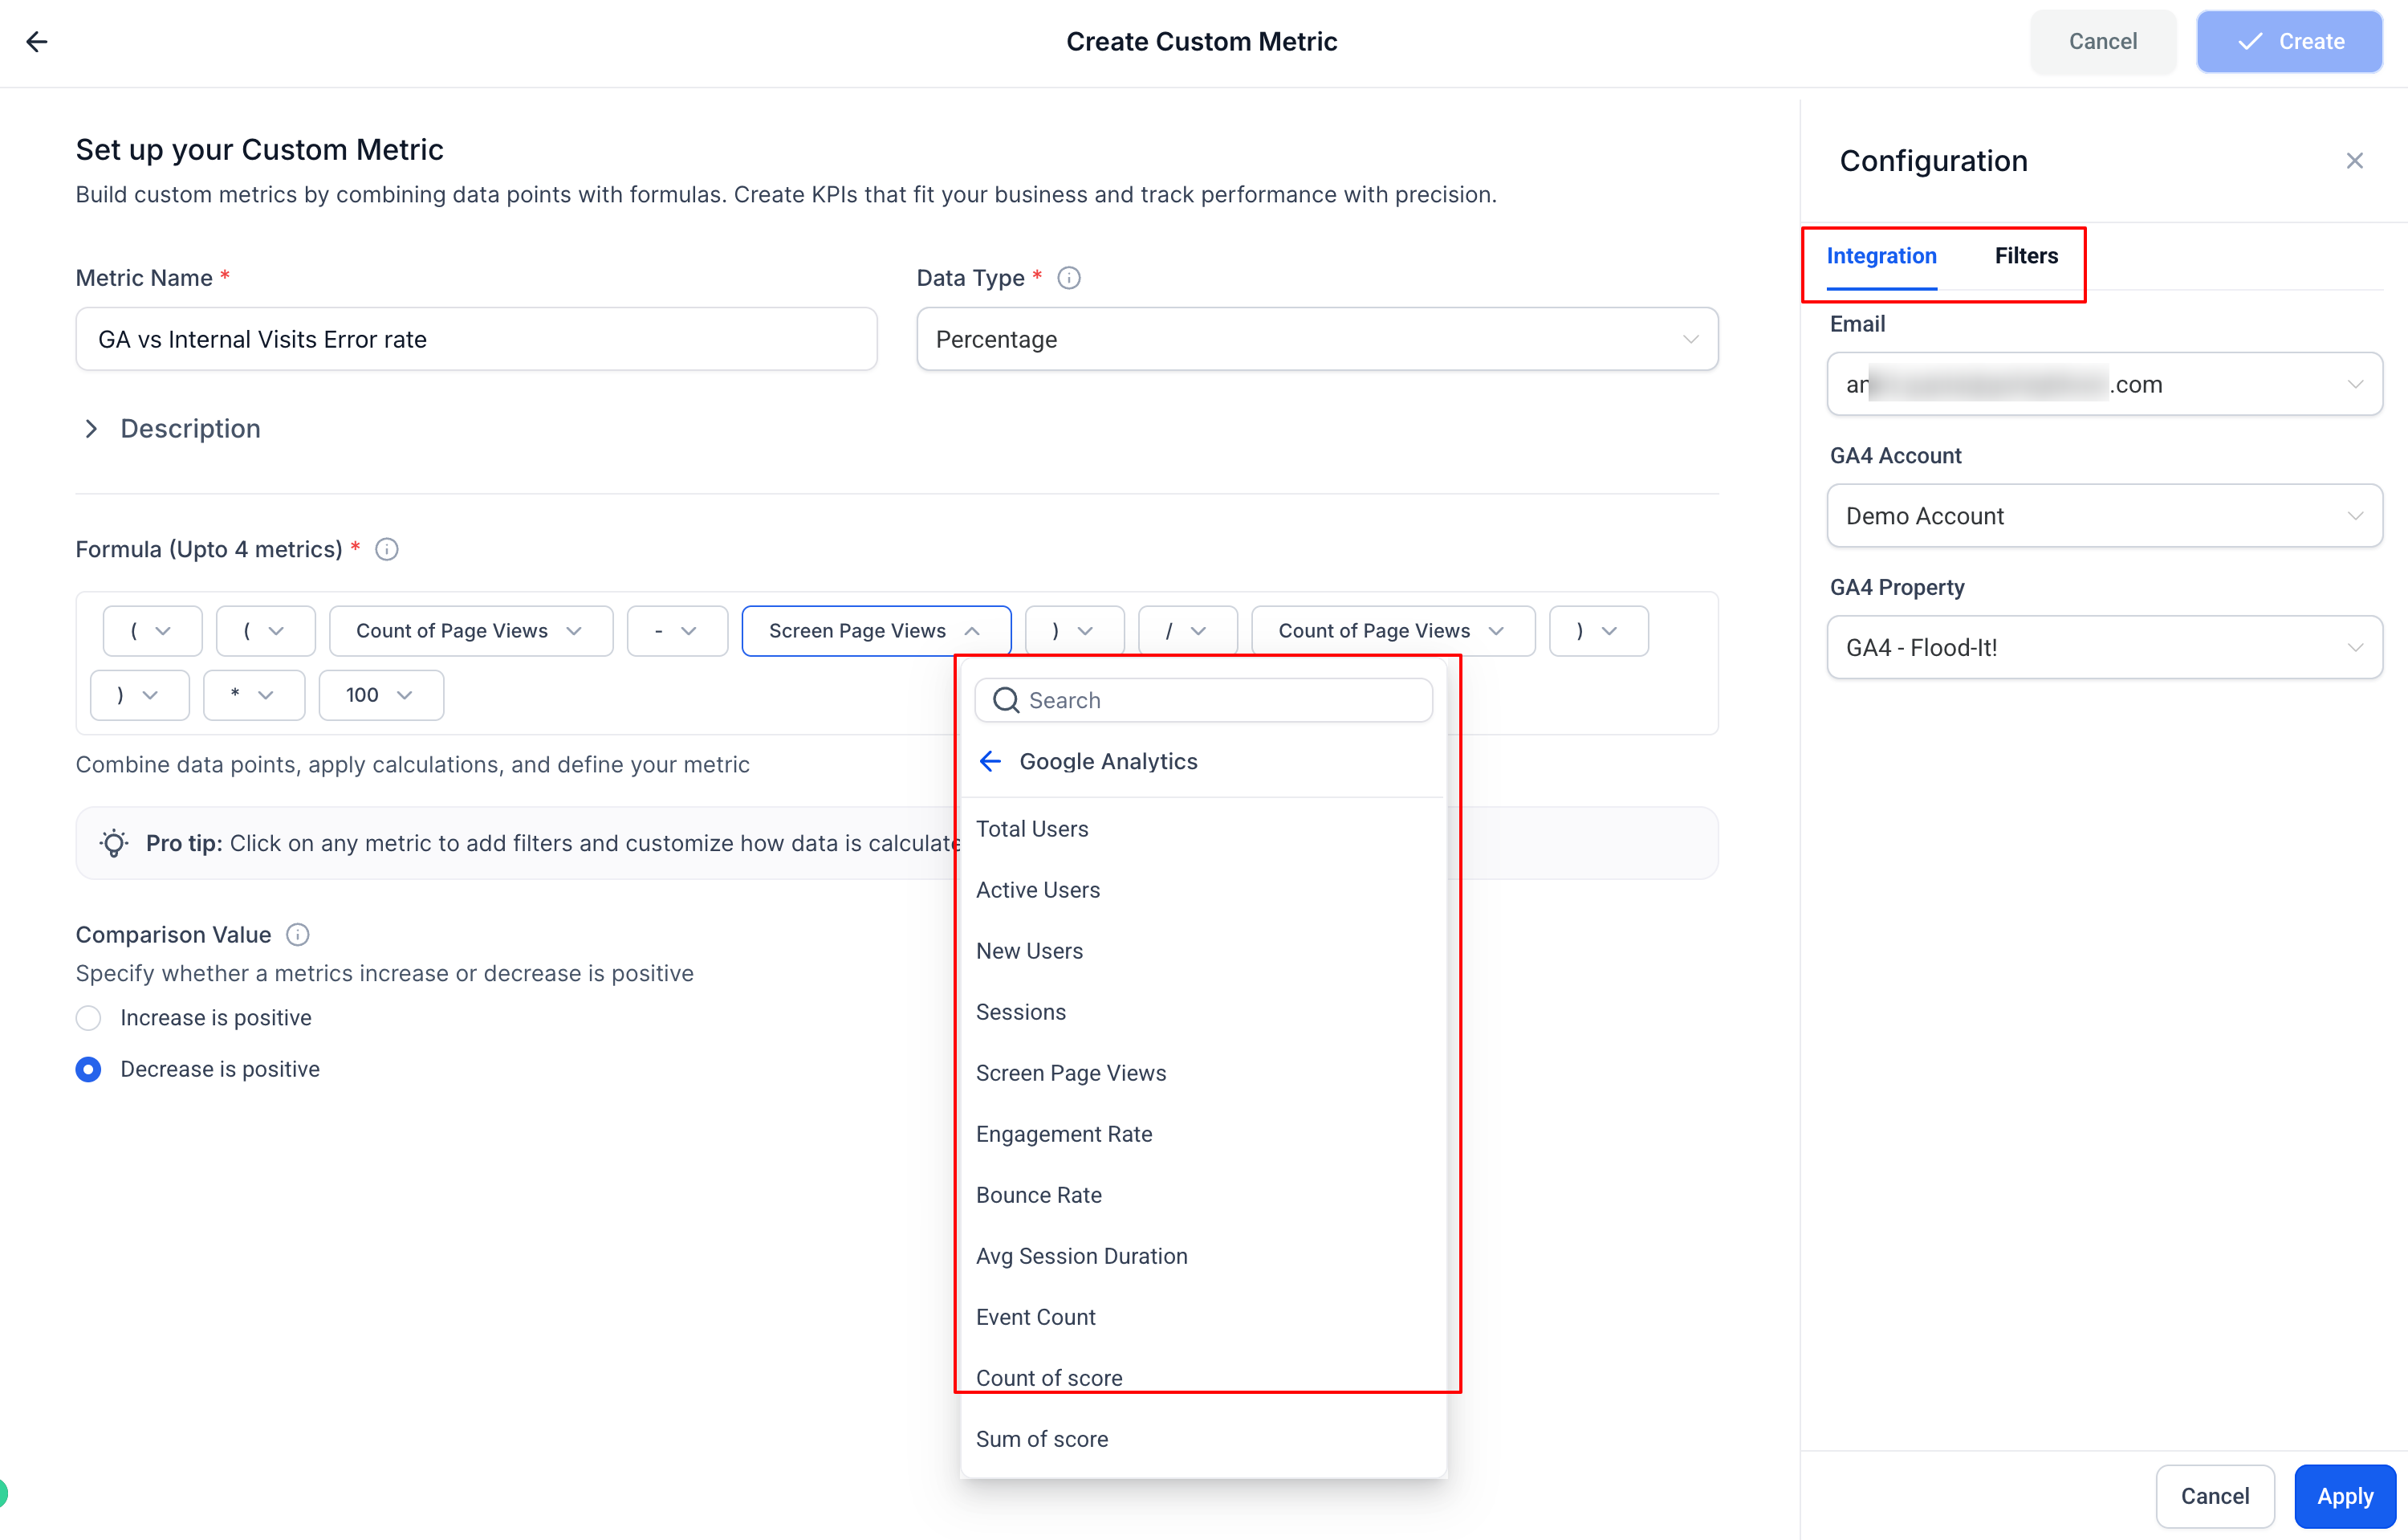
Click a metric token in your formula. A Configuration panel opens on the right showing a Filters tab.
In the Configuration panel:
Applying to confirms which metric you're filtering.
Date Property lets you choose the date field the metric should calculate on (for example, Created On).
Under the filter row, pick a filter attribute (Tag, Pipeline, Owner, Source, and so on) from the first dropdown.
Pick an operator (Is one of, Is not, and similar).
Select or enter the filter value.
Click + AND to add another condition to the same metric.
Click + Add Filter to add another filter row.
Once your filters are set, click Update at the top right. Metric tokens with an active filter show a filter icon on their badge, so you can spot filtered metrics at a glance.
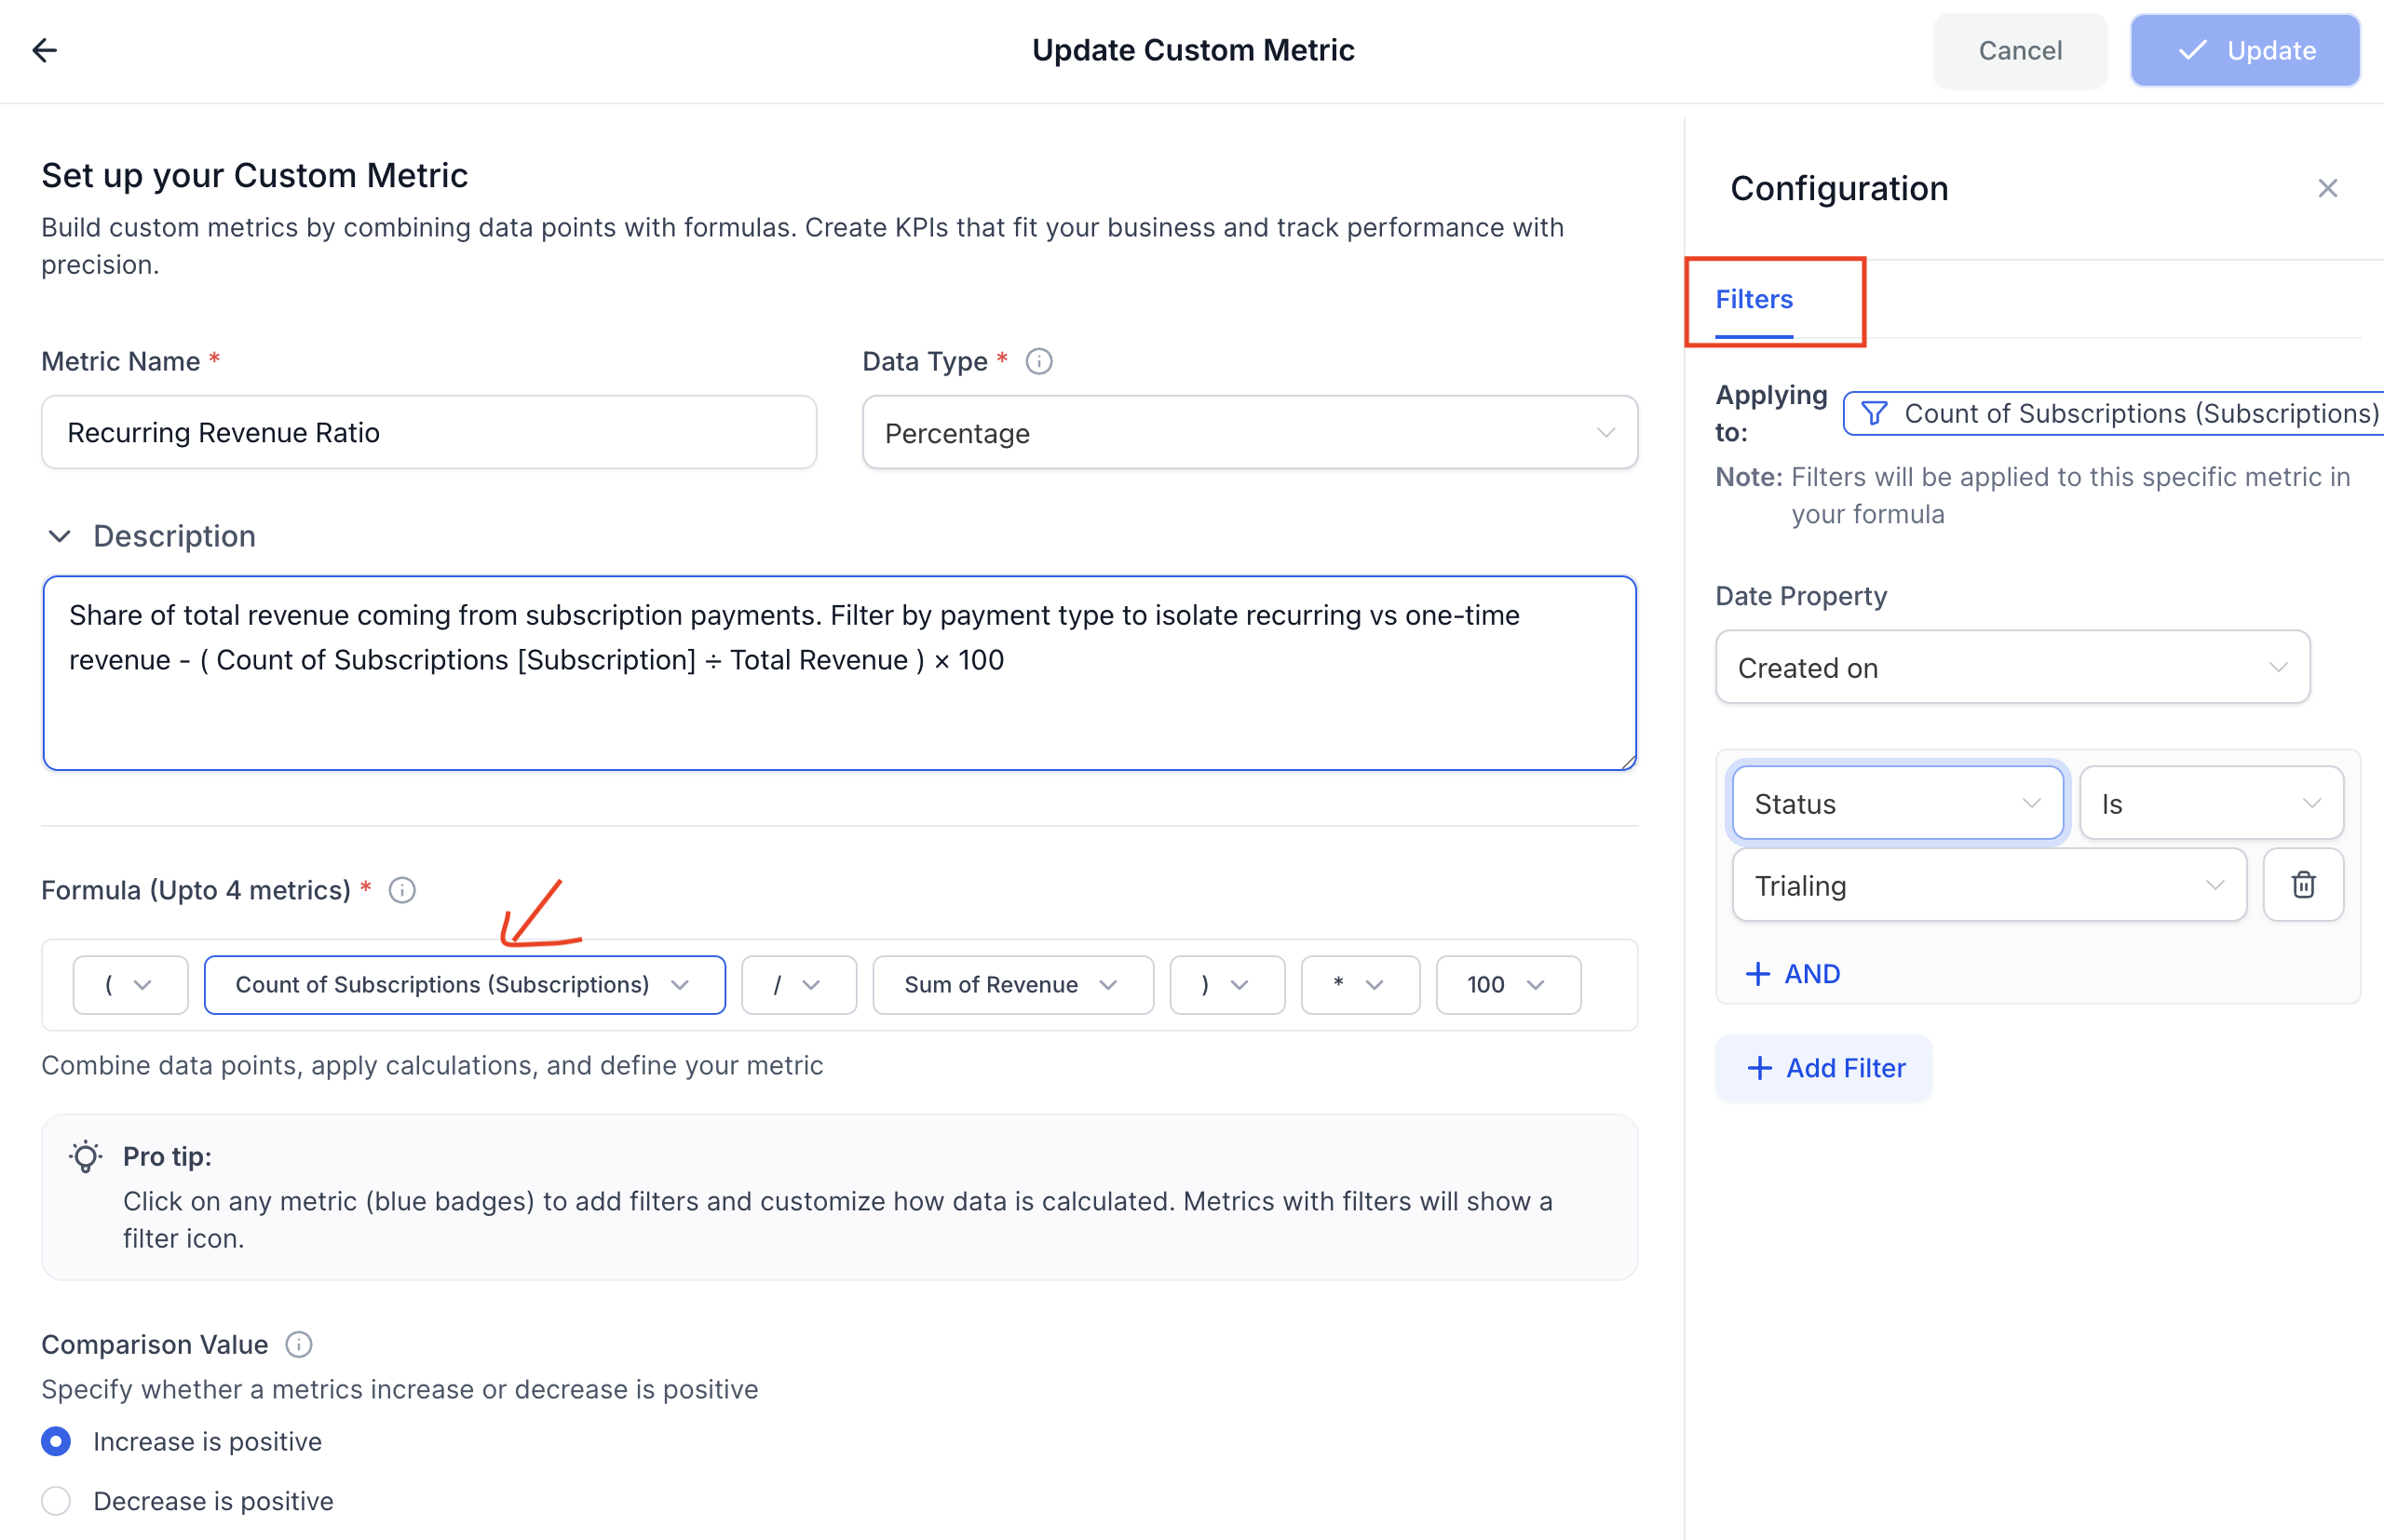
Filters apply only to the specific metric token they're set on. Every other metric in the same formula is unaffected, and each metric can carry its own independent set of AND conditions.
Custom Metrics can pull Meta Ads numbers directly into a formula alongside your CRM data, so you can see ad performance and patient outcomes on the same widget.
In the Custom Metric builder, click inside the formula field to open the metric picker.
Select Meta Ads from the metric categories list. Available metrics include Sum of Spend, Sum of Ad Clicks, Sum of Impressions, Sum of Conversions, Sum of Reach, Sum of Website Purchases, and average/min/max Cost Per Click, Cost Per Conversion, Cost Per Mille, and Click-Through Rate.
Select the metric you need and combine it with other metrics using operators.
Example: Sum of Spend (Meta) / Sum of Conversions tracks your cost per conversion from Meta campaigns, right on the dashboard.
Make sure Meta Ads is connected under Settings > Integrations before its metrics appear in the picker.
Google Analytics can also feed a Custom Metric formula, so you can build cross-channel KPIs like cost per consult without leaving Aesthetix CRM.
In the Custom Metric builder, click inside the formula field to open the metric picker.
Select Google Analytics from the metric categories list to expand the available GA metrics.
Select the GA metric you need and combine it with your CRM metrics.
Example: Sum of Spend (GA) / Count of Opportunities tracks cost per opportunity by combining ad spend with your pipeline data.
Make sure your Google Analytics account is connected under Settings > Integrations before GA metrics appear in the picker.
Numeric and monetary custom fields you've already created for Contacts or Opportunities can also feed a Custom Metric formula, not just filter or group your records. A field like treatment cost, package value, or projected case size becomes a metric you can sum, average, or compare, without exporting it to a spreadsheet first.
What's supported:
Objects: Contact and Opportunity custom fields.
Field types: Number and Monetary custom fields.
Aggregations: Sum (adds all applicable values together), Min (the lowest applicable value), Max (the highest applicable value), Average (the mean of all applicable values).
Eligible custom fields become available as metrics automatically as soon as you create them. There's no separate setting to turn this on.
To use a custom field in a formula:
In the Custom Metric builder, click inside the formula field to open the metric picker.
Use the Field dropdown to select the custom field you want to measure, such as Treatment Cost.
Use the Aggregation dropdown to choose Sum, Min, Max, or Average.
Combine the result with other metrics and operators as needed.
Example: Average(Treatment Cost) surfaces the average treatment value across your Opportunities. Add a filter (see Adding Filters to a Metric above) to narrow it to a specific pipeline, tag, or owner.
Custom field metrics work the same way in Dashboard widgets and Custom Reports, so the same field can answer different reporting questions depending on which aggregation you apply.
Custom values let you reuse the same dashboard or report across different locations or users, without manually retyping details like a name, address, or phone number. Instead of typing a value directly into a widget, you insert a placeholder, such as {{ location.name }}, that resolves to the correct information automatically whenever the dashboard is viewed.
Where custom values are supported: wherever you see a {} button next to a text input, including:
Widget conditions
Embed URLs
Title elements
Text box elements
Three groups of values are available from the {} picker:
Location: Location Id, Location Name, Email, Phone, Website, Address, City, State, Country, Postal Code, and Timezone, pulled from whichever account is viewing the dashboard.
User: User Id, Email, Phone, Role, Type, First Name, Last Name, Name, and Full Name, pulled from the logged-in user.
Custom values: any values you've created under Settings > Custom Values, organized by folder.
You can search across all three groups from the search bar at the top of the picker.
To insert a custom value in a widget condition:
Open a dashboard and click Edit Dashboard.
Add or edit a widget and go to its Conditions tab.
Set the field and operator, then click the {} button in the value input.
Browse or search for the Location, User, or Custom value you want, and select it. The token is inserted automatically.
Click Save.
To insert a custom value in a dashboard element (Embed, Title, or Text box):
Open a dashboard and click Edit Dashboard.
Add or select the Embed, Title, or Text box element.
Click the {} button next to the relevant field.
Browse or search for the value you want, then select it.
Click Save, then switch to view mode to confirm the token resolves correctly.
You can mix static text and tokens in the same field, for example: "Welcome to {{ location.name }}. Your address is {{ location.address }}."
If a token has no value to resolve, such as a custom value that hasn't been filled in for that location, it displays as blank rather than an error. To avoid blank placeholders, keep the relevant profile fields complete under Settings, and make sure any referenced custom value has been created and filled in for every location that uses the dashboard.
Only editors can insert or change custom values; viewers only see the resolved result. Custom values aren't supported directly in Image elements, though an image can still be shown by pasting its URL into an Embed element.
Metric Name | Formula | Filter |
|---|---|---|
Consult Win Rate | Count of Opportunity [Won] / Count of Opportunity [Total] x 100 | Filter by Pipeline or Owner |
Patient Ratio | Count of Contacts [Tag = Patient] / Count of Contacts x 100 | Tag = Patient |
Lead Conversion by Source | Count of Opportunity [Won] / Count of Contacts x 100 | Contact Source = Facebook / Google |
Cost per Booked Consult | Sum of Spend (GA) / Count of Opportunity | (none) |
Cost per Conversion | Sum of Spend (Meta) / Sum of Conversions | (none) |
Revenue per Call | Total Revenue / Count of Calls | Filter by Call Made By |
Average Treatment Value | Average(Treatment Cost) | (none) |
These are starting points. Because a formula can combine up to four metrics with operators and constants, you can build almost any KPI your practice tracks, from cost-per-booked-consult to revenue-per-lead, as long as the underlying data sources are available.
Can I combine metrics that use different date properties, like Contact Created Date and Opportunity Closed Date? Yes. Each metric in your formula presents its own relevant date options in the dropdown, so you can select Created Date for one and Closed Date for another. Align your selections with the outcome you're actually trying to measure, otherwise the result may not reflect the KPI you intended.
How does the trend direction setting affect my dashboard? It controls whether an increase in the metric displays as positive or negative. If you set "Increase is positive" for revenue, growth shows as a positive trend. If you accidentally apply the same setting to something like response time, longer wait times would incorrectly display as "positive." Double-check that the setting matches what the metric actually measures.
What happens if I clone a metric and the underlying data changes later? A cloned metric stays linked to the original fields and sources it was built from. If a field is later removed, renamed, or its data type changes, the cloned metric can break or miscalculate. Edit the formula in the clone and re-map the affected fields to fix it.
Can I add filters to each metric in a formula independently? Yes. Each metric token has its own filter configuration. Clicking a token opens only that metric's filters, without touching any other metric in the same formula.
How many filter conditions can I add to one metric? As many as you need, using AND logic. Each condition is a separate attribute, operator, and value row within that metric's filter.
Do Meta Ads and Google Analytics metrics respect the dashboard's date range? Yes. Like every other metric in the formula builder, Meta Ads and Google Analytics values are calculated based on whatever date range is set on the dashboard or report.
Does a filter affect the whole formula or just one metric? Just the metric token it's configured on. The other metrics in the same formula are unaffected.
Why isn't my Google Analytics or Meta Ads data showing up in the metric picker? Check that the integration is connected under Settings > Integrations. Google Analytics and Meta Ads both need to be connected before their metrics become available in the custom metric builder.
Is there a limit to how many metrics I can combine in one formula? Yes, a formula can combine up to four metrics using operators and constants.
Where can I see the custom metric once it's built? It's available to add as a widget on any dashboard or custom report, showing live results based on the formula, filters, and settings you defined.
Can I use a custom field, like treatment cost or package value, directly as a metric? Yes. Number and Monetary custom fields on Contacts and Opportunities can be aggregated as Sum, Min, Max, or Average and used in a formula, a Dashboard widget, or a Custom Report, the same way you'd use any other metric.
Do I need to turn anything on before a new custom field becomes available as a metric? No. Eligible Number and Monetary custom fields become available as metrics automatically as soon as you create them.
What is a custom value in a dashboard or report?
It's a placeholder, like {{ location.name }}, that Aesthetix CRM replaces with the real value, such as a location's address or a logged-in user's name, whenever the dashboard is viewed. It lets one dashboard adapt automatically to whichever account or user is viewing it.
Where can I use custom values on a dashboard? In widget conditions, and in Embed, Title, and Text box elements, anywhere you see the {} button next to a field.
What happens if a custom value token has no data to resolve? It displays as blank. Make sure the relevant profile fields are filled in under Settings, or that the custom value itself has been created and populated for that location.
