Meta Ads and Google Analytics widgets let you pull ad performance and website traffic data straight into Aesthetix CRM, right alongside your leads, appointments, and revenue. Instead of logging into Meta Business Suite or Google Analytics separately, you can build one Dashboard (or Custom Report) that shows how your ad spend and site traffic connect to actual booked consults. Both widget libraries live in the same places: Dashboard and Reporting > Custom Reports, under the Widgets & Charts area.
Before you add either widget type, confirm the underlying connection is in place:
Meta Ad Widgets require a connected Meta (Facebook/Instagram) ad account. Connect it under Settings > Integrations > Facebook, or from Ads Manager if you haven't linked an ad account yet. During setup, Meta's own consent screen will reference "LeadConnector," this is expected and simply reflects the connection name used behind the scenes. Grant permissions for the Business Manager, ad account, and pages you plan to report on.
Google Analytics Widgets require a connected GA4 property and data stream. Connect it under Settings > Integrations > Google Analytics. Confirm you're using the correct Google account and that it has view access to the property and stream you want to report on. Google Analytics 4 (GA4) is the only supported version; Universal Analytics (UA) properties are not supported.
You'll also need dashboard/report permissions: Edit access to add or configure widgets on a dashboard, and the ability to Create or Schedule reports if you plan to send them out automatically. Users with View-only access can see shared dashboards and received reports but can't change them.
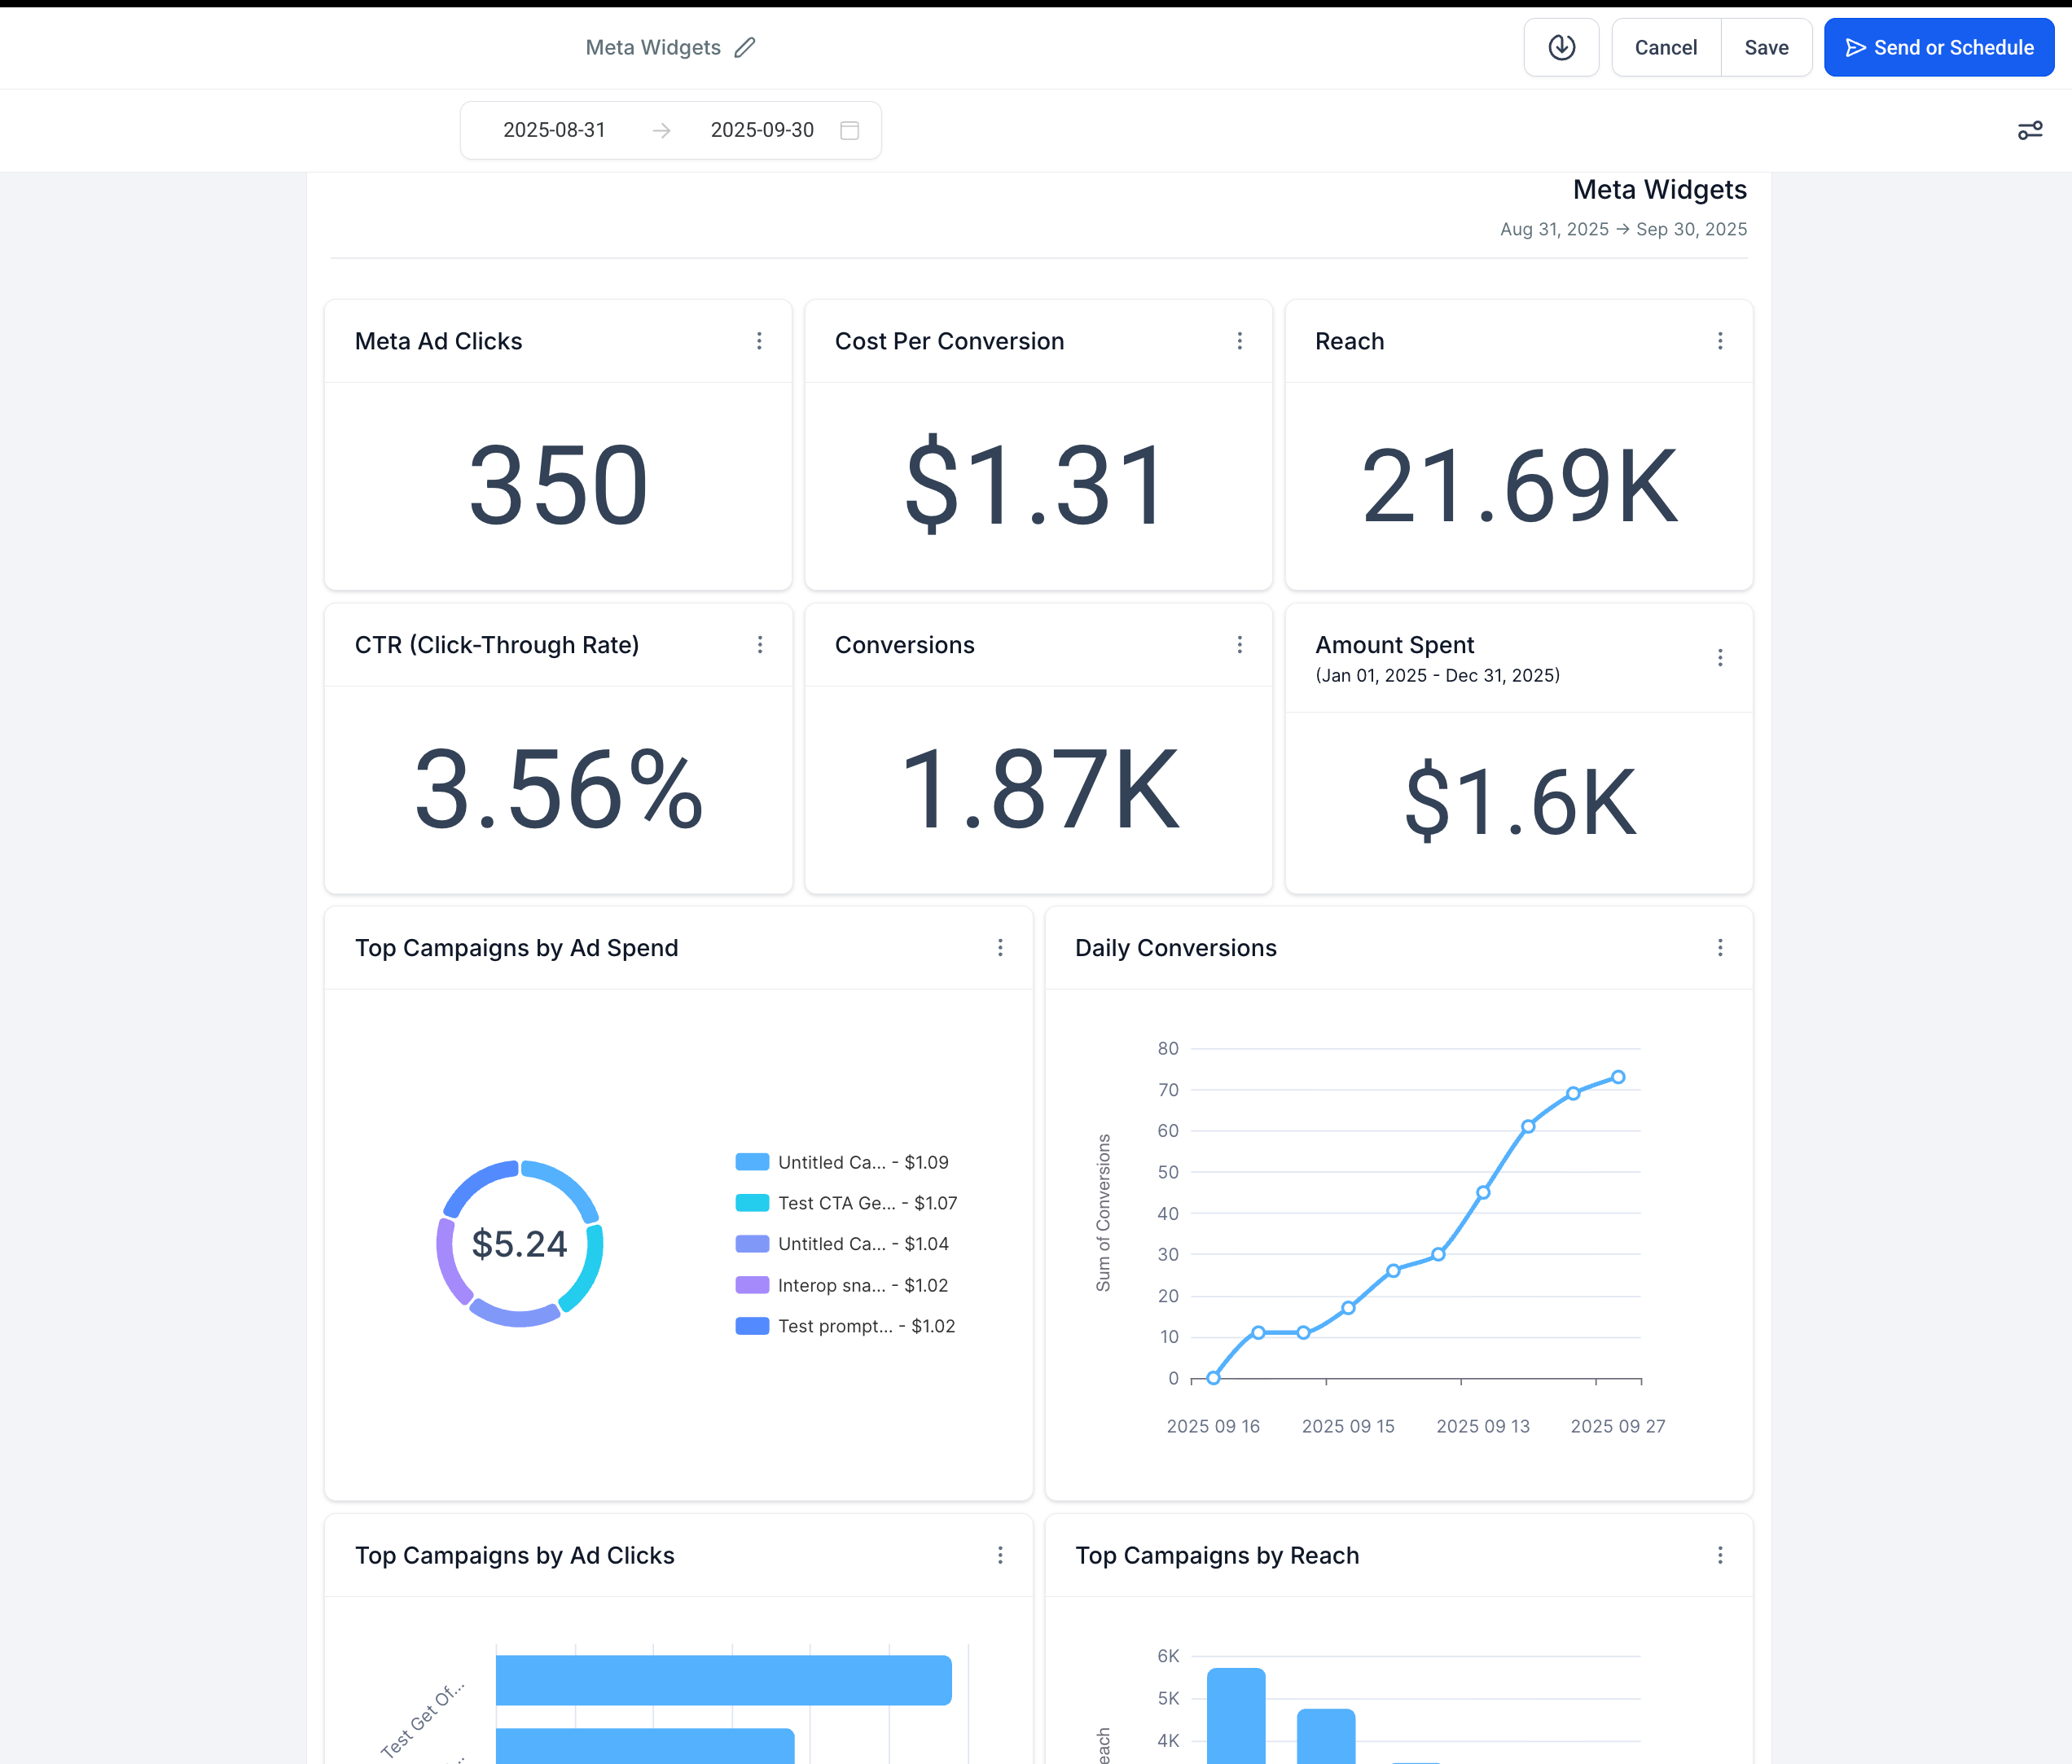
Meta Ad Widgets surface clicks, conversions, spend, and top-performing campaigns from your connected ad account. Viewing this next to your booked-consult and revenue numbers makes it easy to spot rising costs or a campaign that's quietly outperforming the rest, without exporting anything to a spreadsheet.
Metric | Definition |
|---|---|
Website Purchases | Purchases completed on your website from users driven by your Meta ad traffic. |
Conversions | Actions attributed to your ads (bookings, form fills, purchases) as defined by your Meta setup. |
Meta Ad Clicks | Total clicks on your Meta ads. |
Amount Spent | Total ad spend in the selected date range. |
Average CPC (Cost Per Click) | Average amount paid per click. |
Cost Per Conversion | Average cost to generate one conversion. |
Ad Impressions | Total number of times your ads were shown. |
Reach | Unique users who saw your ads. |
Average CPM (Cost Per Mille) | Average cost per 1,000 impressions. |
CTR (Click-Through Rate) | Percentage of impressions that resulted in a click. |
These table-style widgets automatically rank your campaigns so you can see what's working at a glance:
Widget | What it shows |
|---|---|
Top Campaigns by Ad Spend | Campaigns ranked by the highest advertising spend. |
Top Campaigns by Conversions | Campaigns that drove the most conversions. |
Top Campaigns by Website Purchases | Campaigns that resulted in the most website purchases. |
Top Campaigns by Ad Clicks | Campaigns that generated the most clicks on ads. |
Top Campaigns by Impressions | Campaigns with the highest number of ad impressions. |
Top Campaigns by Reach | Campaigns that reached the most unique users. |
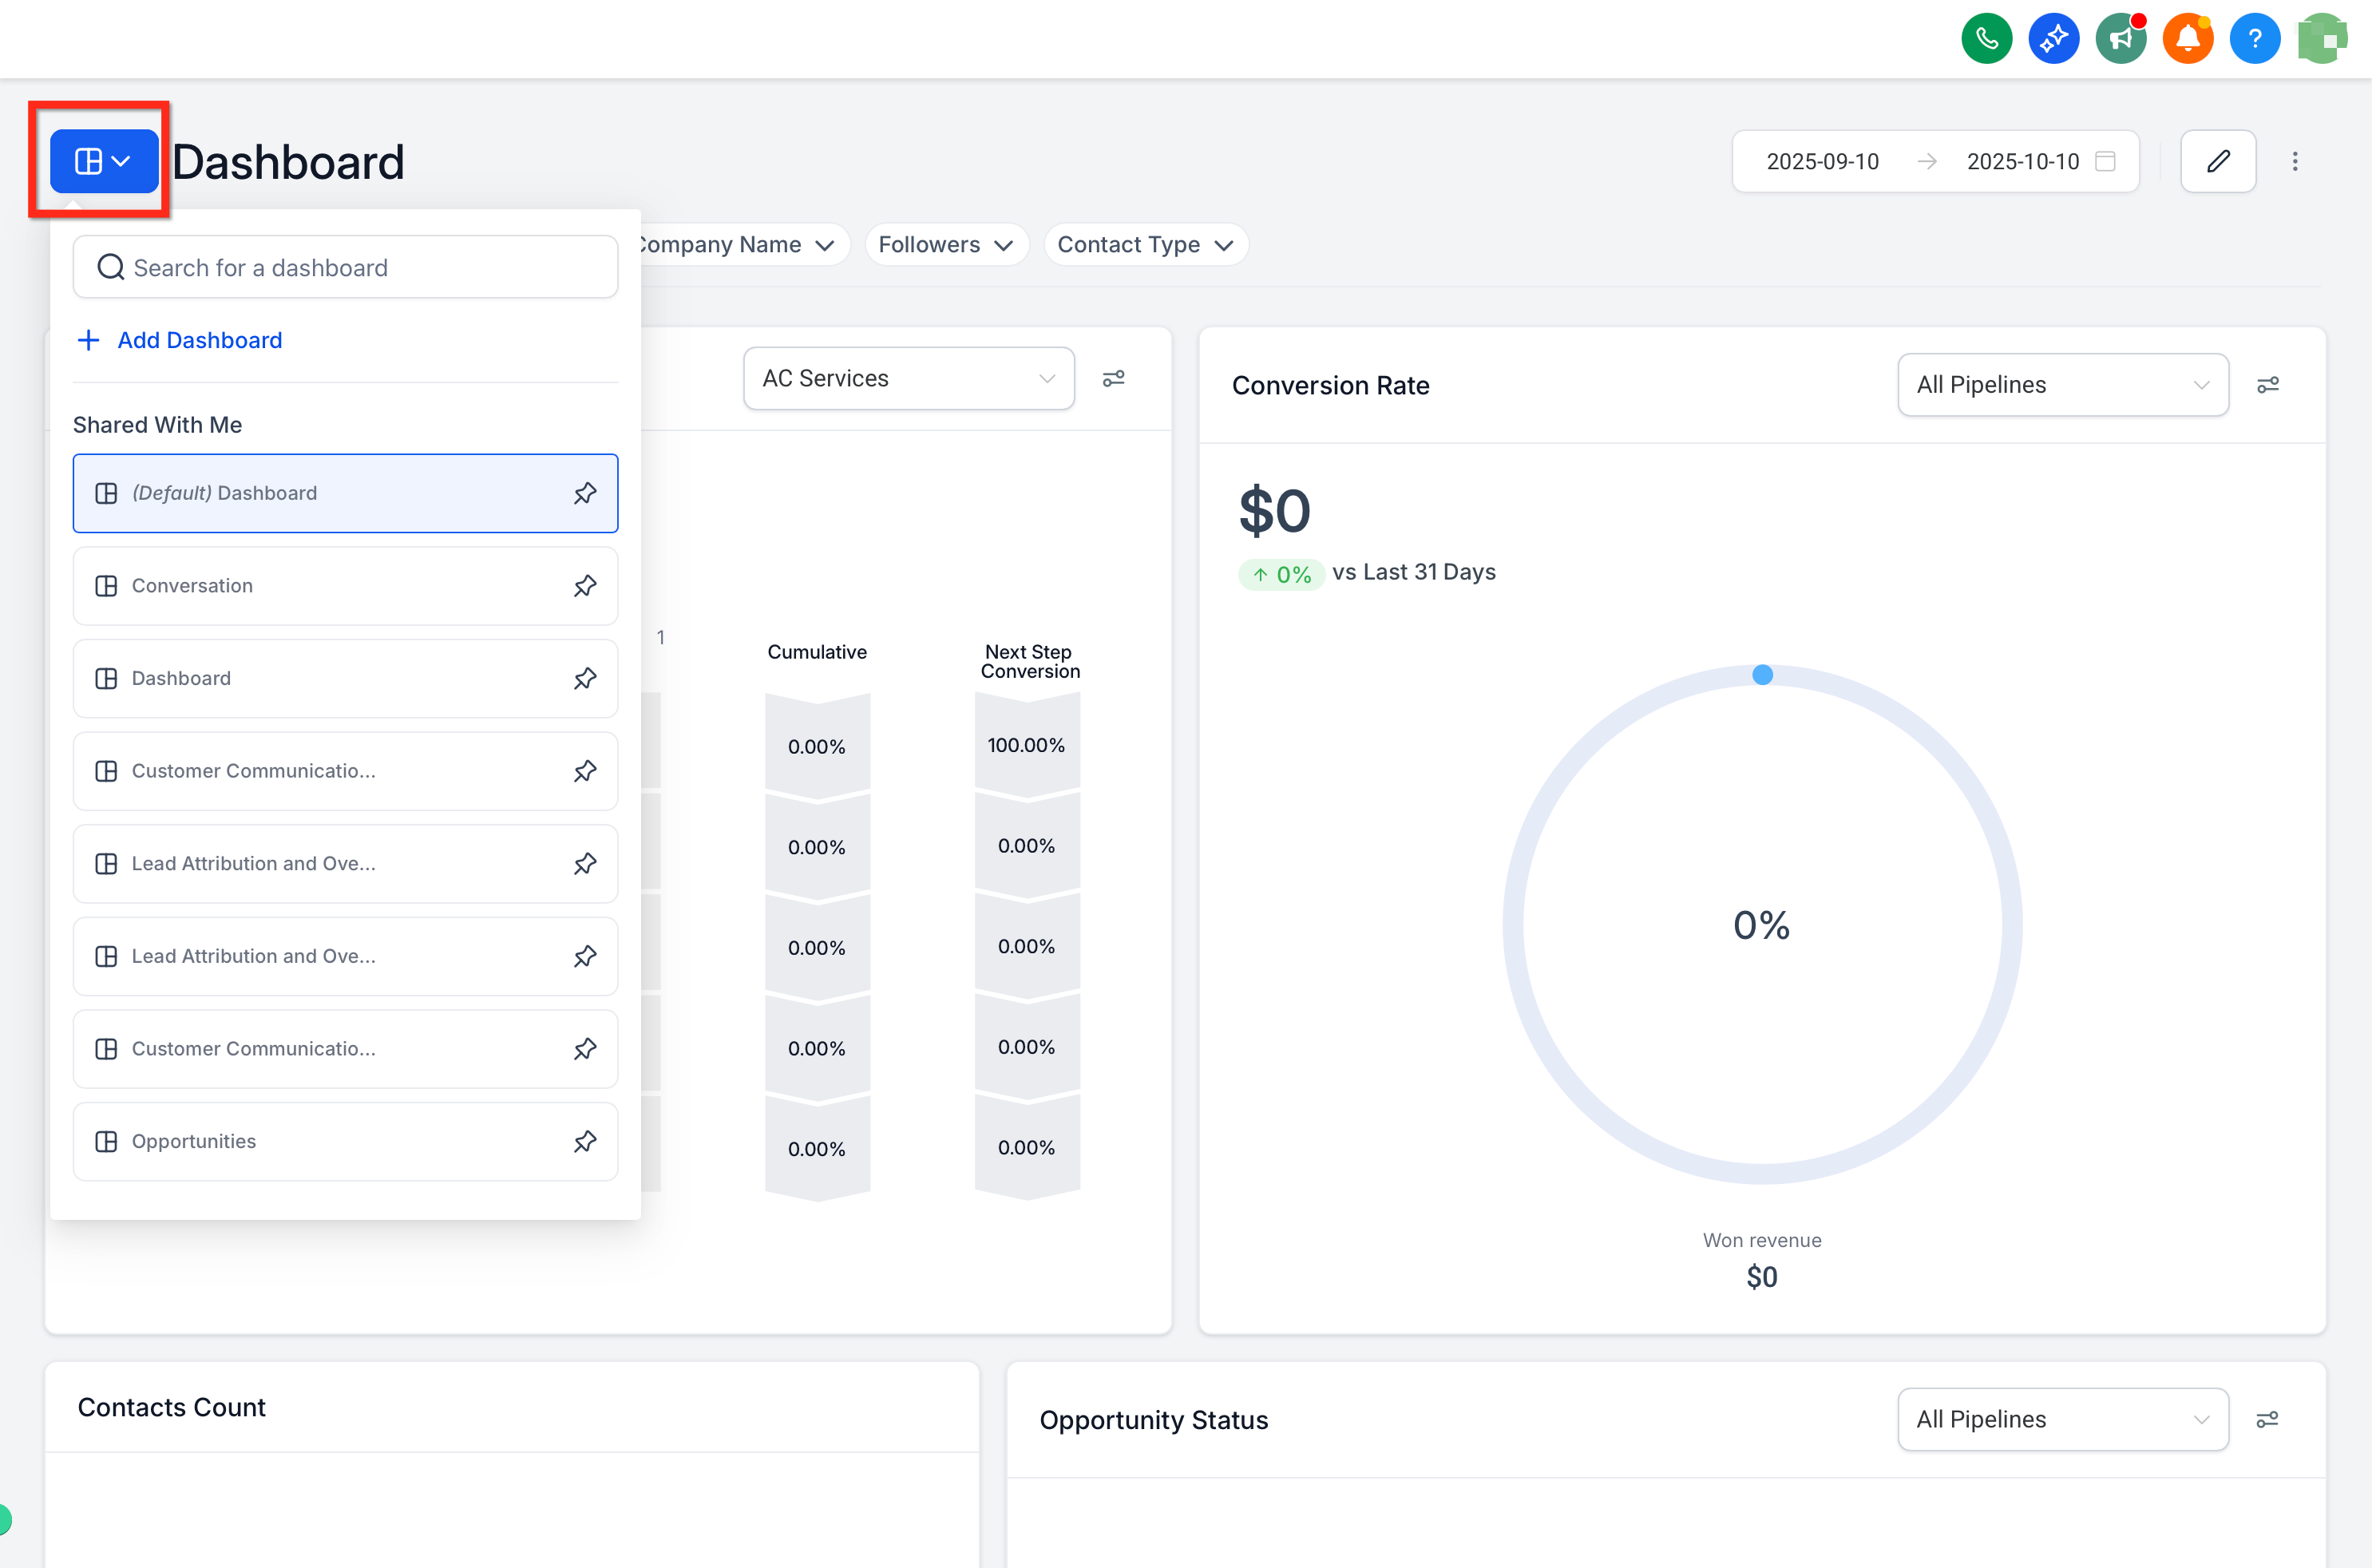
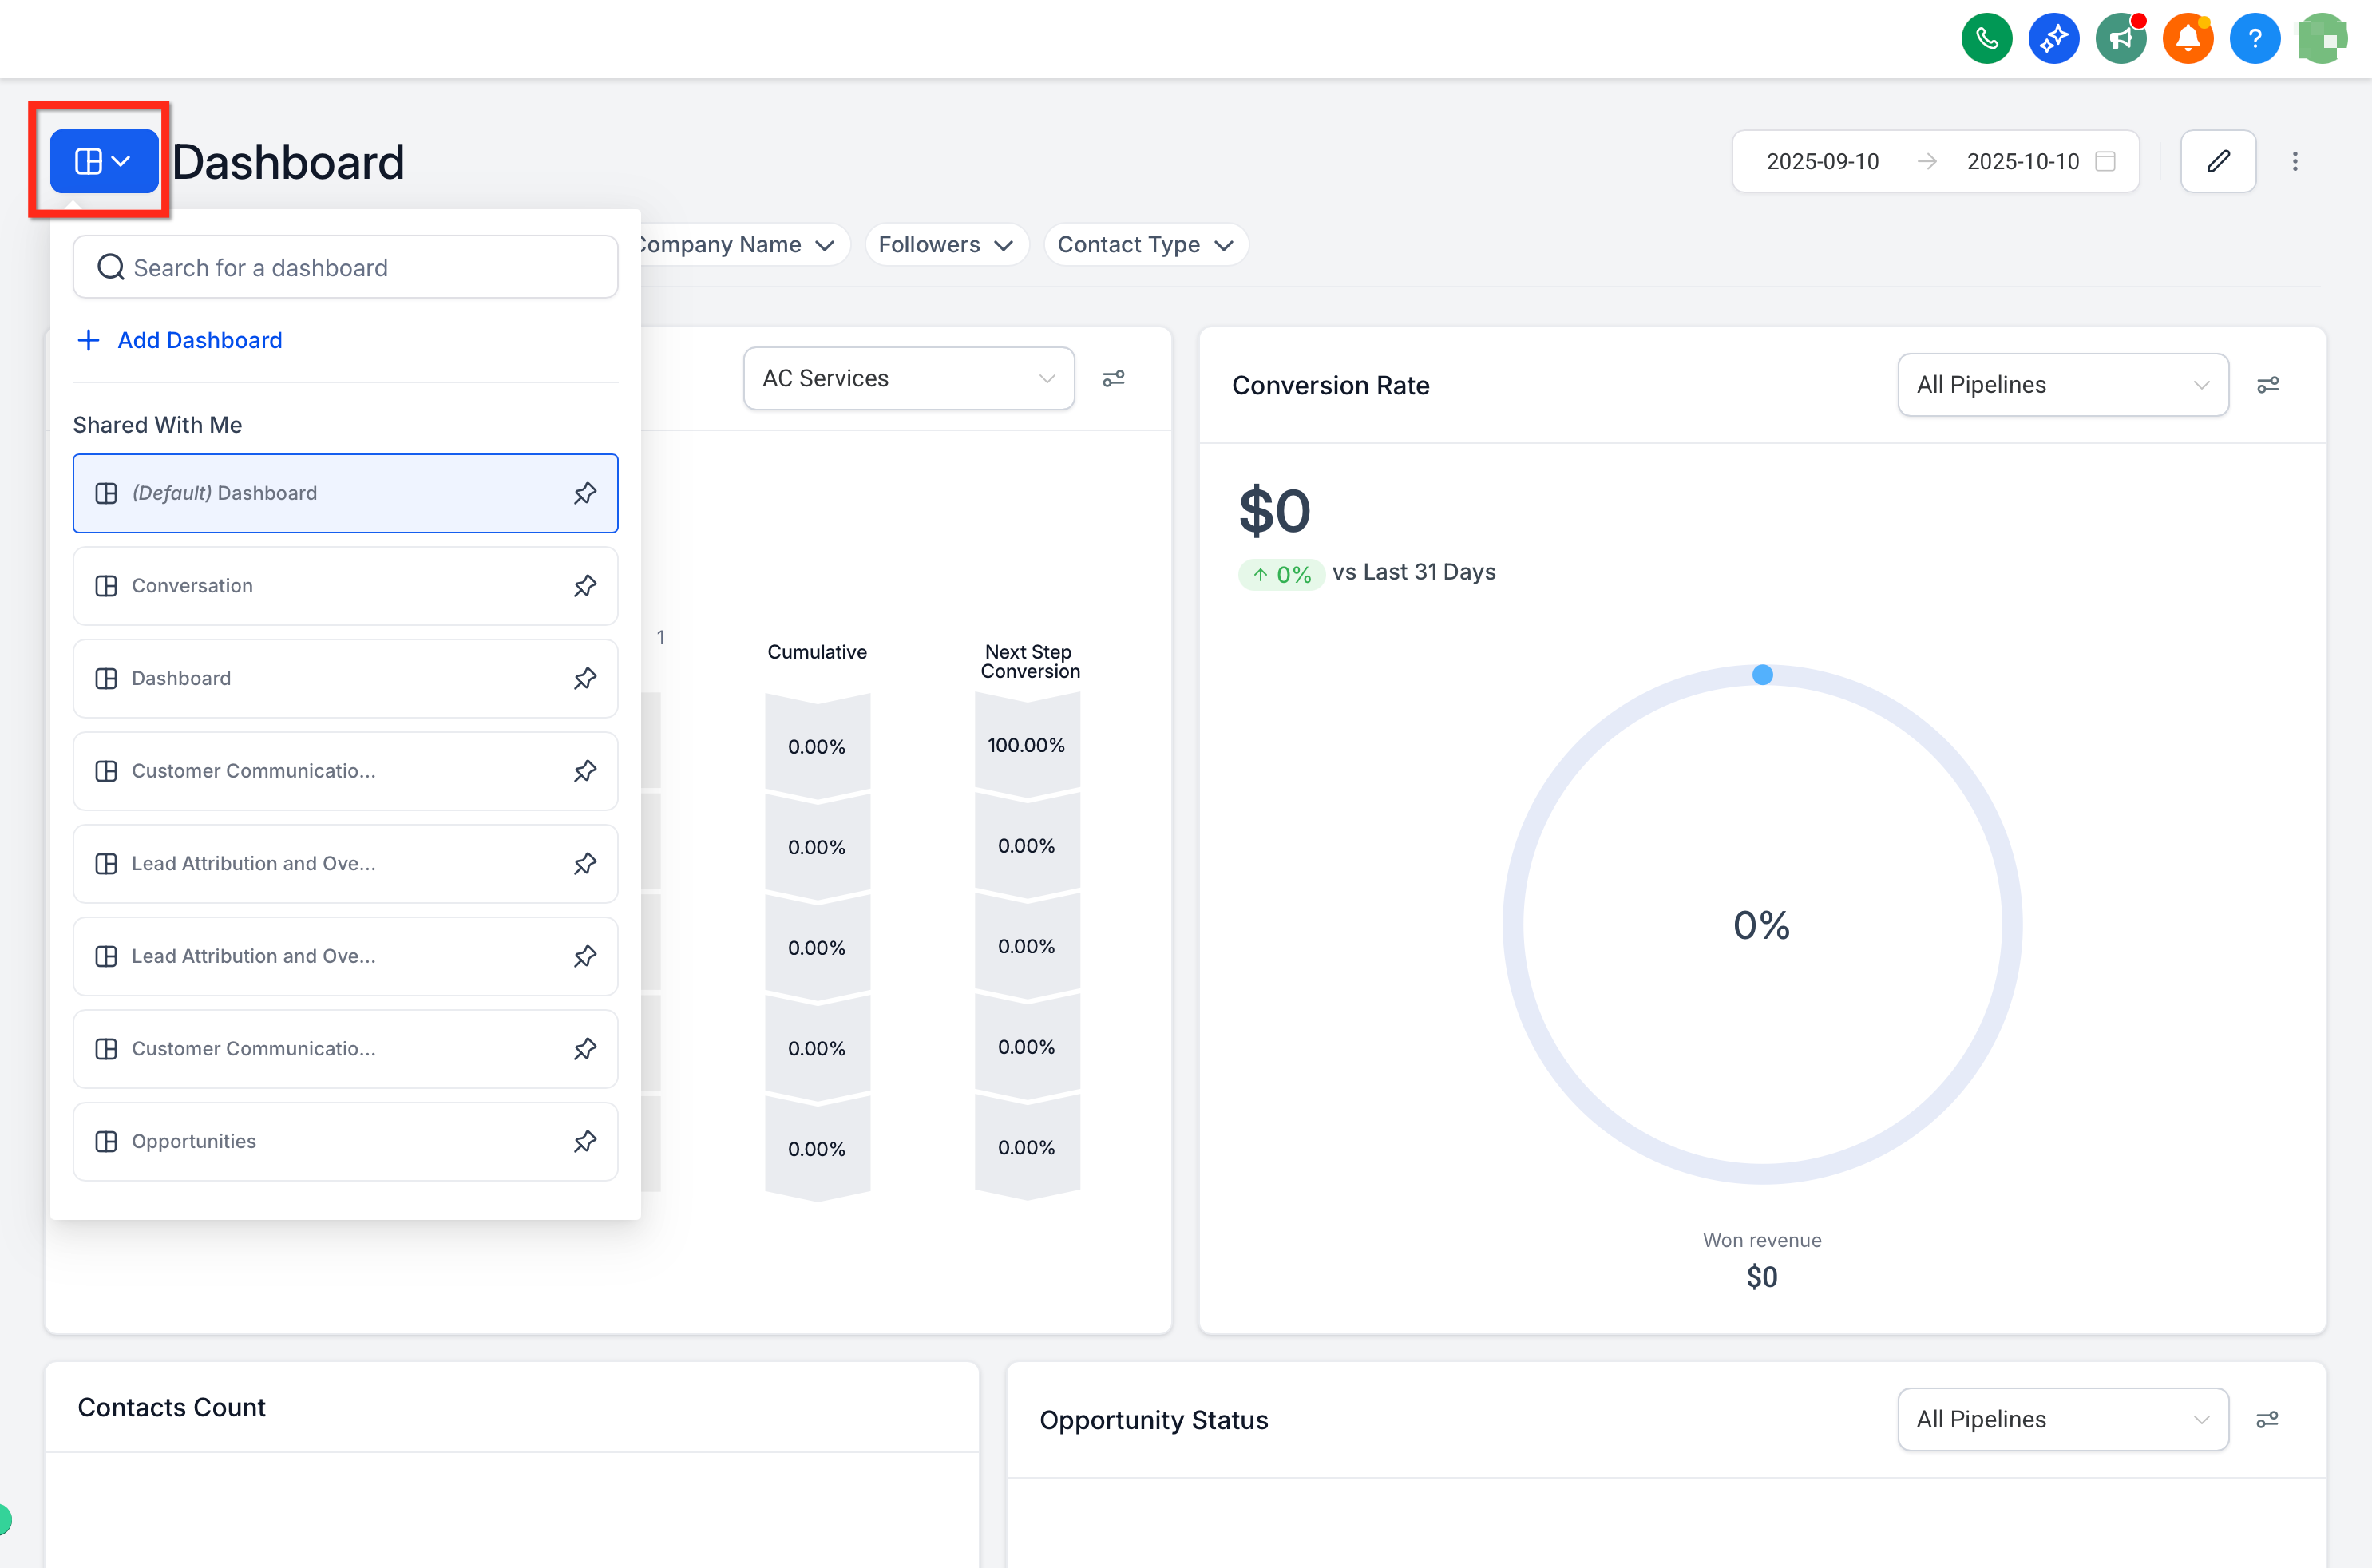
Open Dashboard and click the blue button in the top-left corner to select the dashboard you want to edit.
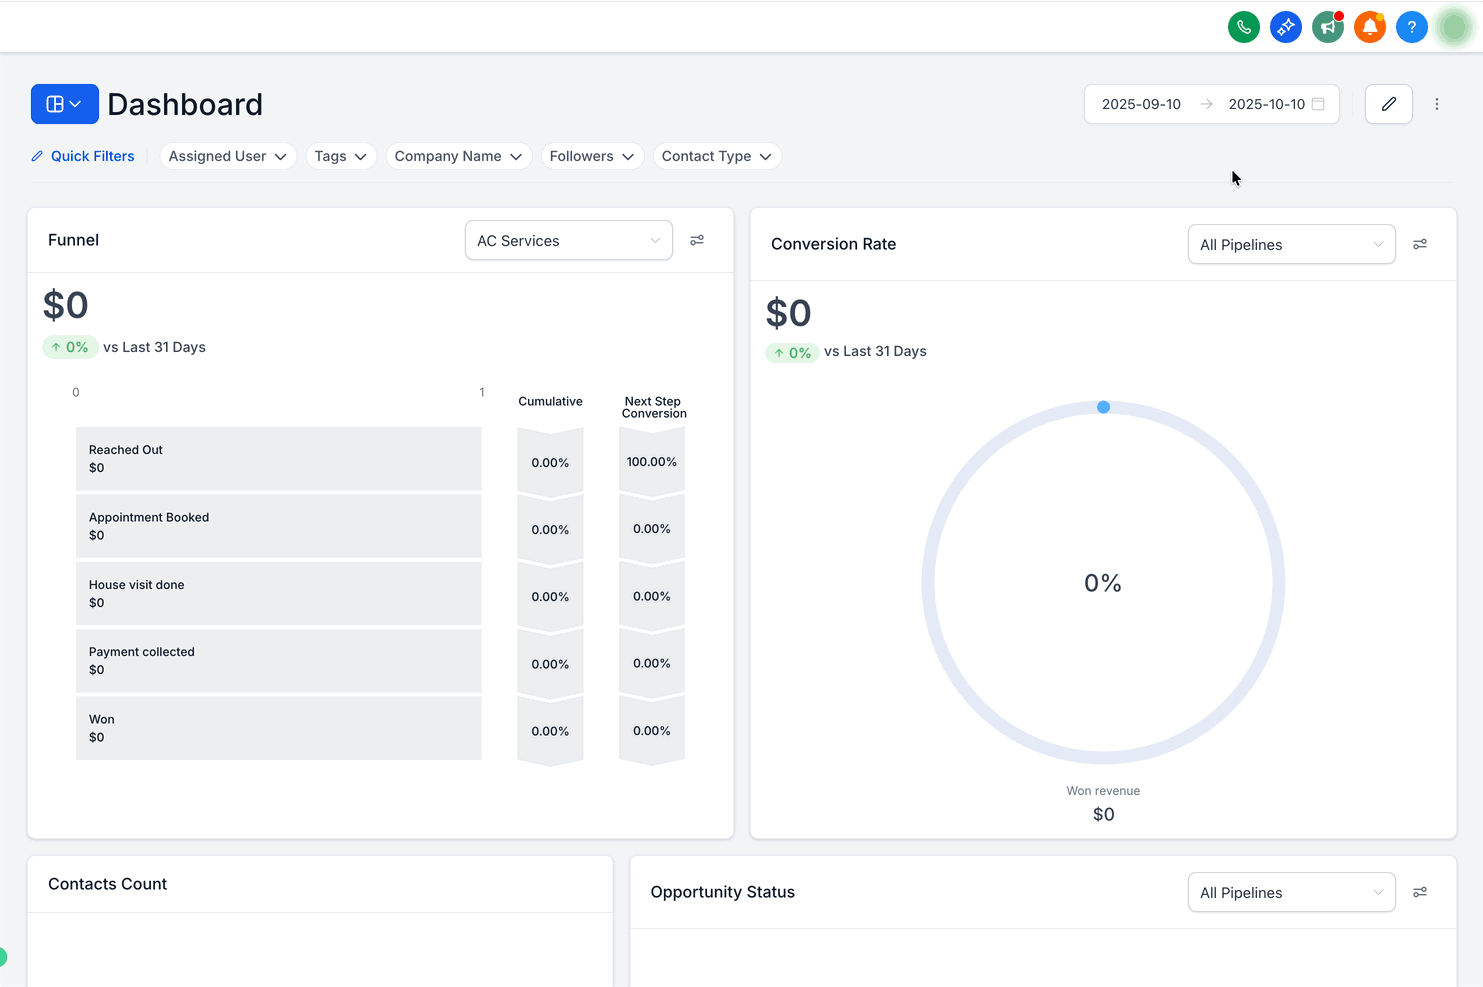
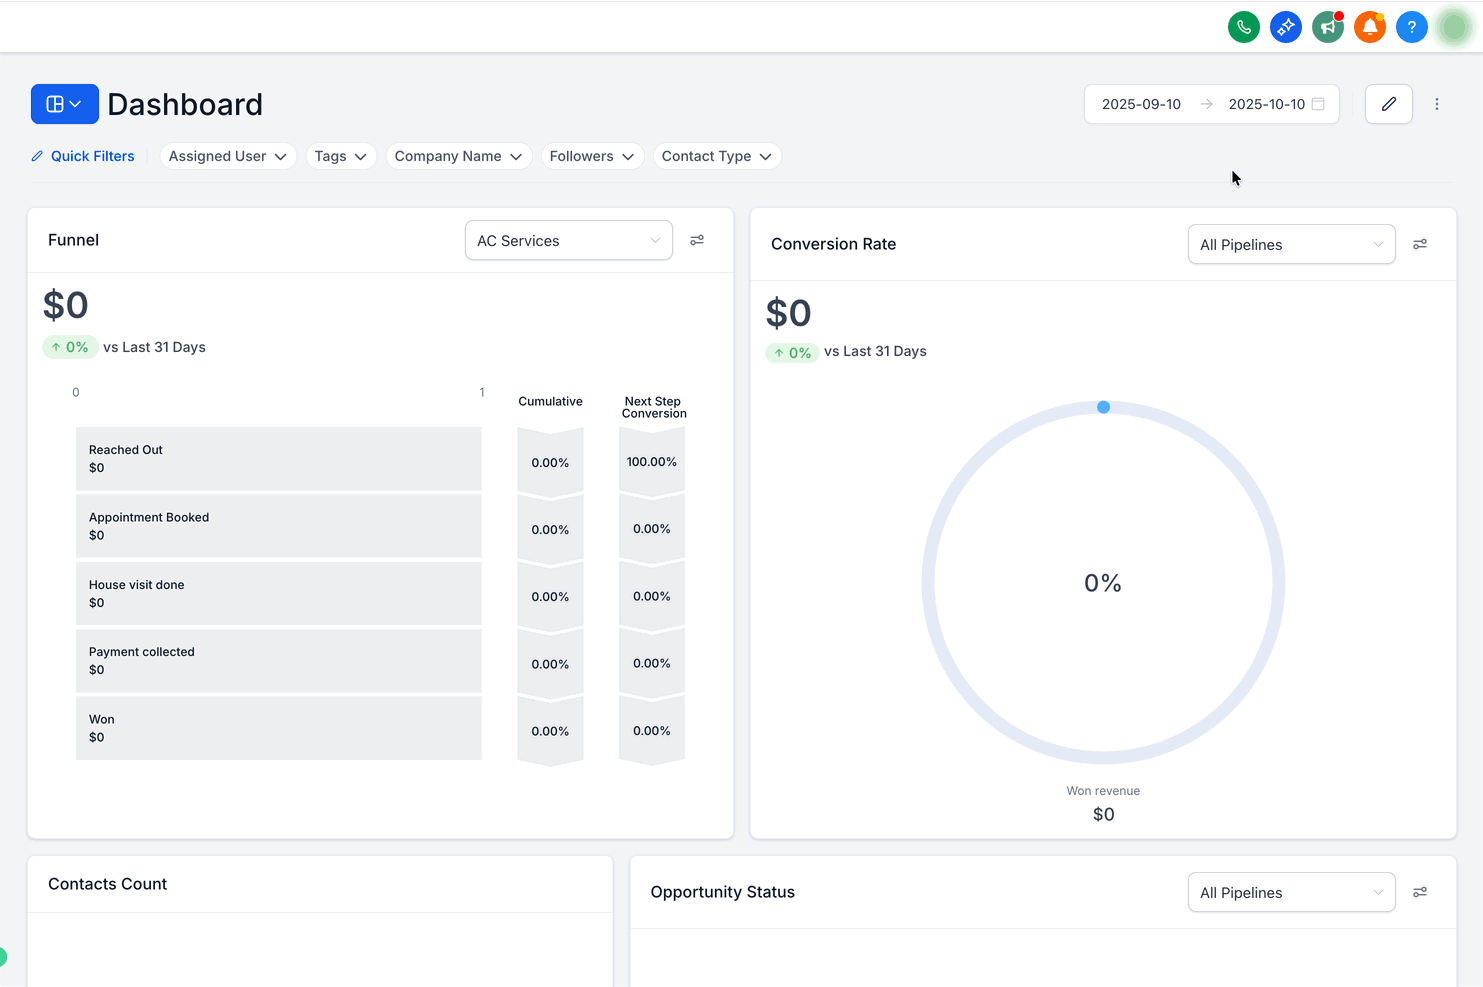
Click Edit Dashboard, then Add Widget.
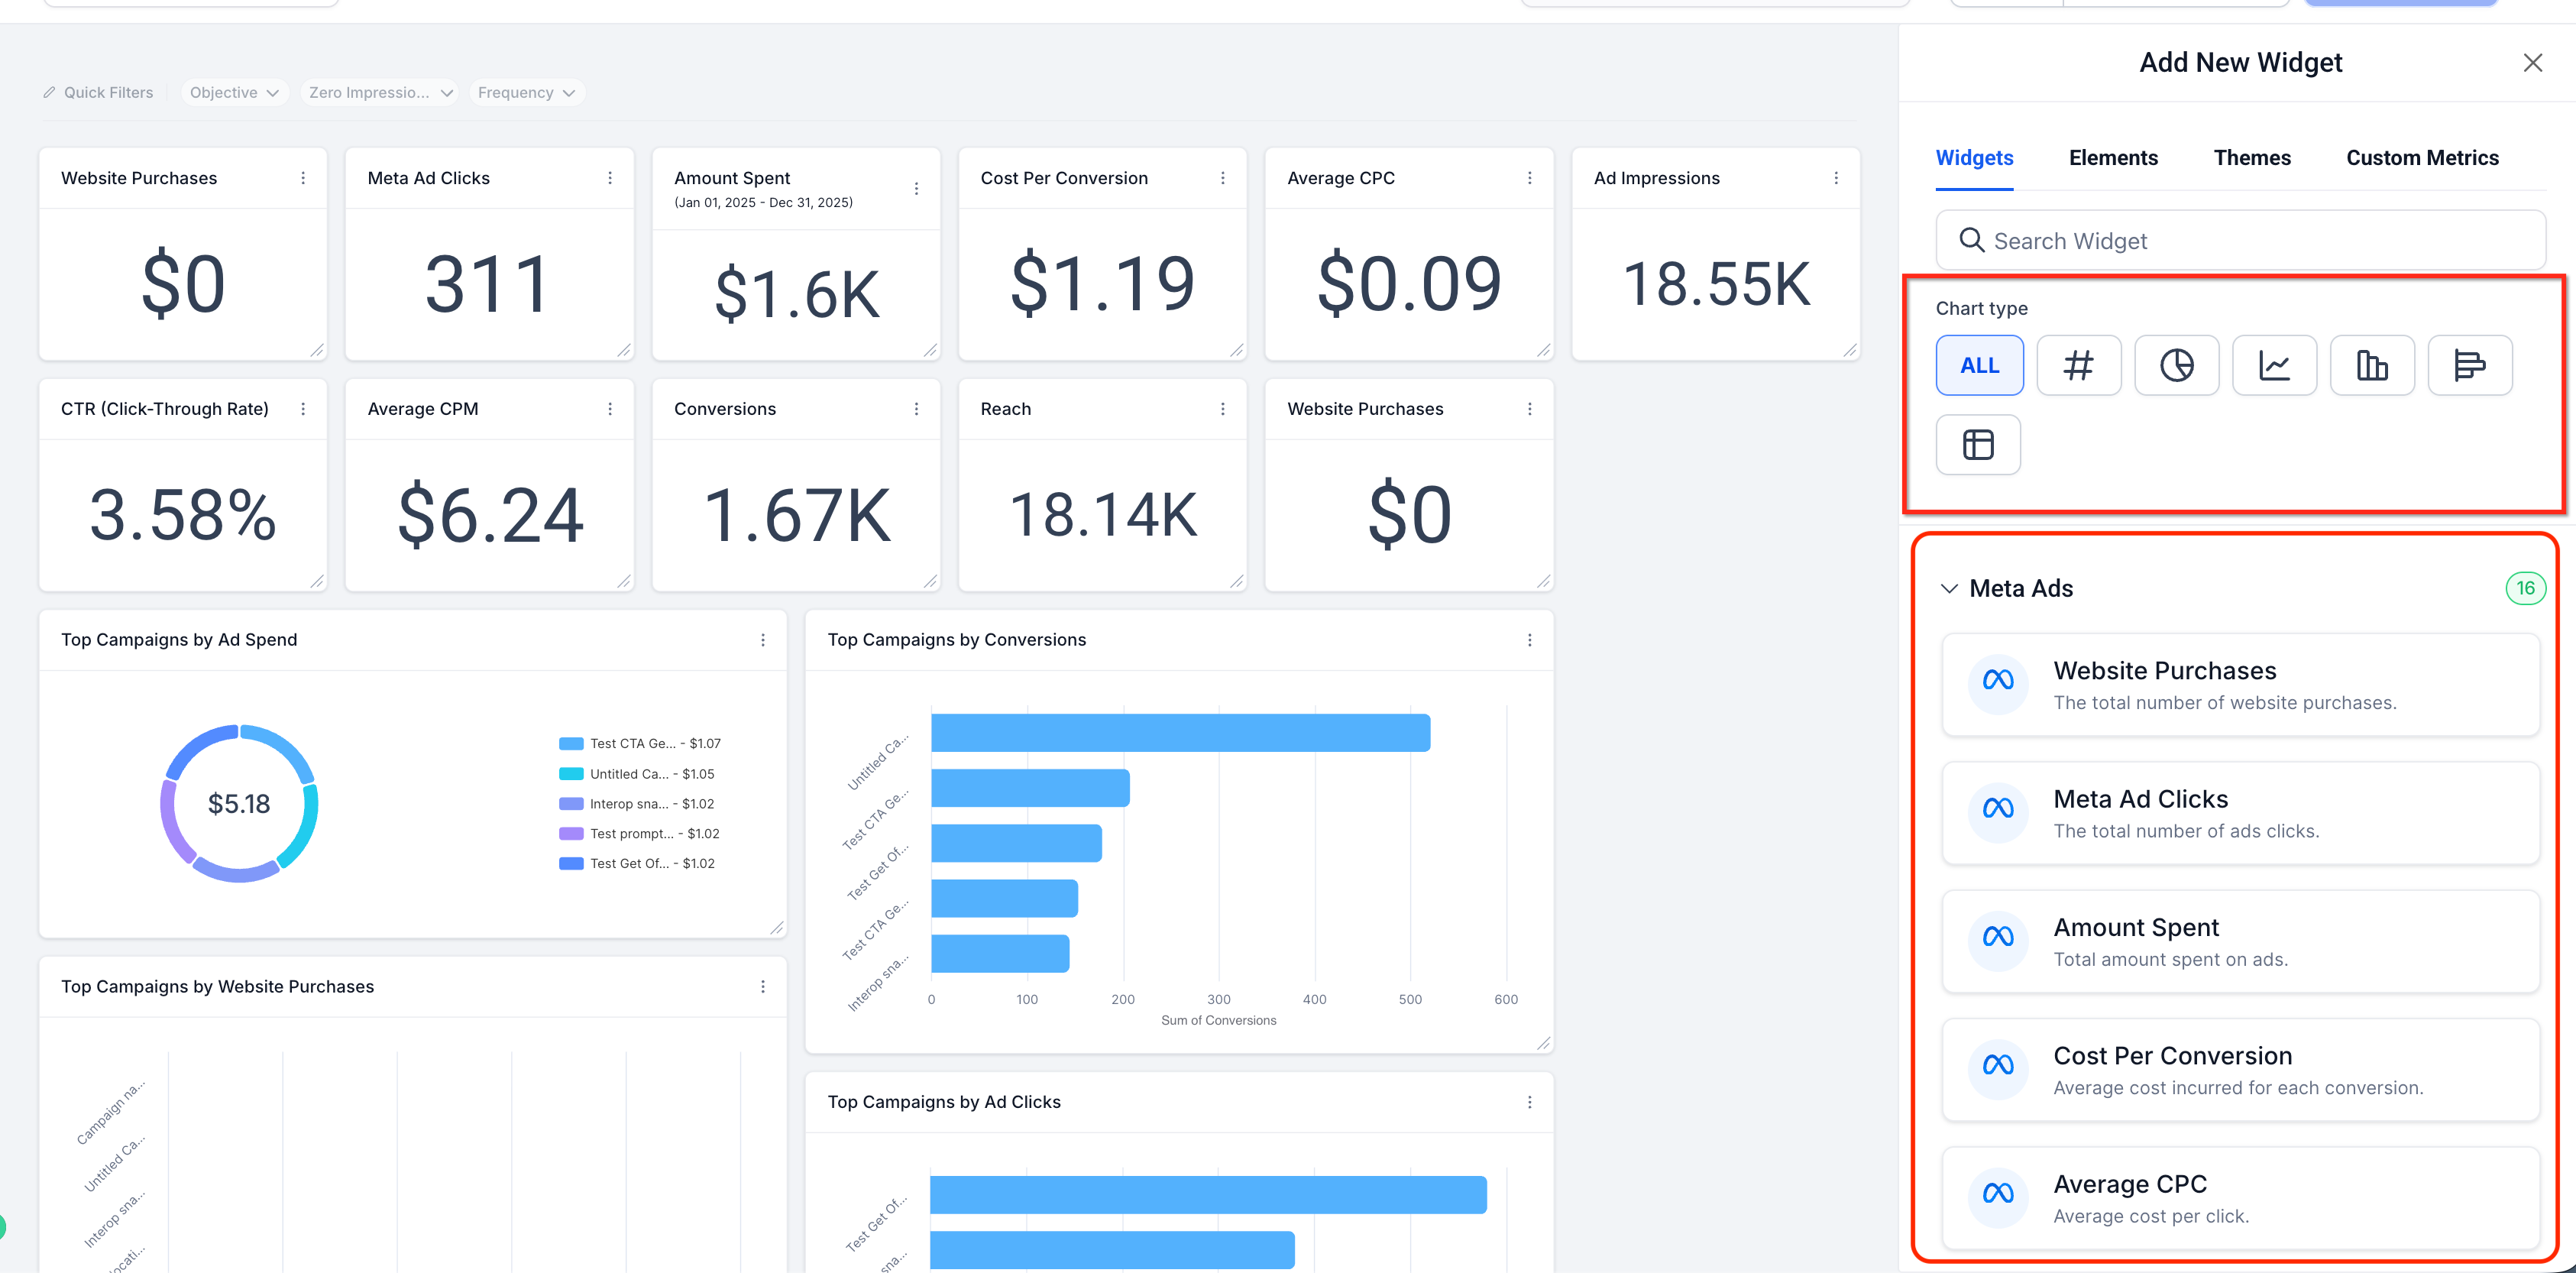
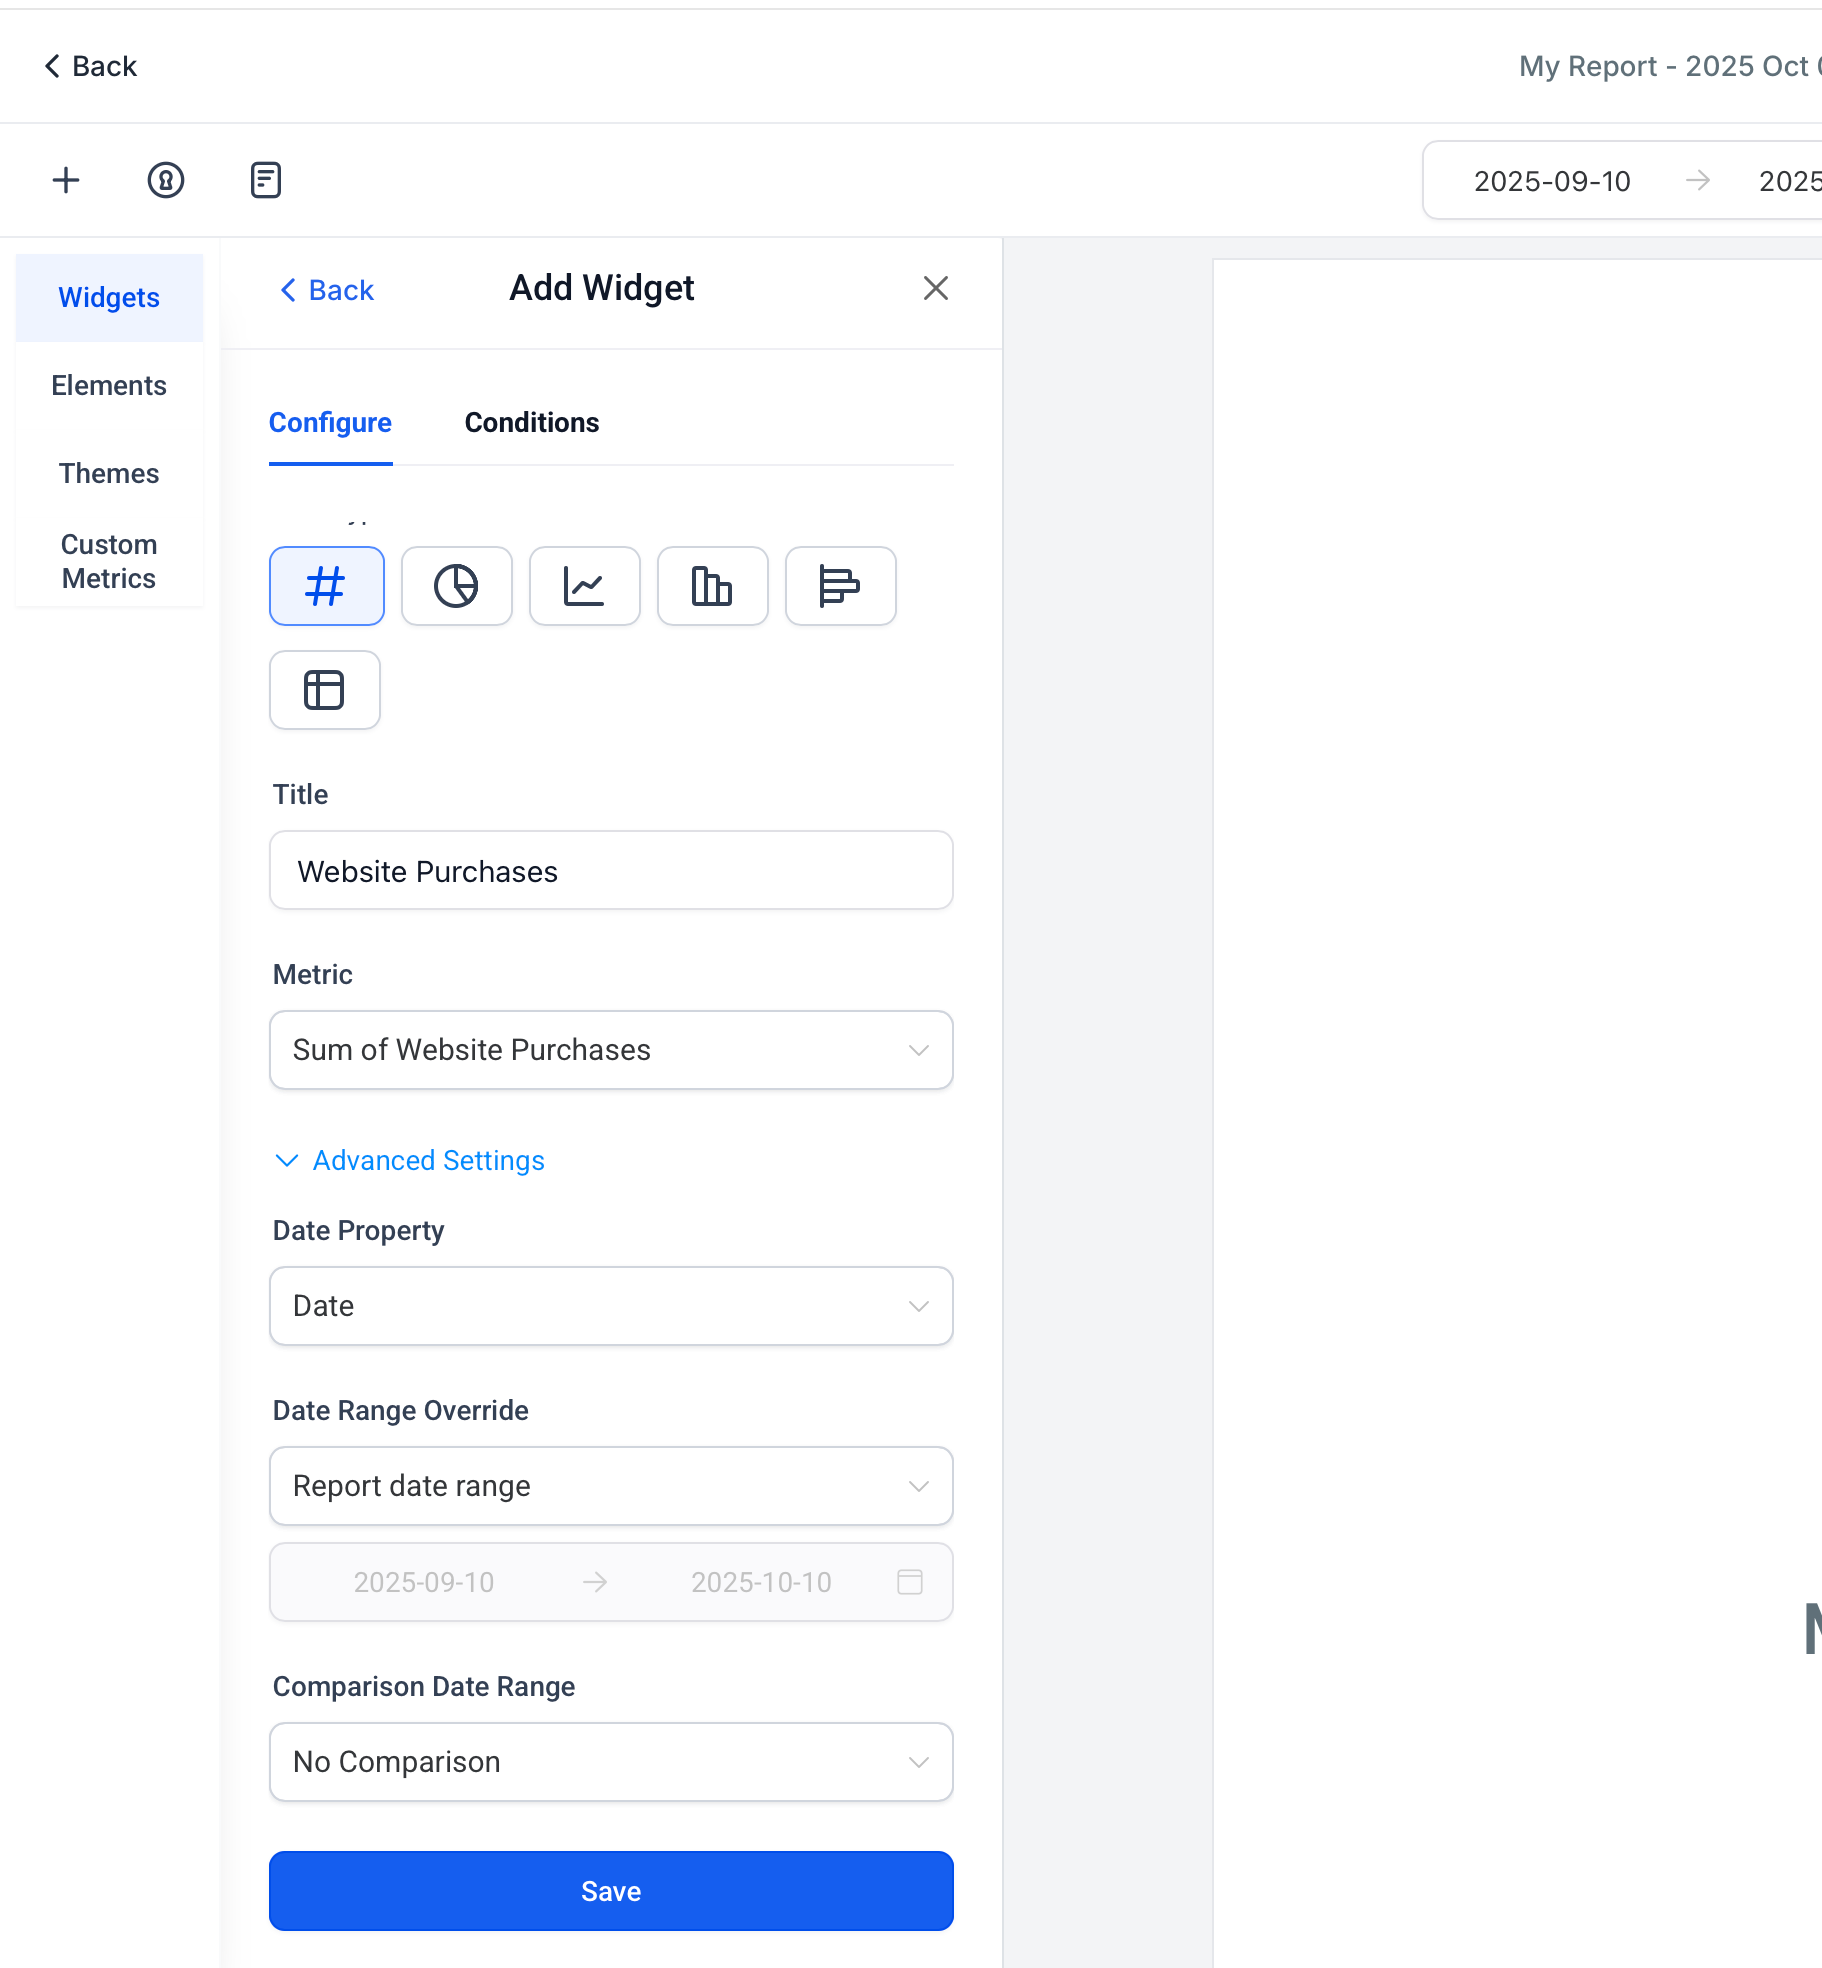
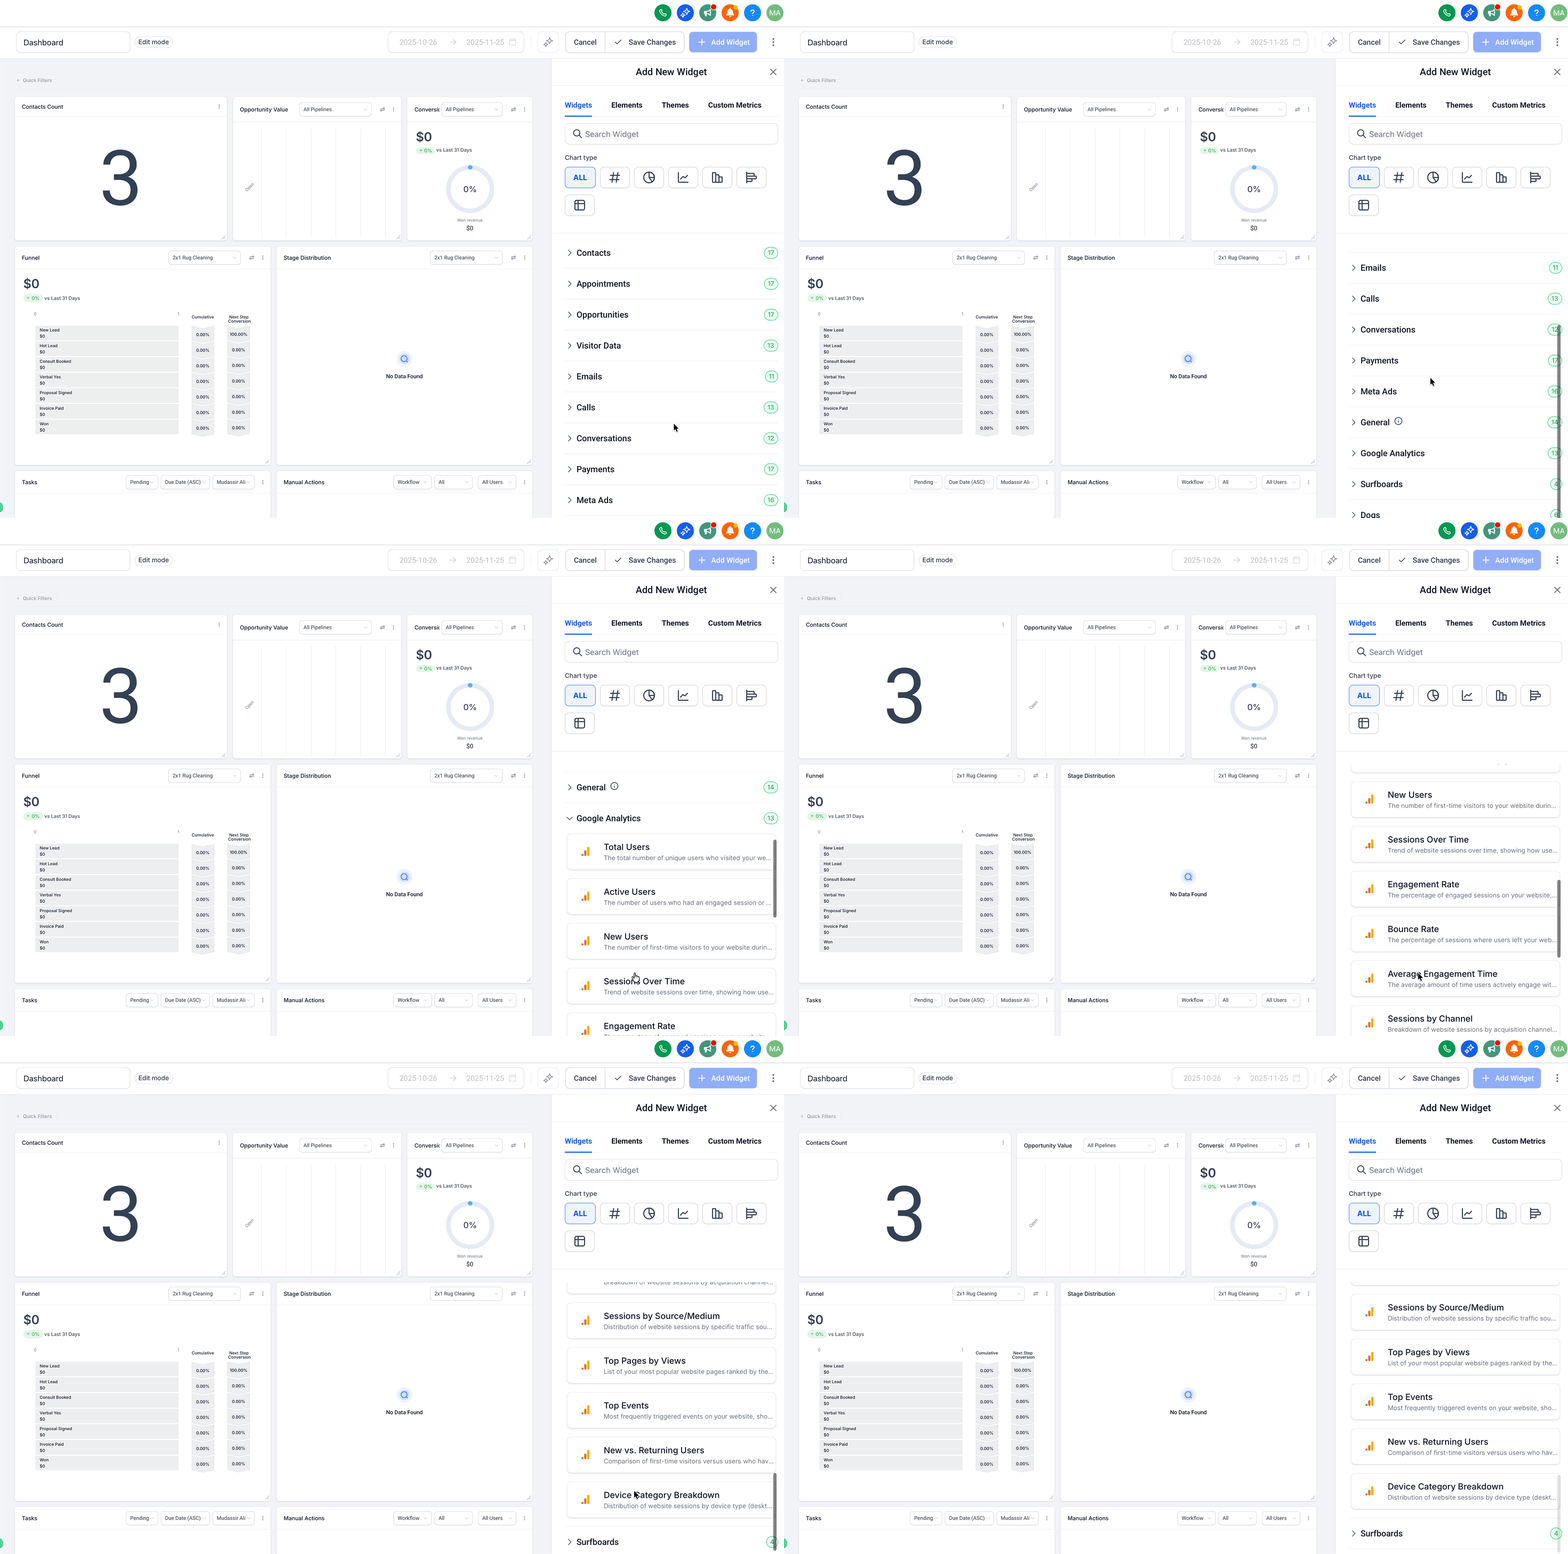
Choose a chart type (Numeric, Donut, Line, Bar, or Table), then scroll to the Meta Ads category and select the metric or Top Campaigns widget you want.
Apply filters (campaign, metric, date range) and adjust the theme or colors if you'd like.
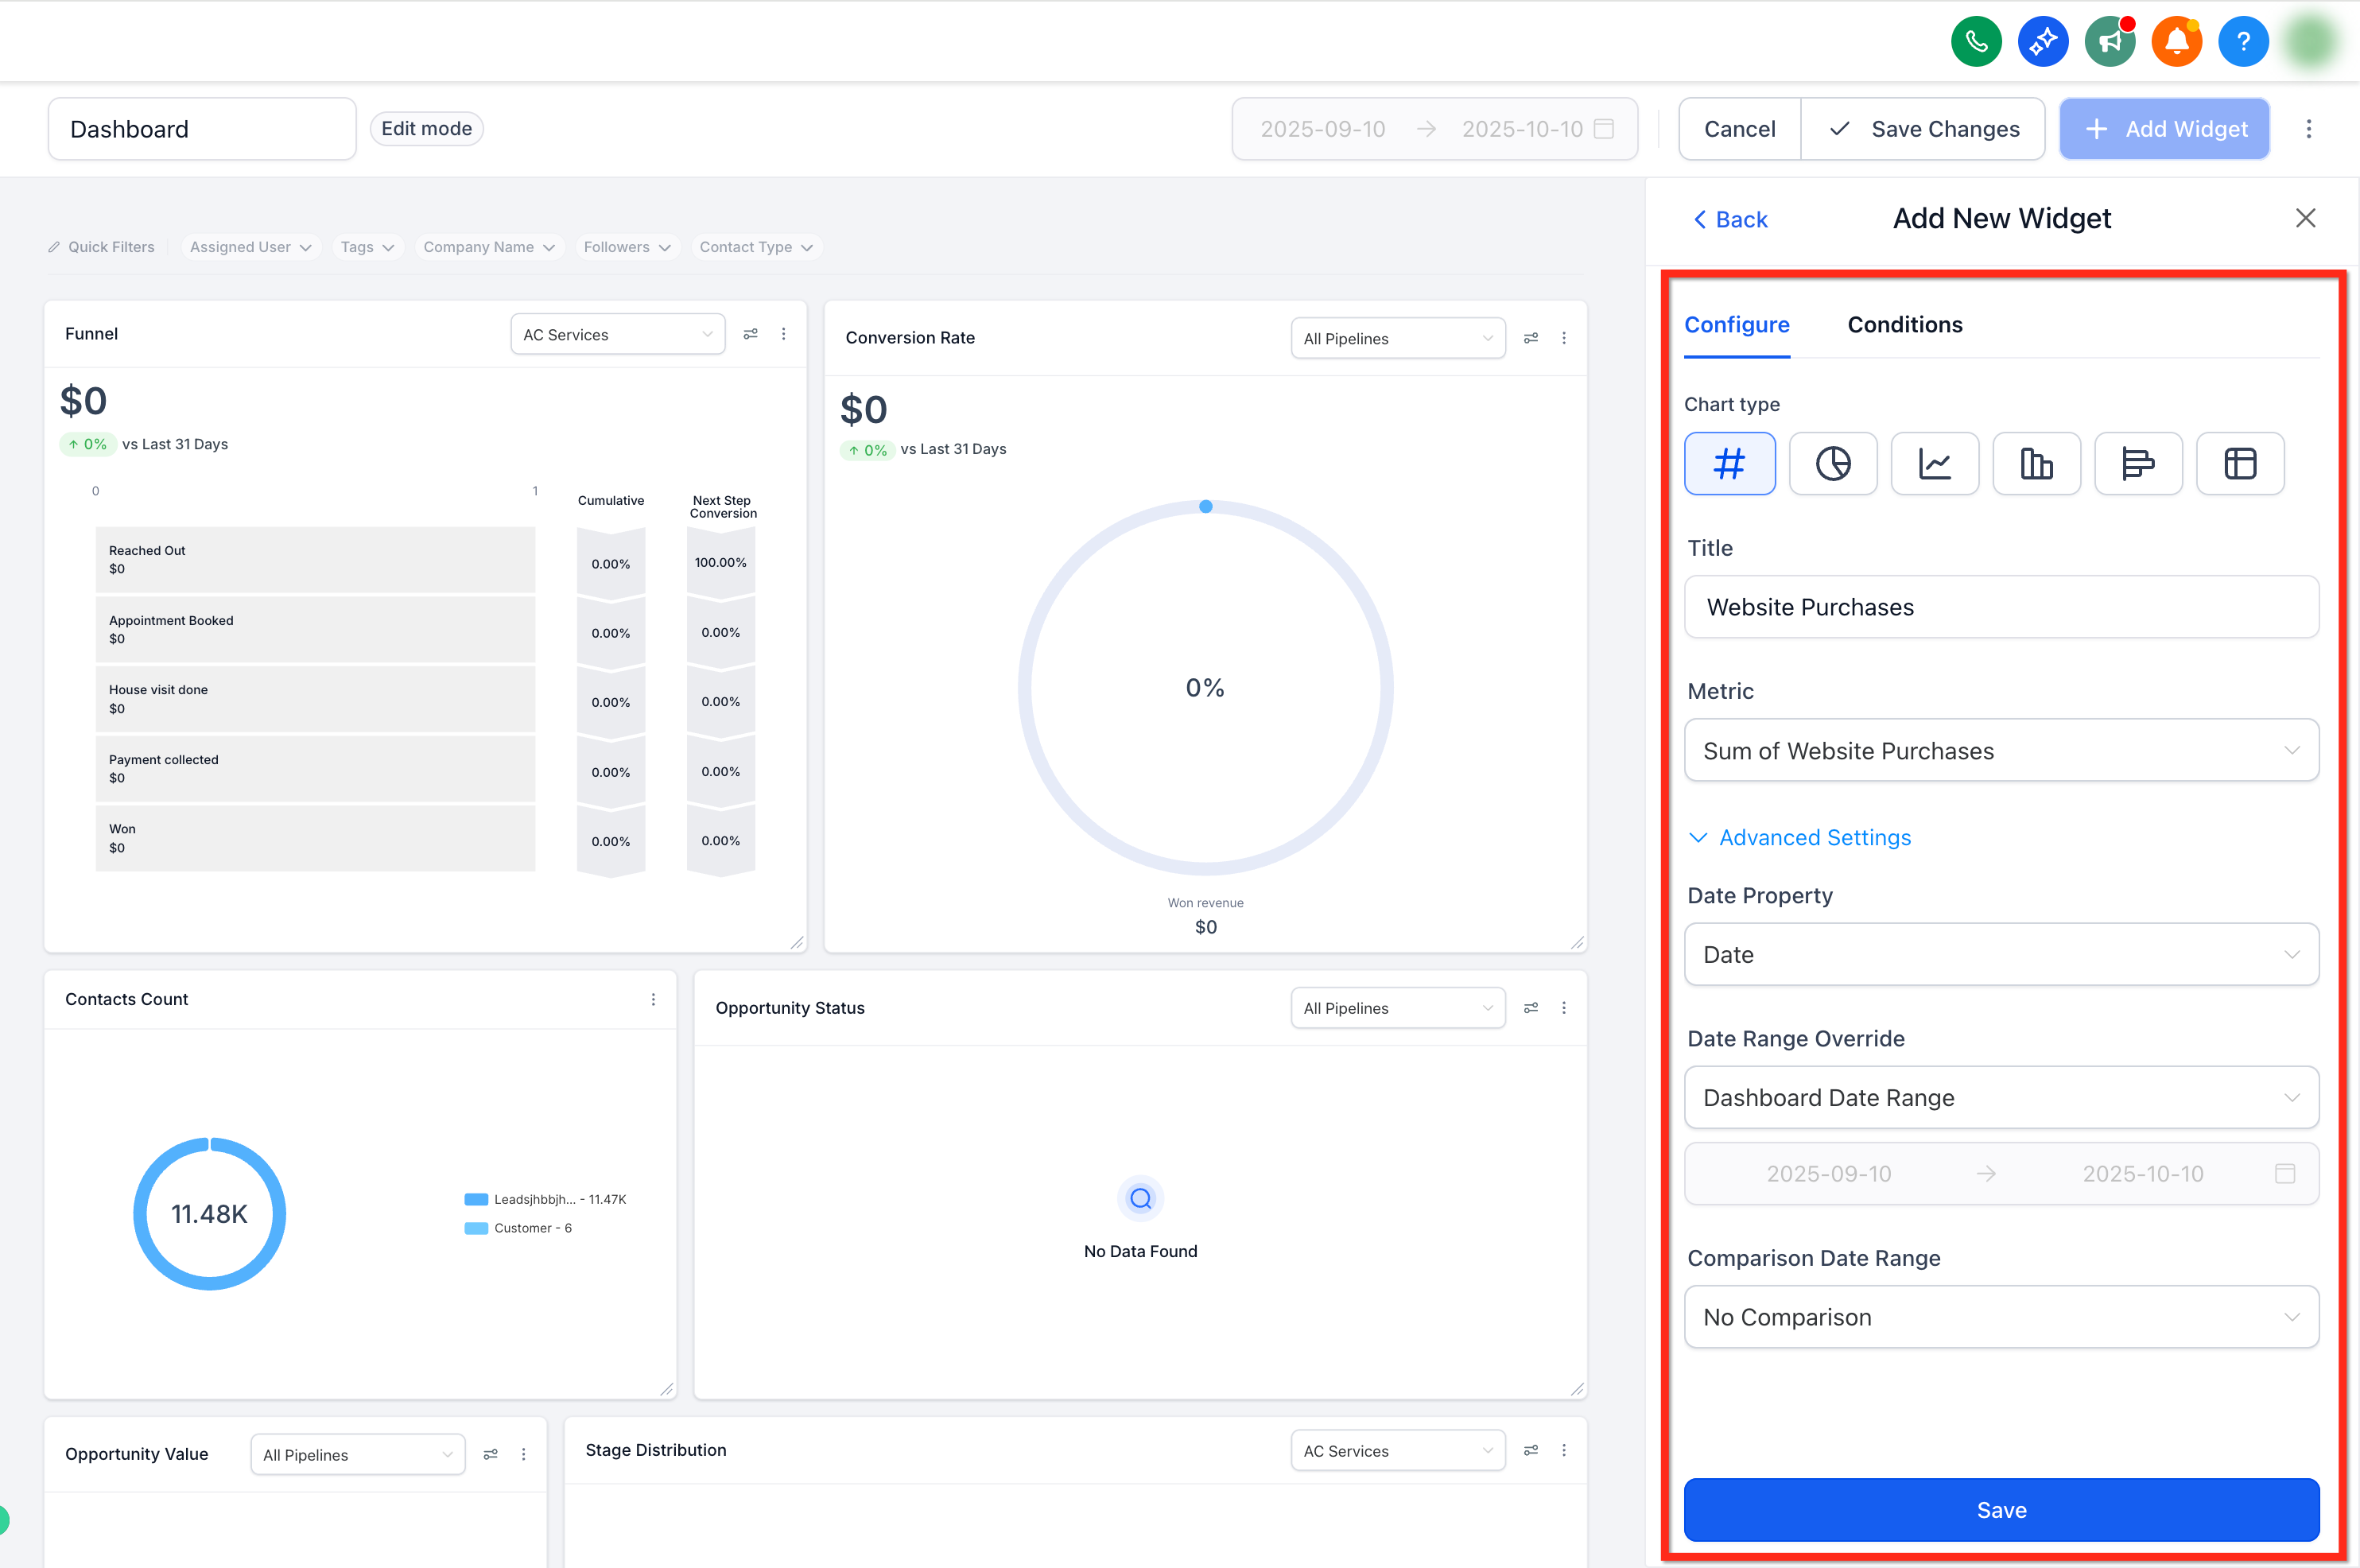
Click Save. The widget begins streaming live ad data.
Go to Reporting > Custom Reports and open an existing report, or click New Report.
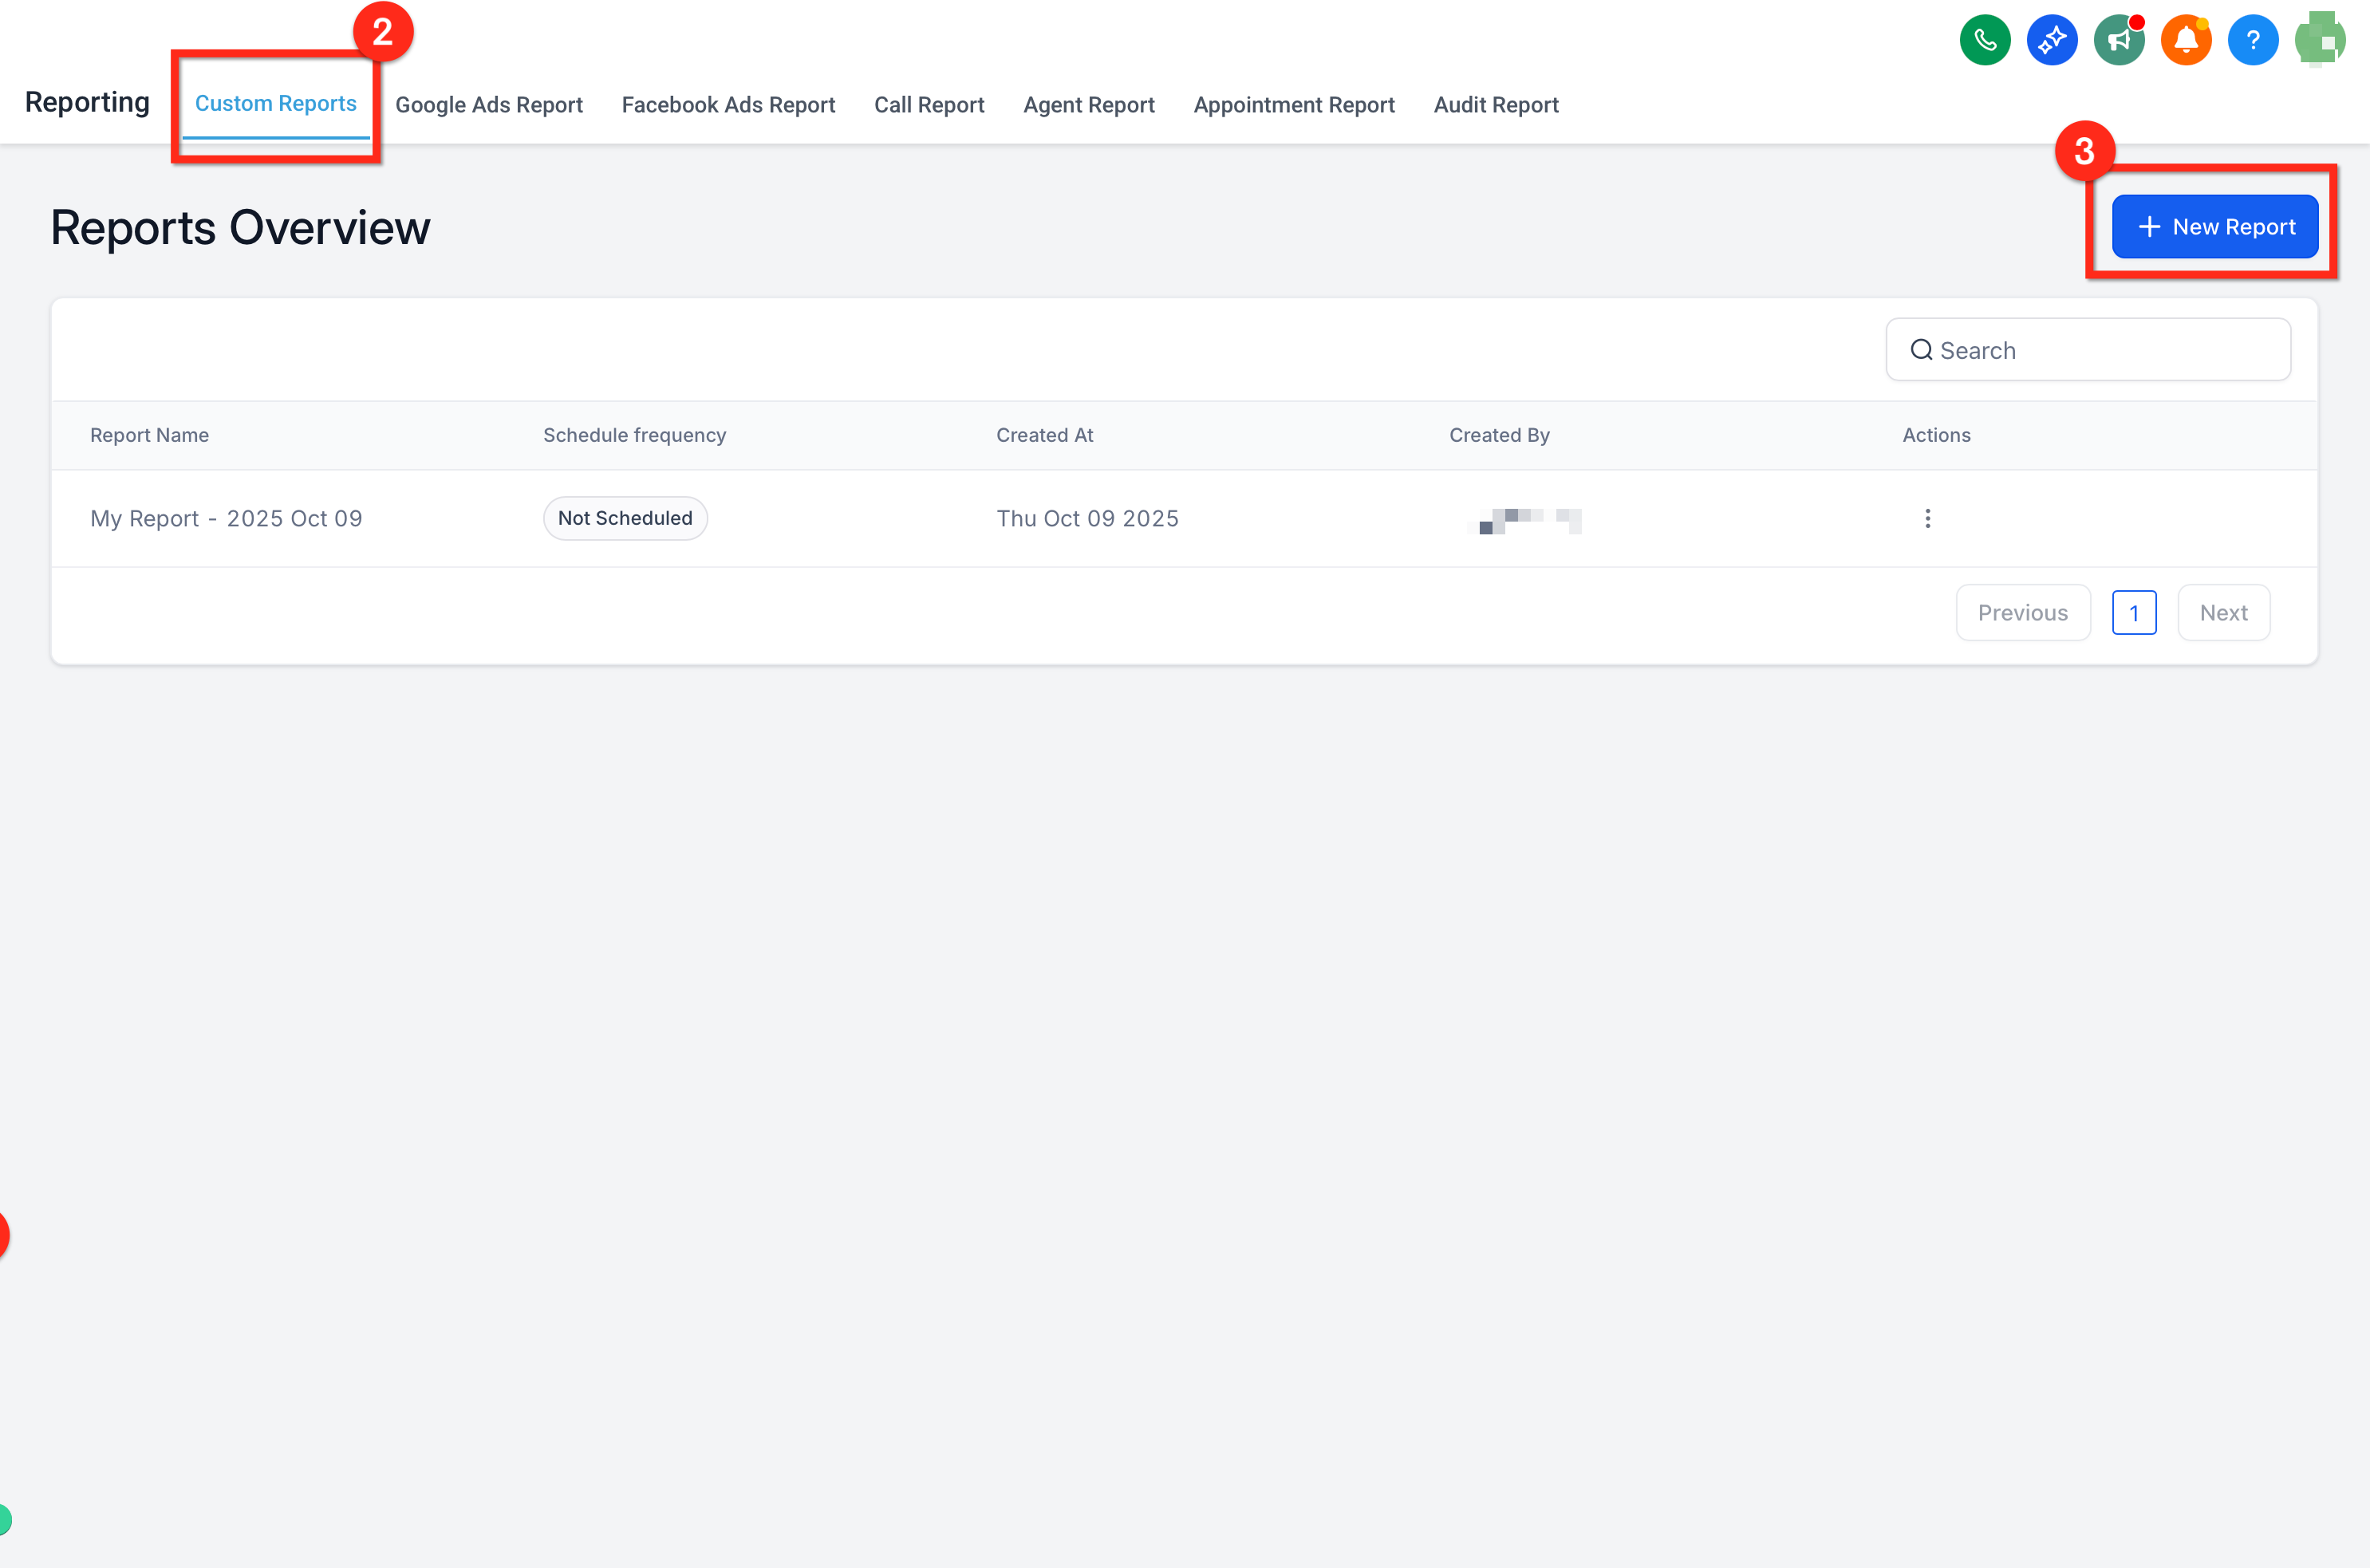
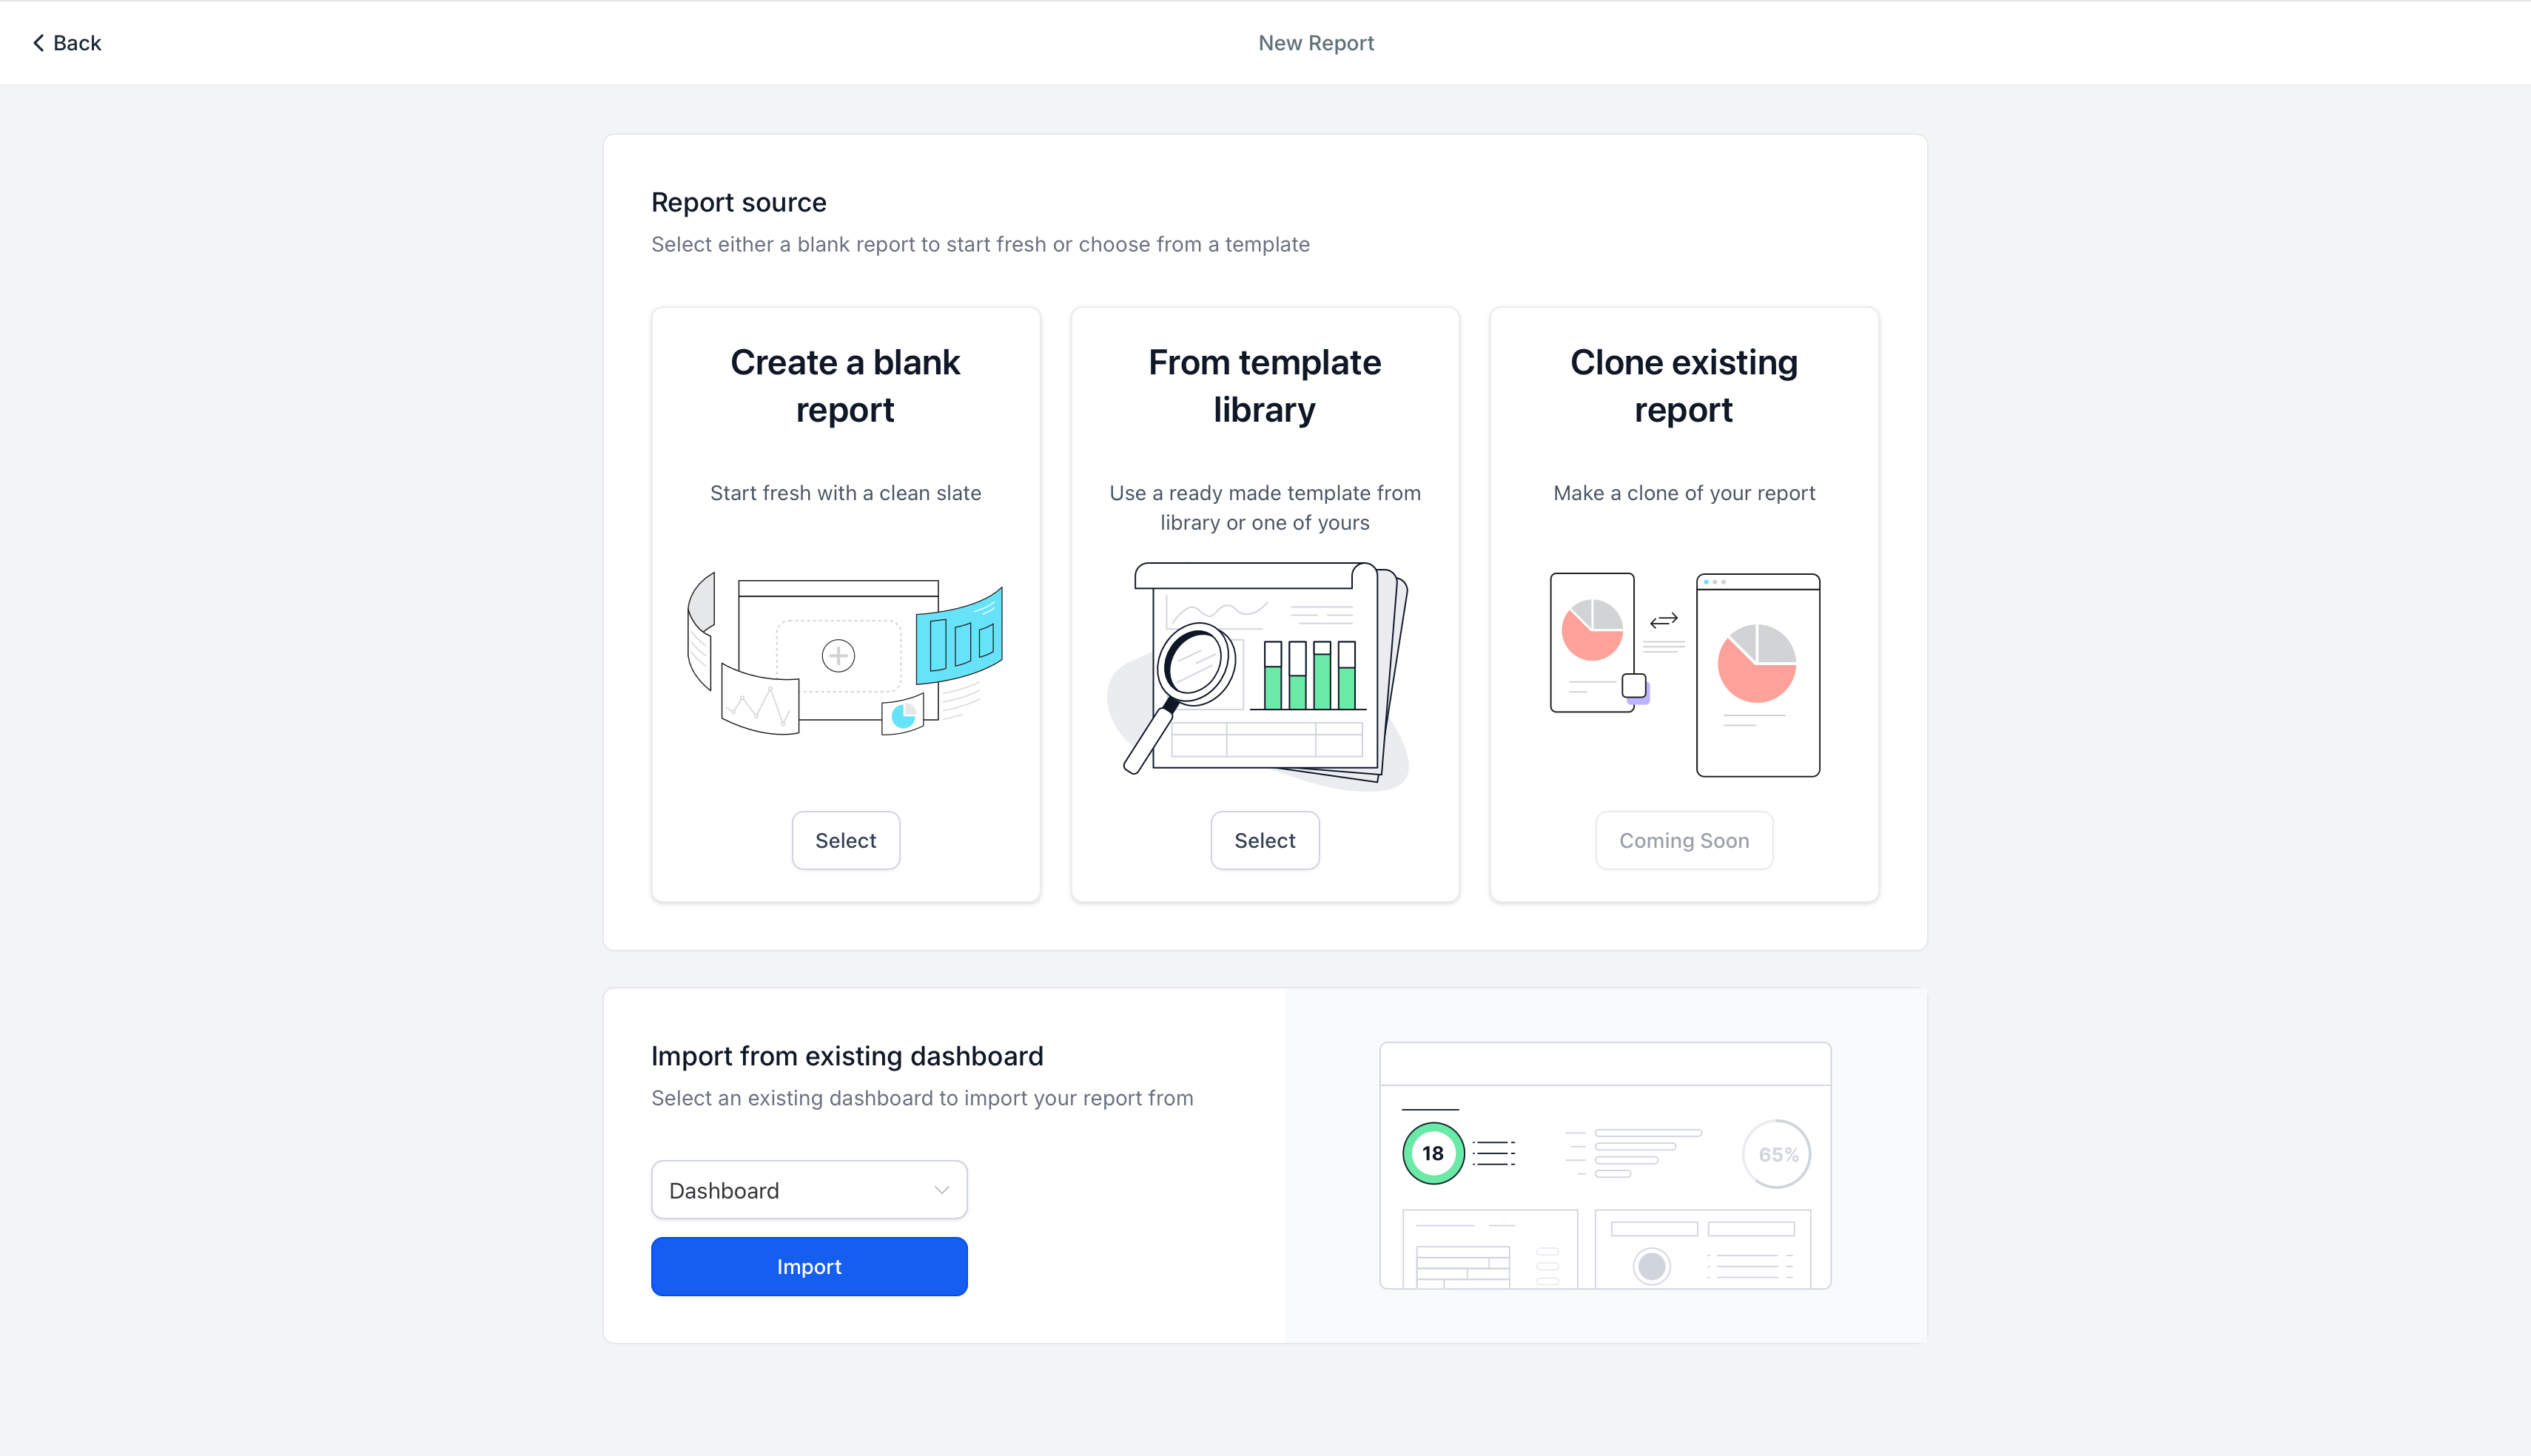
Choose to start from a blank canvas, use a template, or import an existing dashboard layout.
Click Add Widget/Element in the top-left corner, find the Meta widgets in the list, and drag the ones you want into the layout.
Configure each widget's chart type, filters, and theme, then click Save.
Click Send or Schedule to set up an email schedule so the report goes out automatically.
Dashboard vs. Custom Report: Dashboard widgets update automatically and are best for at-a-glance monitoring throughout the day. Custom Reports are better when you want a polished, scheduled layout emailed to your team or a stakeholder on a recurring basis. Both pull from the same Meta metric library, so you can build a layout in one place and reuse it in the other.
Google Analytics Widgets bring GA4 metrics, like total users, engagement rate, and top pages, into the same dashboards and reports where you track pipeline and revenue. This is useful for seeing whether the traffic your marketing generates is actually engaging with your site before it ever reaches a form or a booked appointment.
Metric | Definition |
|---|---|
Total Users | Total number of unique users who visited your website during the selected time period. |
Active Users | Number of users who had an engaged session or were active on your site. |
New Users | First-time visitors to your website in the selected period. |
Sessions Over Time | A time-series view of total sessions across the selected date range. |
Engagement Rate | Percentage of engaged sessions, indicating how actively users interact with content. |
Bounce Rate | Percentage of sessions with no further engagement after a single page view. |
Average Engagement Time | Average time users actively spend engaging with your website content. |
Sessions by Channel | Sessions grouped by acquisition channel (Organic Search, Paid Social, etc.). |
Sessions by Source/Medium | Sessions grouped by traffic source and medium pairs (google/organic, facebook/social, etc.). |
Top Pages by Views | Most-viewed pages ranked by total views. |
Top Events | Most frequently triggered GA4 events (key interactions and behaviors). |
New vs. Returning Users | Comparison of first-time vs. returning visitors in the selected period. |
Device Category Breakdown | Sessions by device type (desktop, mobile, tablet). |
Date range: The dashboard or report date picker sets the time window for every widget on the page.
Chart type: Choose Numeric, Donut, Line, Bar, or Table, depending on what's available for that widget.
Filters: Narrow results by source/medium, channel, page, or event (for example, Source/Medium = google / organic).
Layout: Drag widgets to reposition them, resize for readability, duplicate a widget to compare it with a different filter, or remove what you don't need.
Theming: Optional theme choices keep the look consistent across dashboards and reports.
Open Dashboard and click the blue button in the top-left corner to open the dashboard you want to edit.
Click Edit Dashboard, then Add Widget.
Choose a chart type (Numeric, Donut, Line, Bar, or Table), scroll to the Google Analytics category, and select the metric or "Top" widget you want to add.
Apply filters (channel, source/medium, page, date range) and adjust the theme or colors if needed.
Click Save. The widget begins pulling GA4 data.
Go to Reporting > Custom Reports and open an existing report, or click New Report.
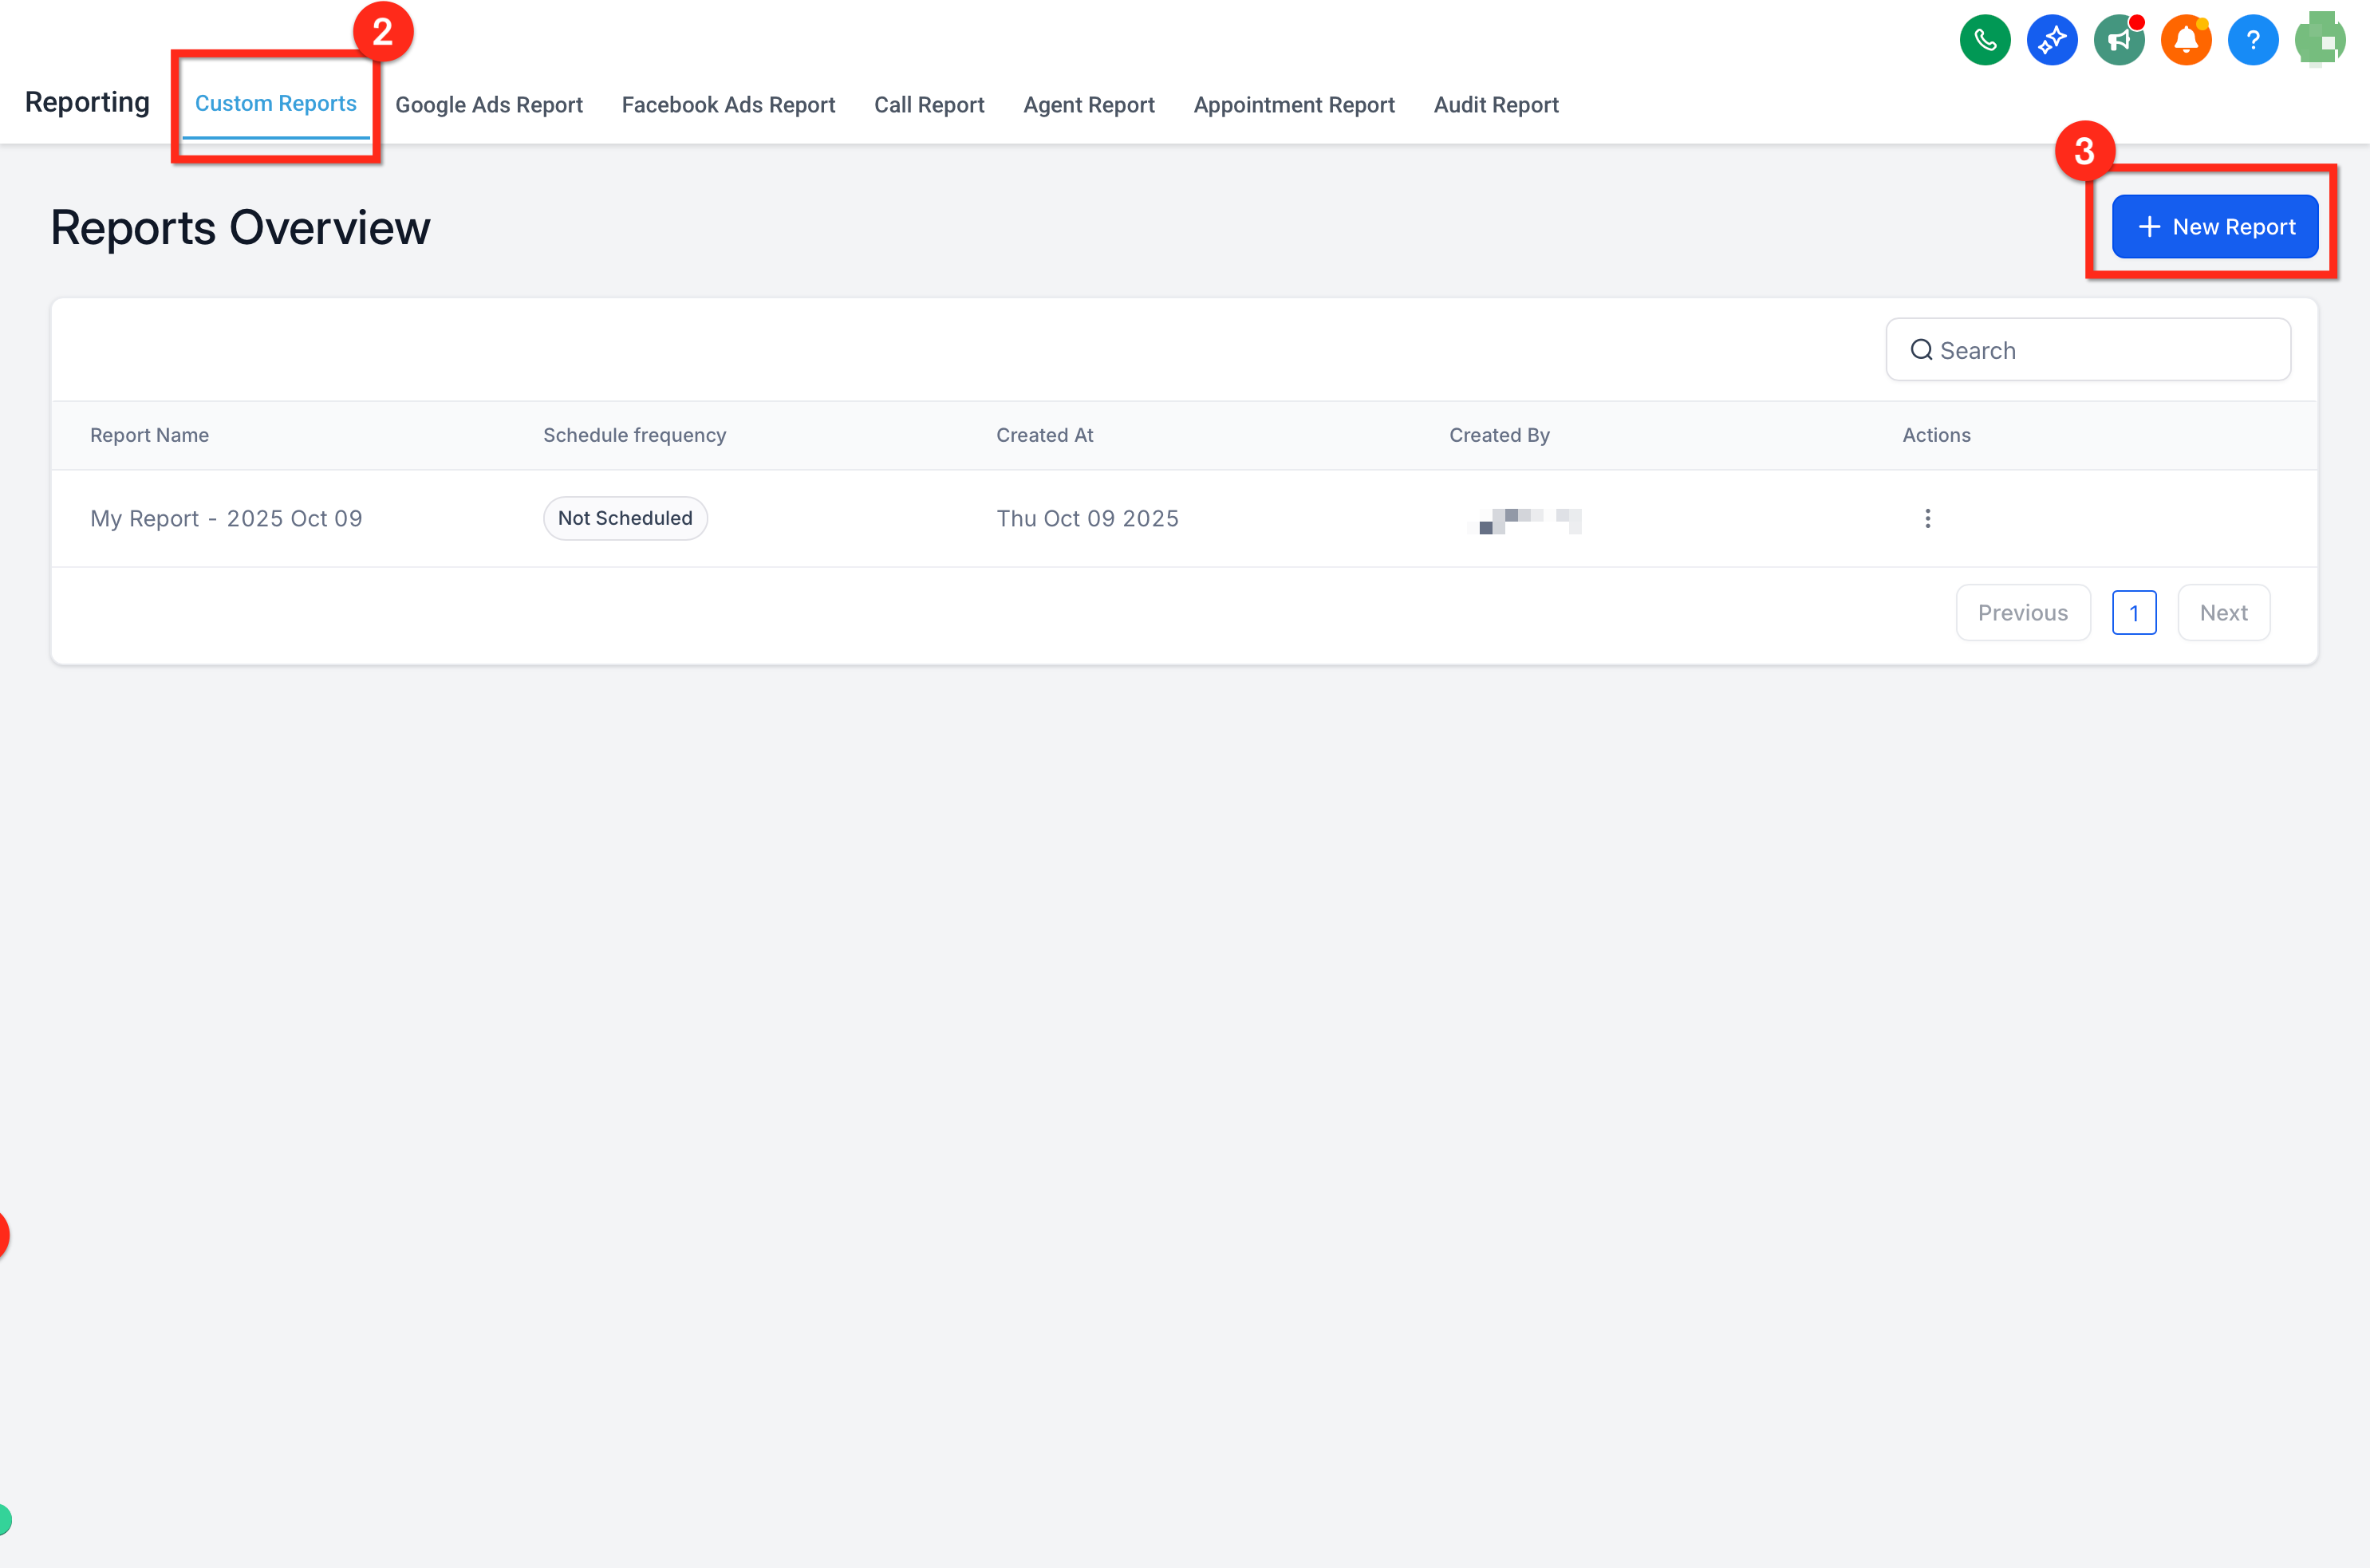
Start from a blank canvas, use a template, or import an existing dashboard layout.
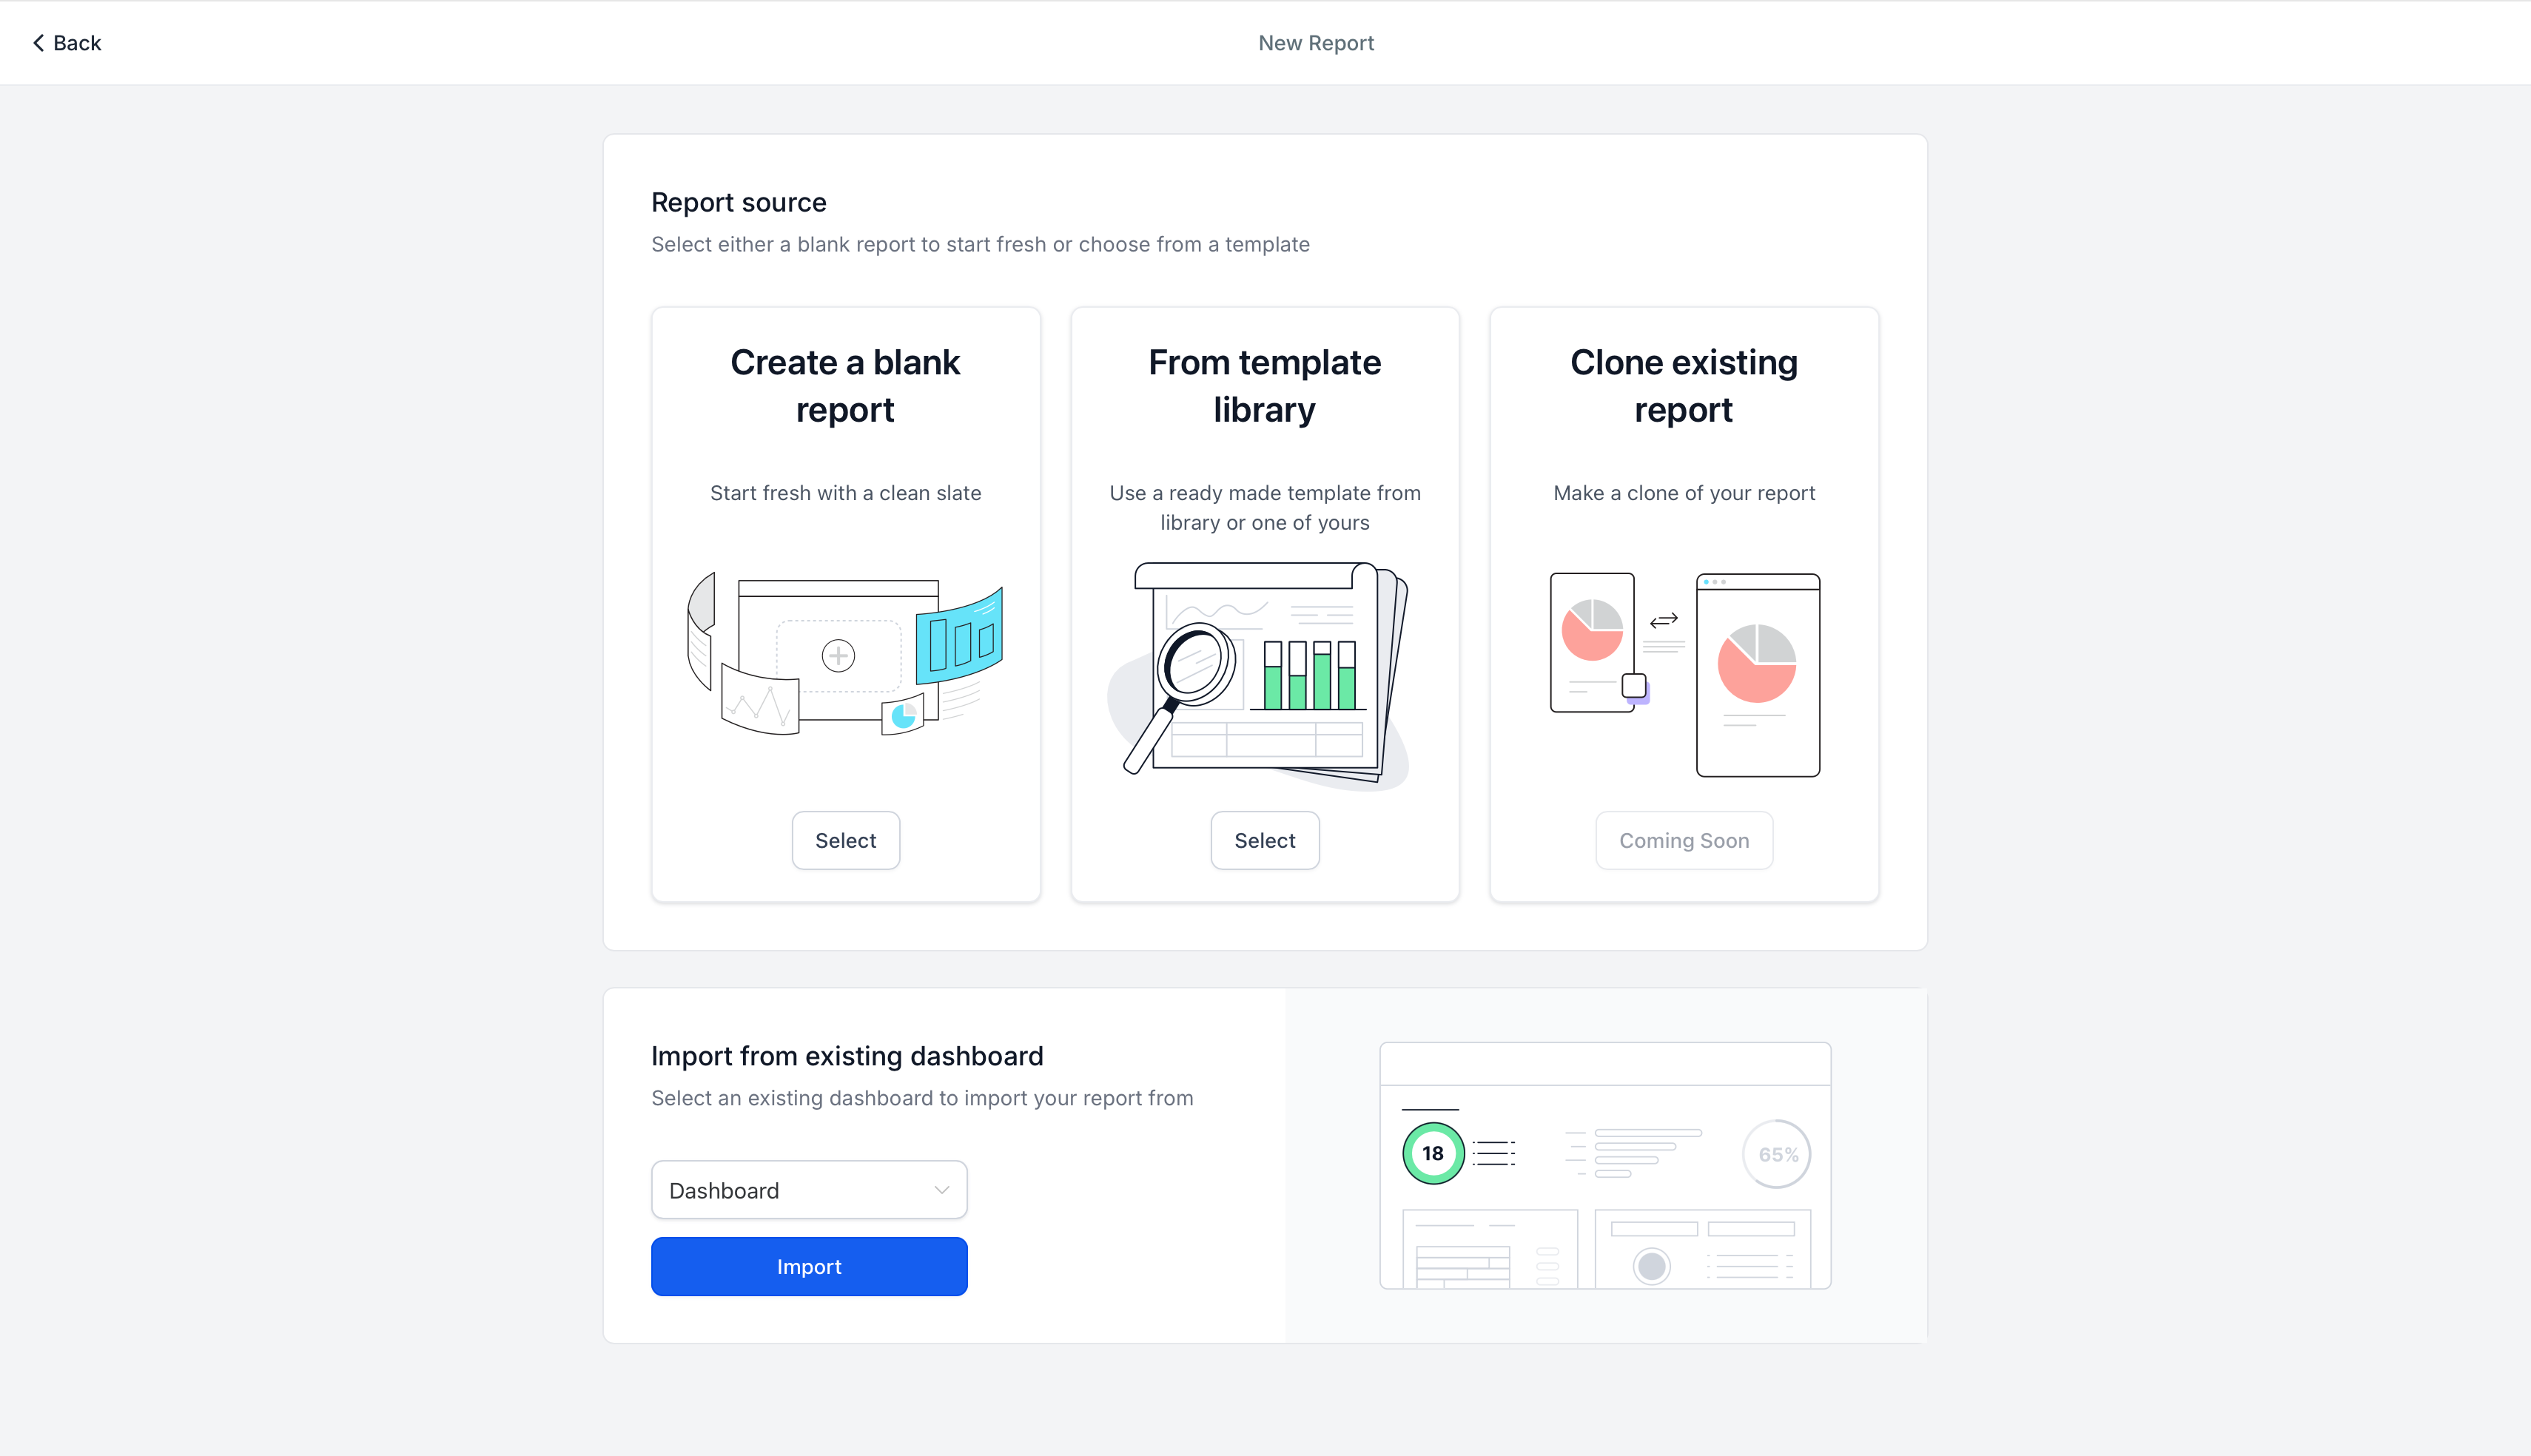
Click Add Widget/Element in the top-left corner, locate Google Analytics in the widget list, and drag the widgets you want into the layout.
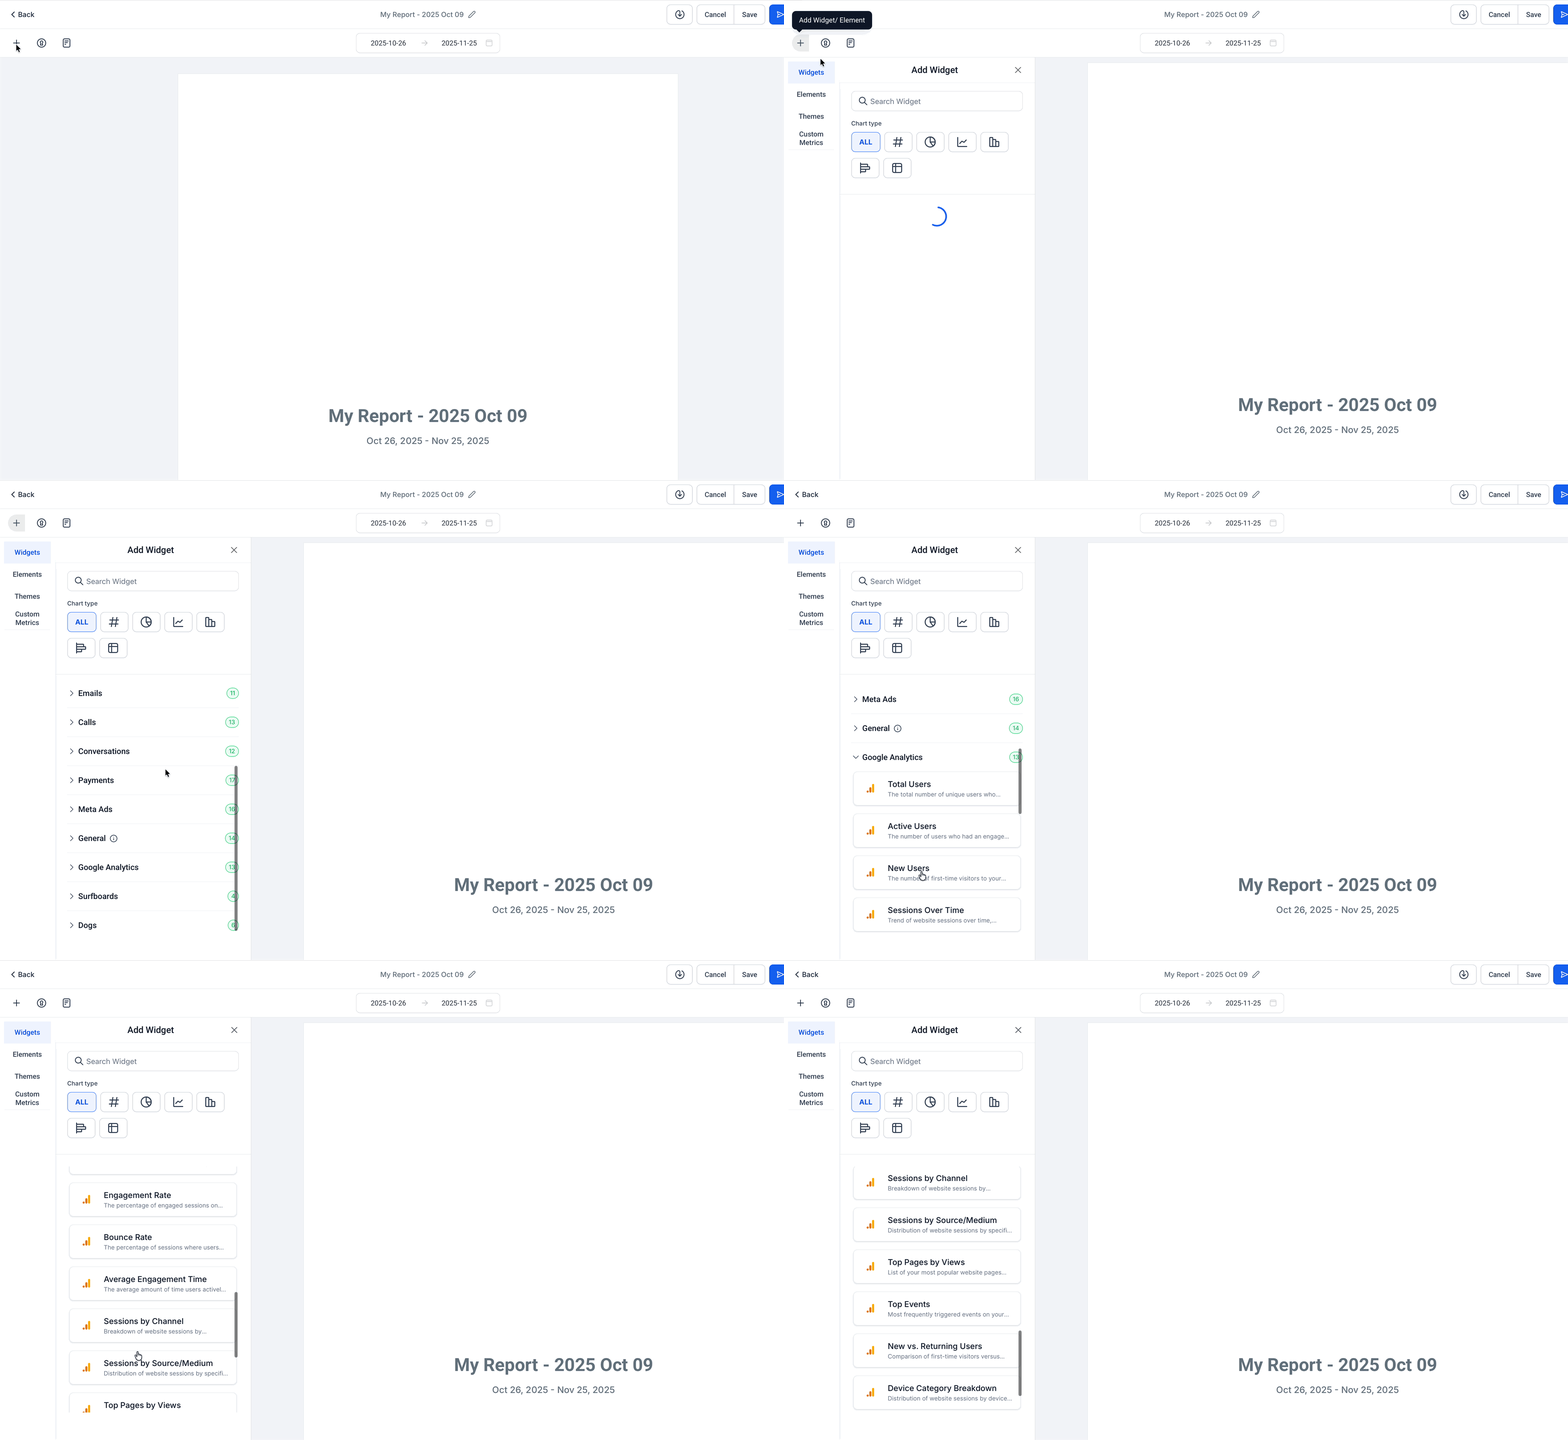
Configure each widget's chart type, filters, and theme, then click Save.
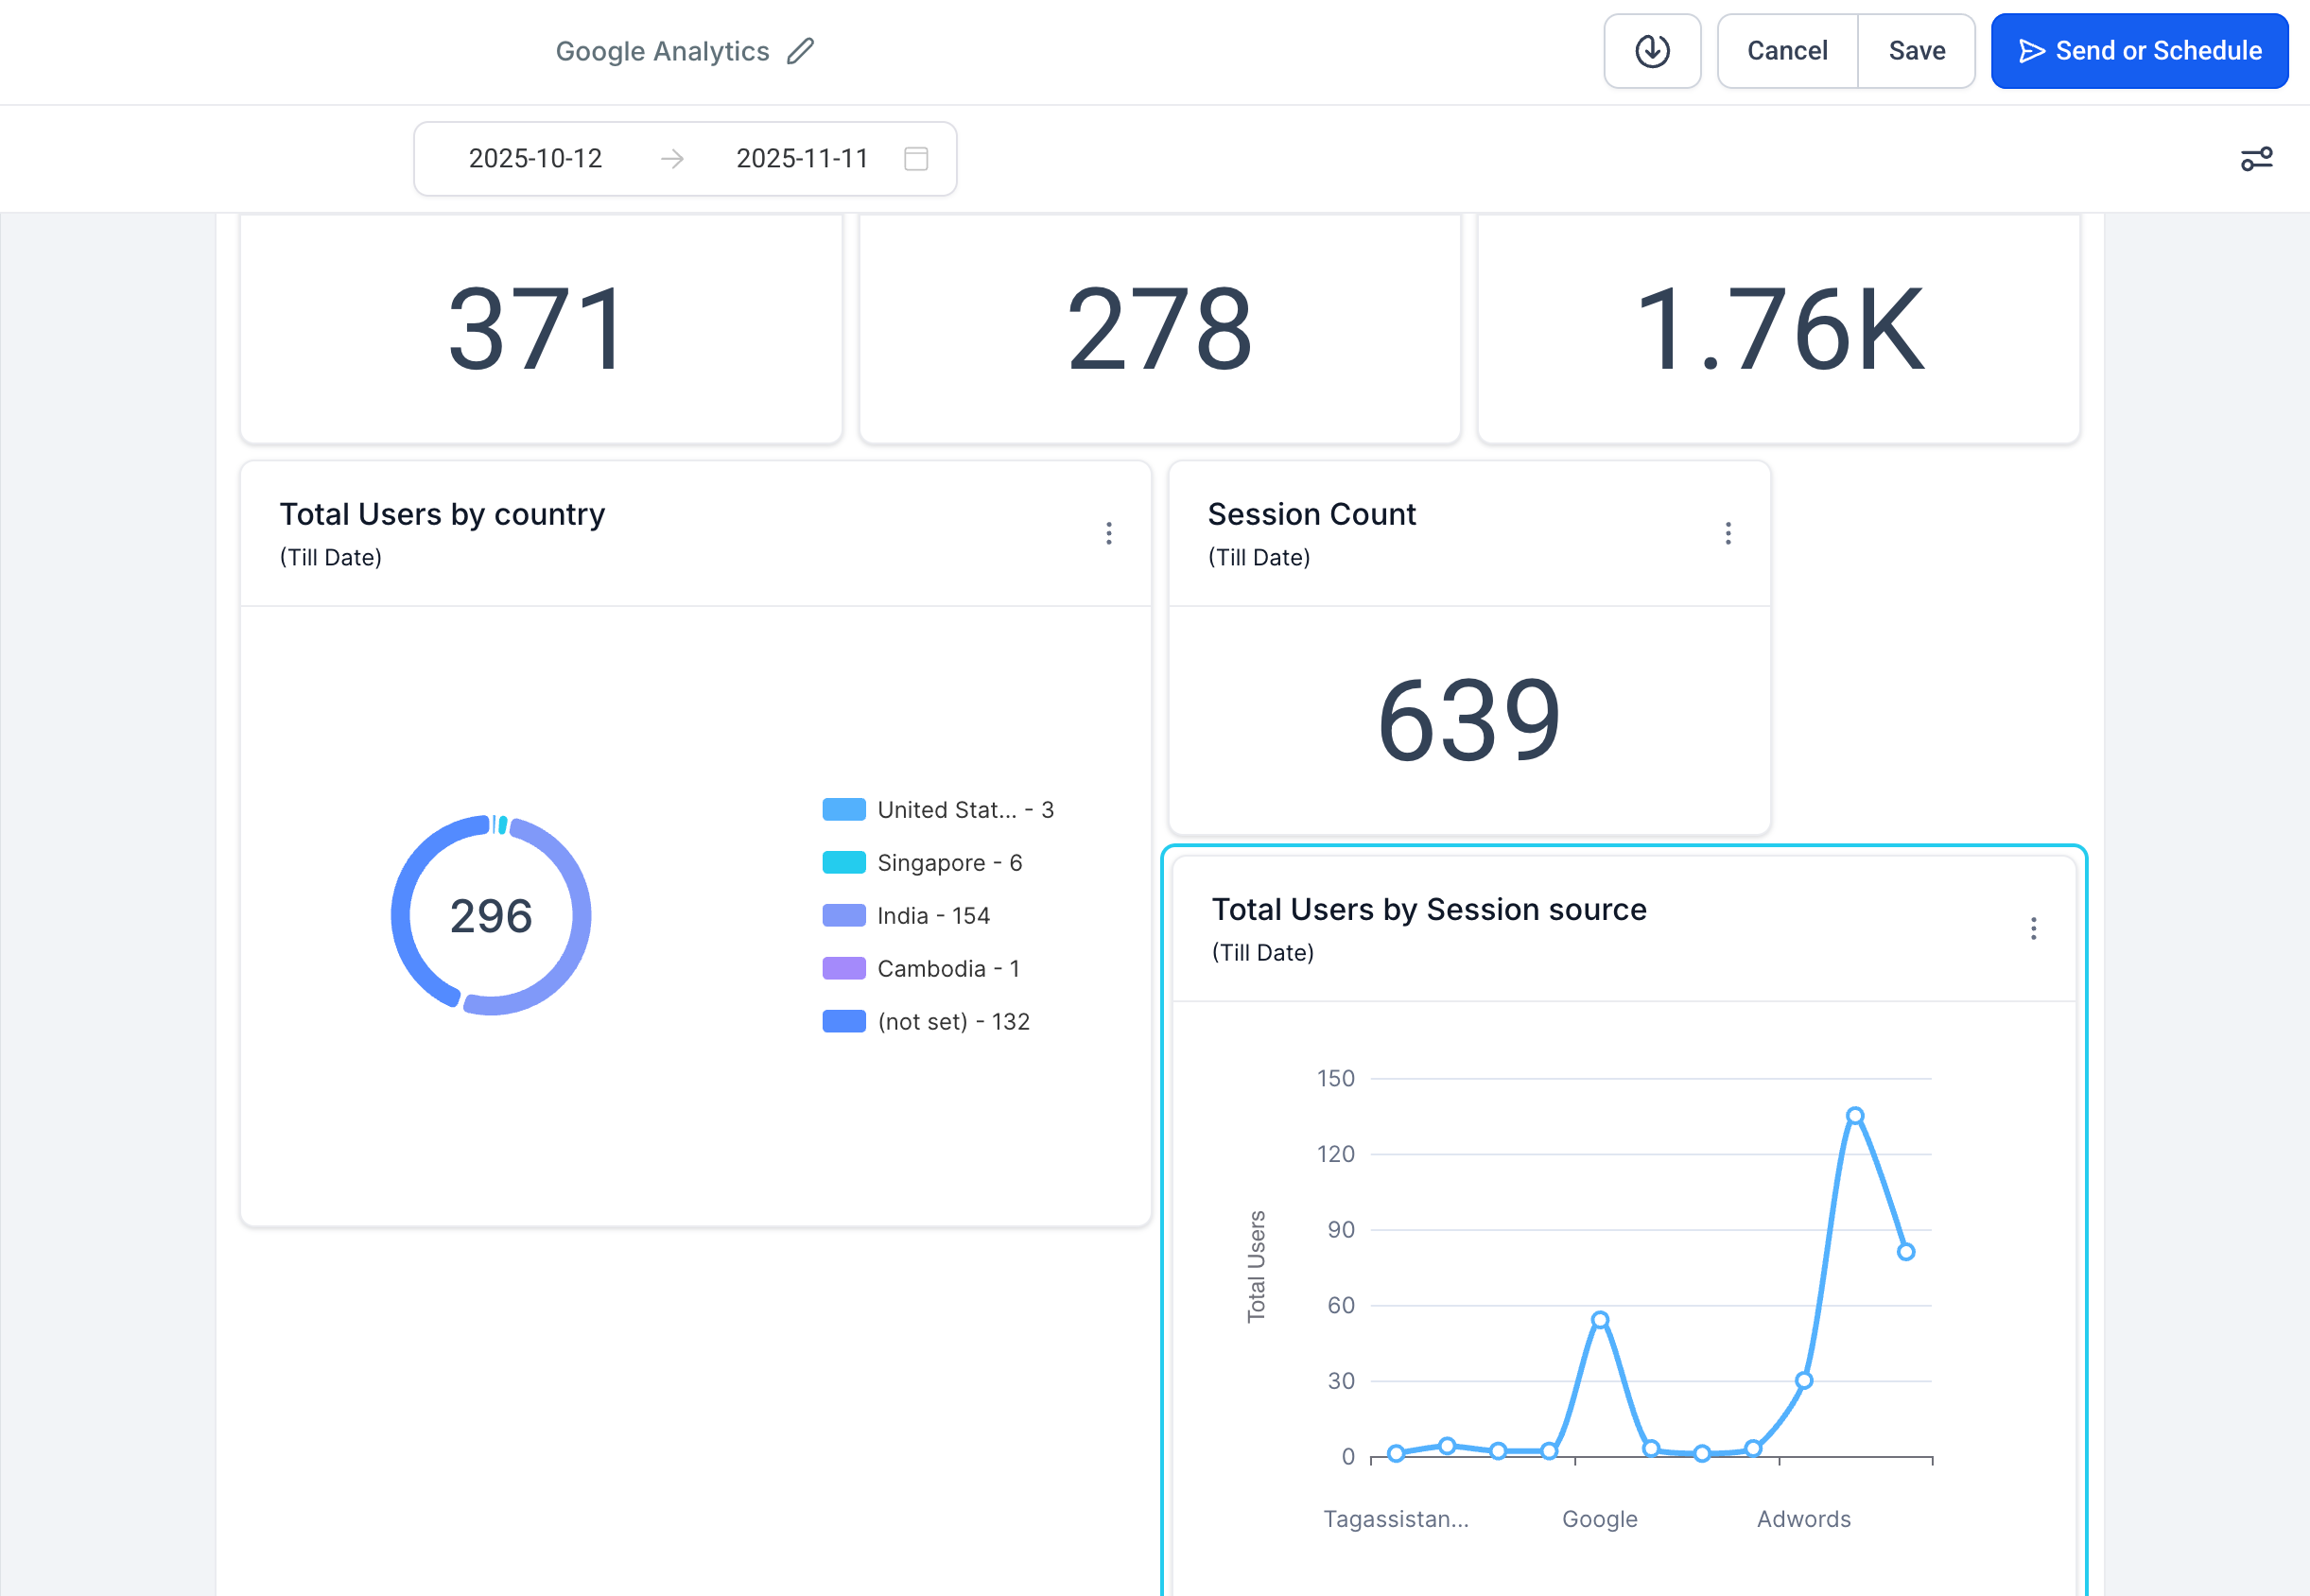
Click Send or Schedule to configure email delivery so recipients get the report automatically.
Dashboards vs. Custom Reports: the two surfaces read from the same connected GA4 property, so choose based on how you want to consume the data. Dashboards are an always-on snapshot for daily checks; Custom Reports are meant for scheduled, polished hand-offs.
Nothing stops you from mixing widget types on the same dashboard or report. A common layout for a med spa is a top row of booked-consult and revenue widgets from your CRM data, a middle row of Meta Ad spend and cost-per-conversion, and a bottom row of GA4 sessions and top pages, so you can see the full path from ad click to website visit to booked appointment in one view. See the Dashboard collection for widget catalogs covering CRM, pipeline, and other native metrics you can pair alongside these.
Do I need a separate Meta or Google Analytics connection for every account? Yes. Widgets only pull data from the ad account or GA4 property connected to that specific account. If you manage multiple locations, each one needs its own connection.
How often do these widgets refresh? Both Meta Ad Widgets and Google Analytics Widgets update automatically. There's no manual refresh required.
Why is my widget blank or showing "No Data"? The most common causes are a date range that's too narrow, filters that exclude all results, no eligible ad account or GA4 property selected, or a connection that needs to be re-authorized. Widen the date range, remove filters, and confirm the integration is still connected.
Which roles can connect these integrations and add widgets? Users need permission to manage the relevant integration (Meta ad account or Google Analytics) and either Edit access to dashboards or Create/Schedule access for reports. View-only users can see shared dashboards and received reports but can't modify them.
Can I combine Meta Ads and Google Analytics widgets on the same dashboard? Yes. Add widgets from both libraries, plus your native CRM widgets, to compare ad spend, site traffic, and booked appointments side by side.
Can I schedule a report that only includes one widget type? Yes. Build a Custom Report using only Meta or only Google Analytics widgets, then schedule email delivery to whoever needs it.
Will disconnecting the integration break my existing widgets? The widgets will stop showing new data, but the layout and widget settings stay in place. Reconnect an eligible ad account or GA4 property and the widgets pick back up.
Is Universal Analytics (UA) supported? No. Only Google Analytics 4 (GA4) properties are supported for these widgets. If you're still on UA, you'll need to migrate to GA4 first.
Do dashboards and custom reports pull from different data? No. Both surfaces read from the same connected Meta ad account and GA4 property, so the numbers will match. The choice between them is about how you want to monitor or share the data, not which data you see.
