Aesthetix CRM's Dashboards give your practice a real-time view of revenue, payment activity, SMS messaging, and any custom data objects you track. This guide covers every widget available in these three categories, what each one measures, and how to add and configure them on a dashboard or in a Custom Report.
You'll find these widgets in Dashboards, either on an existing dashboard or a new one you create, and inside Reporting > Custom Reports if you want to schedule automatic delivery to your inbox.
These widgets pull from your Aesthetix CRM payments data to show how money is moving through your practice: collected revenue, subscription activity, invoices, coupons, and refunds.
Aesthetix CRM's own payment processor, AX Pay, offers better rates than Stripe and reports directly into these same revenue widgets. If you haven't switched yet, see the AX Pay help article to learn how to set it up.
Widget | What it shows |
|---|---|
Total Revenue (Last Month) | Total revenue collected over the previous calendar month. |
Total Revenue Trend | How your total revenue has changed over time, so you can spot growth patterns or dips. |
One Time Revenue Trend | Revenue from one-time payments only (treatment purchases, single sessions), excluding memberships or recurring charges. |
Recurring Revenue Trend | Revenue from active subscriptions created on the Subscriptions tab (this excludes recurring invoices), useful for tracking membership or package income. |
Widget | What it shows |
|---|---|
Paying Customer Trend | The number of unique paying patients over time. |
Payment Success Trend | The number of successful payment transactions, so you can monitor checkout and payment-form performance. |
Payment Failed Trend | The number of failed payment attempts, which can flag expired cards, declined charges, or checkout issues worth following up on. |
Widget | What it shows |
|---|---|
Revenue by Channels | Total revenue broken down by the different ways patients pay you (for example, order forms, invoices, or in-app checkout). |
Subscription Creation Trend | How many new subscriptions (memberships, package plans) were created over time. |
Subscription Cancellation Trend | Subscription cancellations over time, so you can monitor retention and churn on membership plans. |
Widget | What it shows |
|---|---|
Coupon Redemption Trend | How many times coupons have been redeemed over a given period. |
Coupon Redemption Amount Trend | The total discount amount given through coupons. |
Widget | What it shows |
|---|---|
Invoice Sent Trend | How many invoices were sent to patients over time. |
Invoice Paid Trend | How many of those invoices were successfully paid. |
Widget | What it shows |
|---|---|
Refund Trend | The number of refunds processed over time. |
Refund Amount Trend | The total dollar value of refunds issued. |
Together, these widgets give you a full picture of your practice's revenue health, payment reliability, and patient payment behavior. Use them to spot growth opportunities, catch payment issues early, and keep an eye on membership retention.
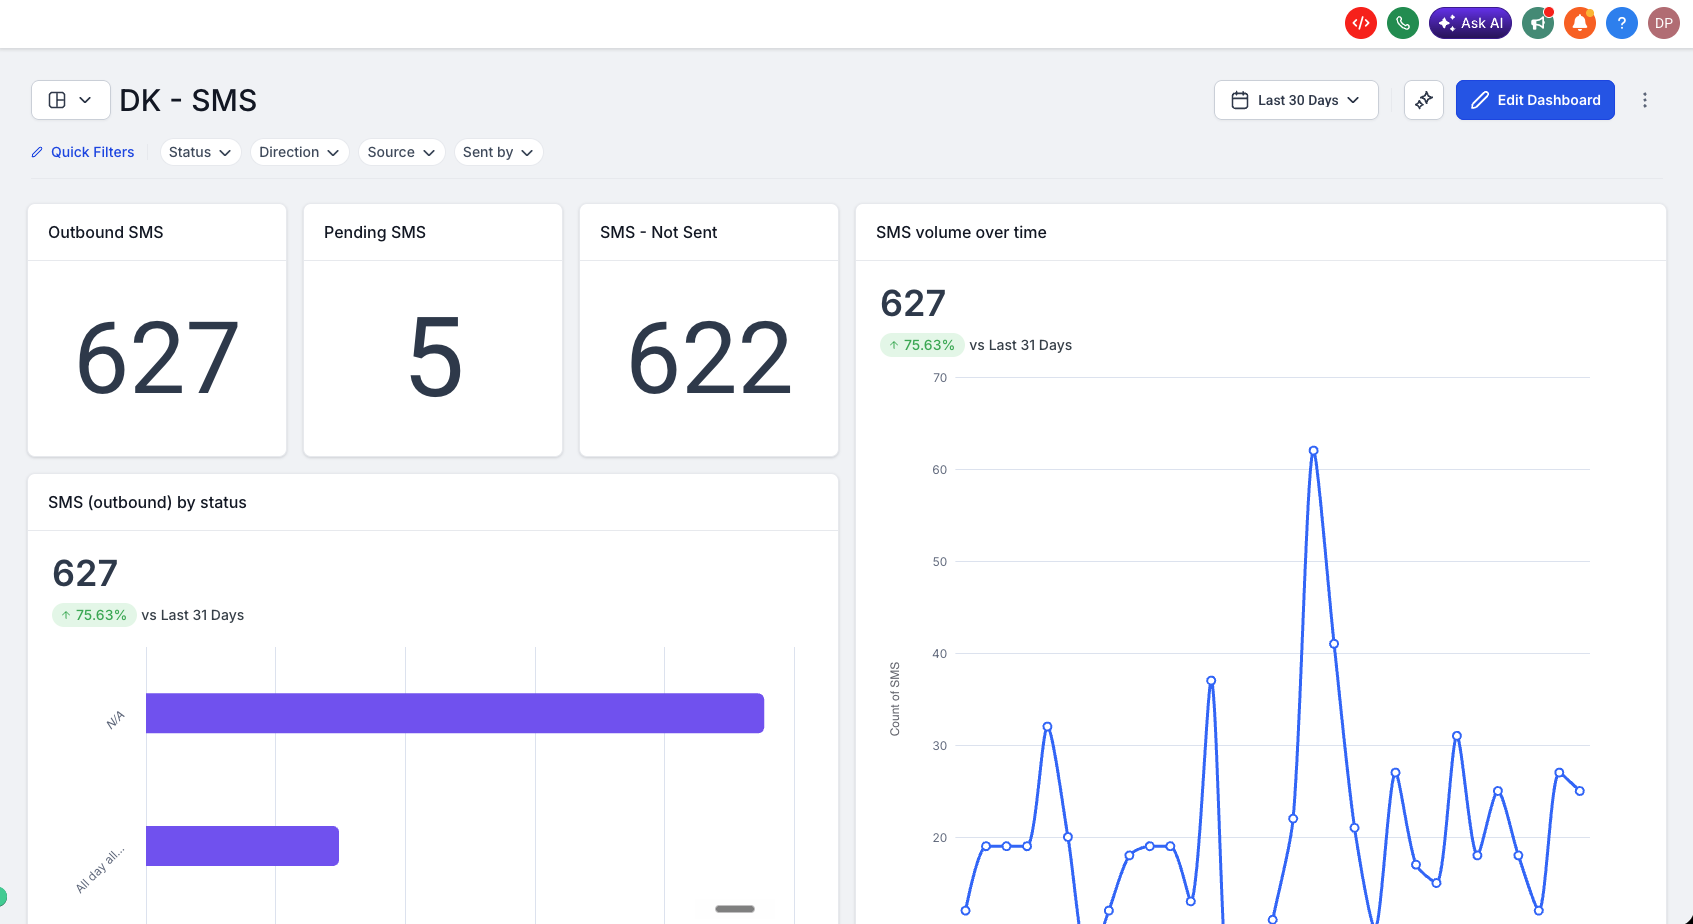
SMS widgets bring dedicated messaging analytics into your dashboard or Custom Reports so you can see SMS volume, delivery health, and team performance without digging through Conversations manually.
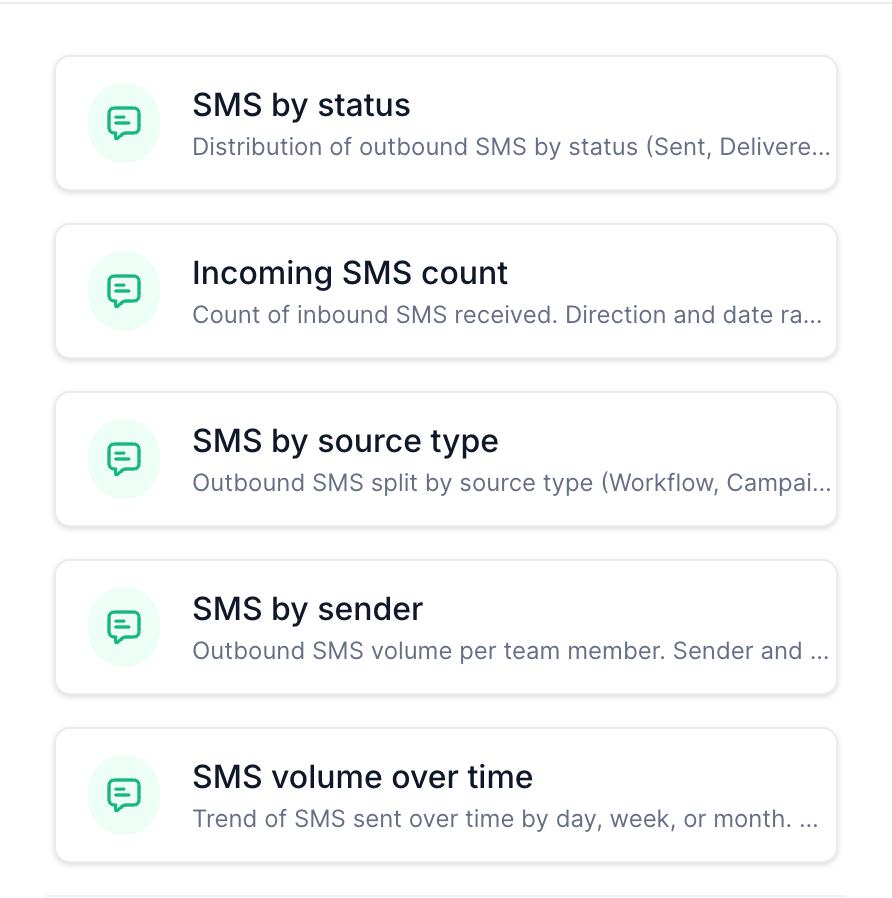
There are five SMS widgets, each covering a different angle of your text messaging activity:
Monitor delivery health: See exactly how many messages were Sent, Delivered, Failed, Pending, Undelivered, Clicked, or Read.
Track SMS volume over time: View day, week, or month breakdowns to monitor usage trends and plan capacity.
See where messages originate: Filter by Source (Workflow, Campaign, Bulk action, Other) to understand what's driving SMS usage, such as appointment reminder workflows or a promotional campaign.
Hold your team accountable: SMS by sender shows outbound volume per team member, giving front desk managers visibility into individual activity.
Close the loop on inbound: Incoming SMS count tracks patient replies so you can measure two-way engagement.
Precise control with AND/OR conditions: Stack multiple filters across Status, Direction, Source, Sent by, and Workflow to segment exactly the data you need.
The user needs Dashboards & Reports access to view or edit dashboards, or to create and schedule Custom Reports.
No additional integration or connection is required. SMS data is already available inside Aesthetix CRM.
Widget | What data it shows |
|---|---|
SMS by status | Distribution of outbound SMS by delivery status: Sent, Delivered, Failed, Pending, Undelivered, Clicked, Read. Use this to monitor messaging health and catch delivery issues early. |
Incoming SMS count | Count of inbound SMS messages received. Filter by Direction (Inbound/Outbound) and date range to track patient reply volume. |
SMS by source type | Outbound SMS broken down by the source that triggered the send: Workflow, Campaign, Bulk action, or Other. |
SMS by sender | Outbound SMS volume grouped by the team member (Sent by) who sent the message. |
SMS volume over time | Trend of total SMS sent over time, viewable by day, week, or month. Ideal for tracking usage trends and capacity planning. |
All five SMS widgets work in three places. Choose based on how you need to view, compute, and share the data.
Dashboard: Best for always-on monitoring. Widgets live on your account's dashboard and update automatically. Build an SMS health section alongside your Email and Calls widgets for a full messaging overview.
Custom Reports: Best for scheduled delivery. Add SMS widgets to a report layout and schedule automatic email delivery on a daily, weekly, or monthly cadence.
Custom Metric: Build a custom KPI that isn't just an SMS metric, combining SMS data with other modules.
Add SMS widgets to a dashboard
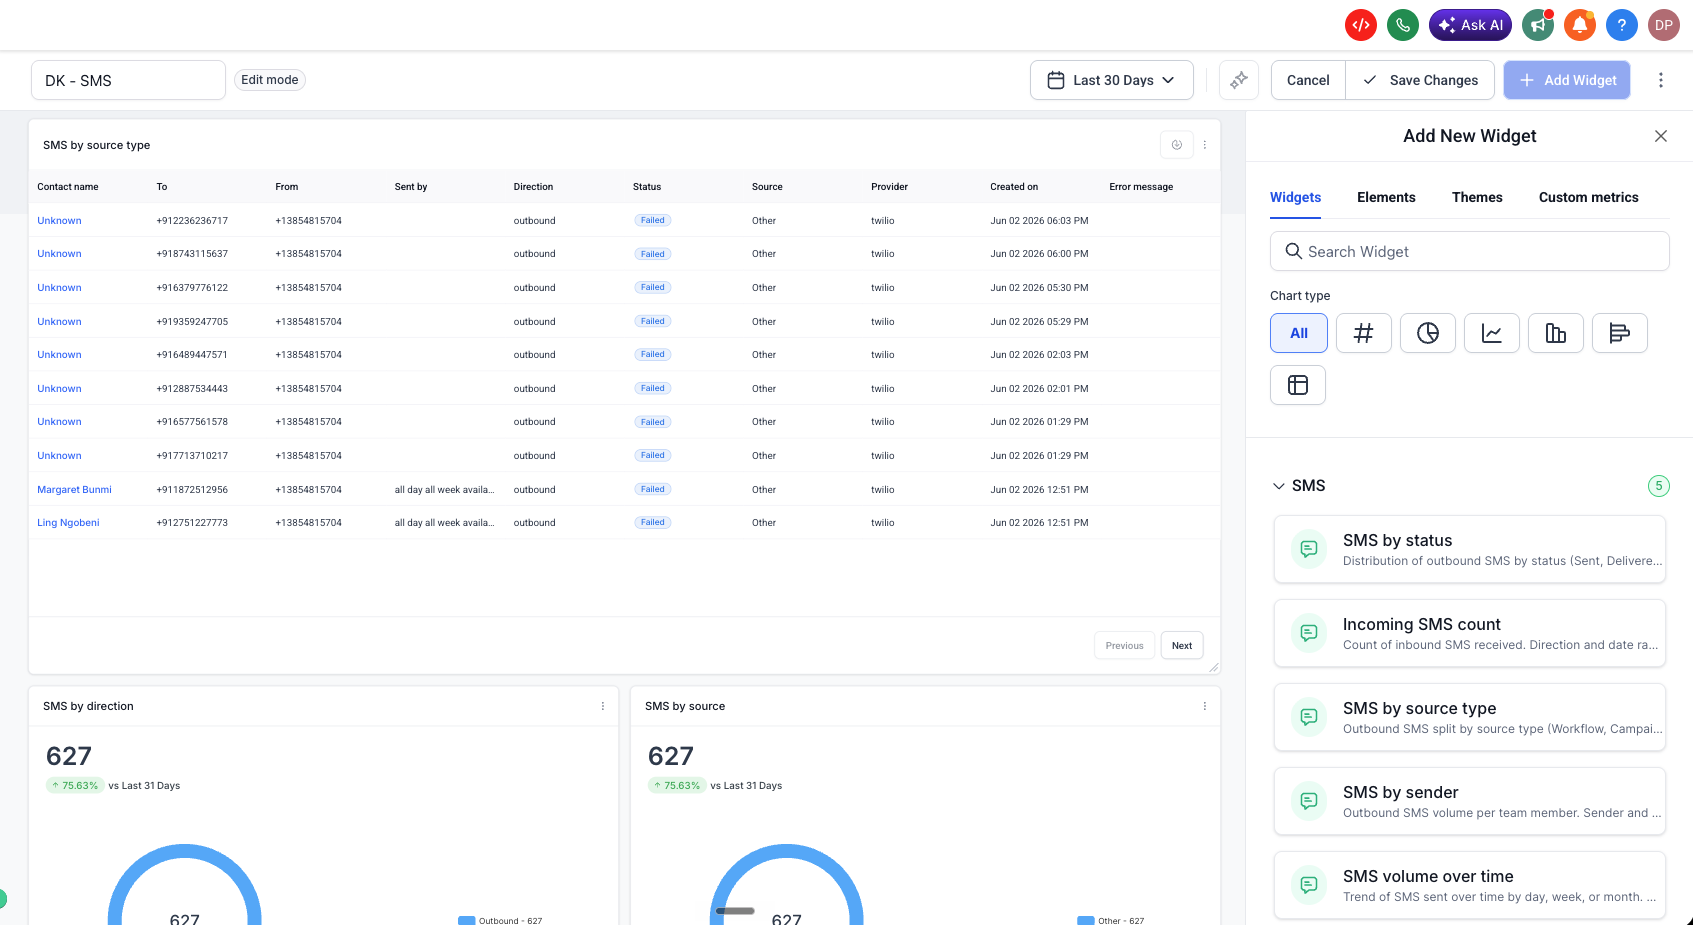
In your account, navigate to Dashboards and open the dashboard you want to edit (or create a new one).
Click Edit Dashboard in the top right corner.
Click + Add Widget. The widget panel opens on the right side.
Scroll down to the SMS section (below Emails). All 5 SMS widgets are listed here.
Click on the widget you want to add. It's placed on your dashboard canvas.
Configure the widget using the Configure, Conditions, and Themes tabs (see below).
Click Save Changes to publish the widget to your dashboard.
Add SMS volume over time and SMS by status side by side for a quick SMS health view at the top of your dashboard.
Add SMS widgets to a Custom Report
In your account, go to Reporting → Custom Reports and open an existing report or click New Report.
Choose to start from a blank canvas, use a template, or import an existing dashboard layout.
Click Add Widget / Element in the top left of the report builder.
Scroll to the SMS section and drag the widgets you want into your report layout.
Configure each widget using the Configure, Conditions, and Themes tabs.
Click Save.
Click Send or Schedule to set up automatic email delivery of the report.
Each SMS widget has three configuration tabs in the Edit Widget panel.
Configure tab
Controls how the widget looks and what data dimension it groups by.
Metric: Count of SMS.
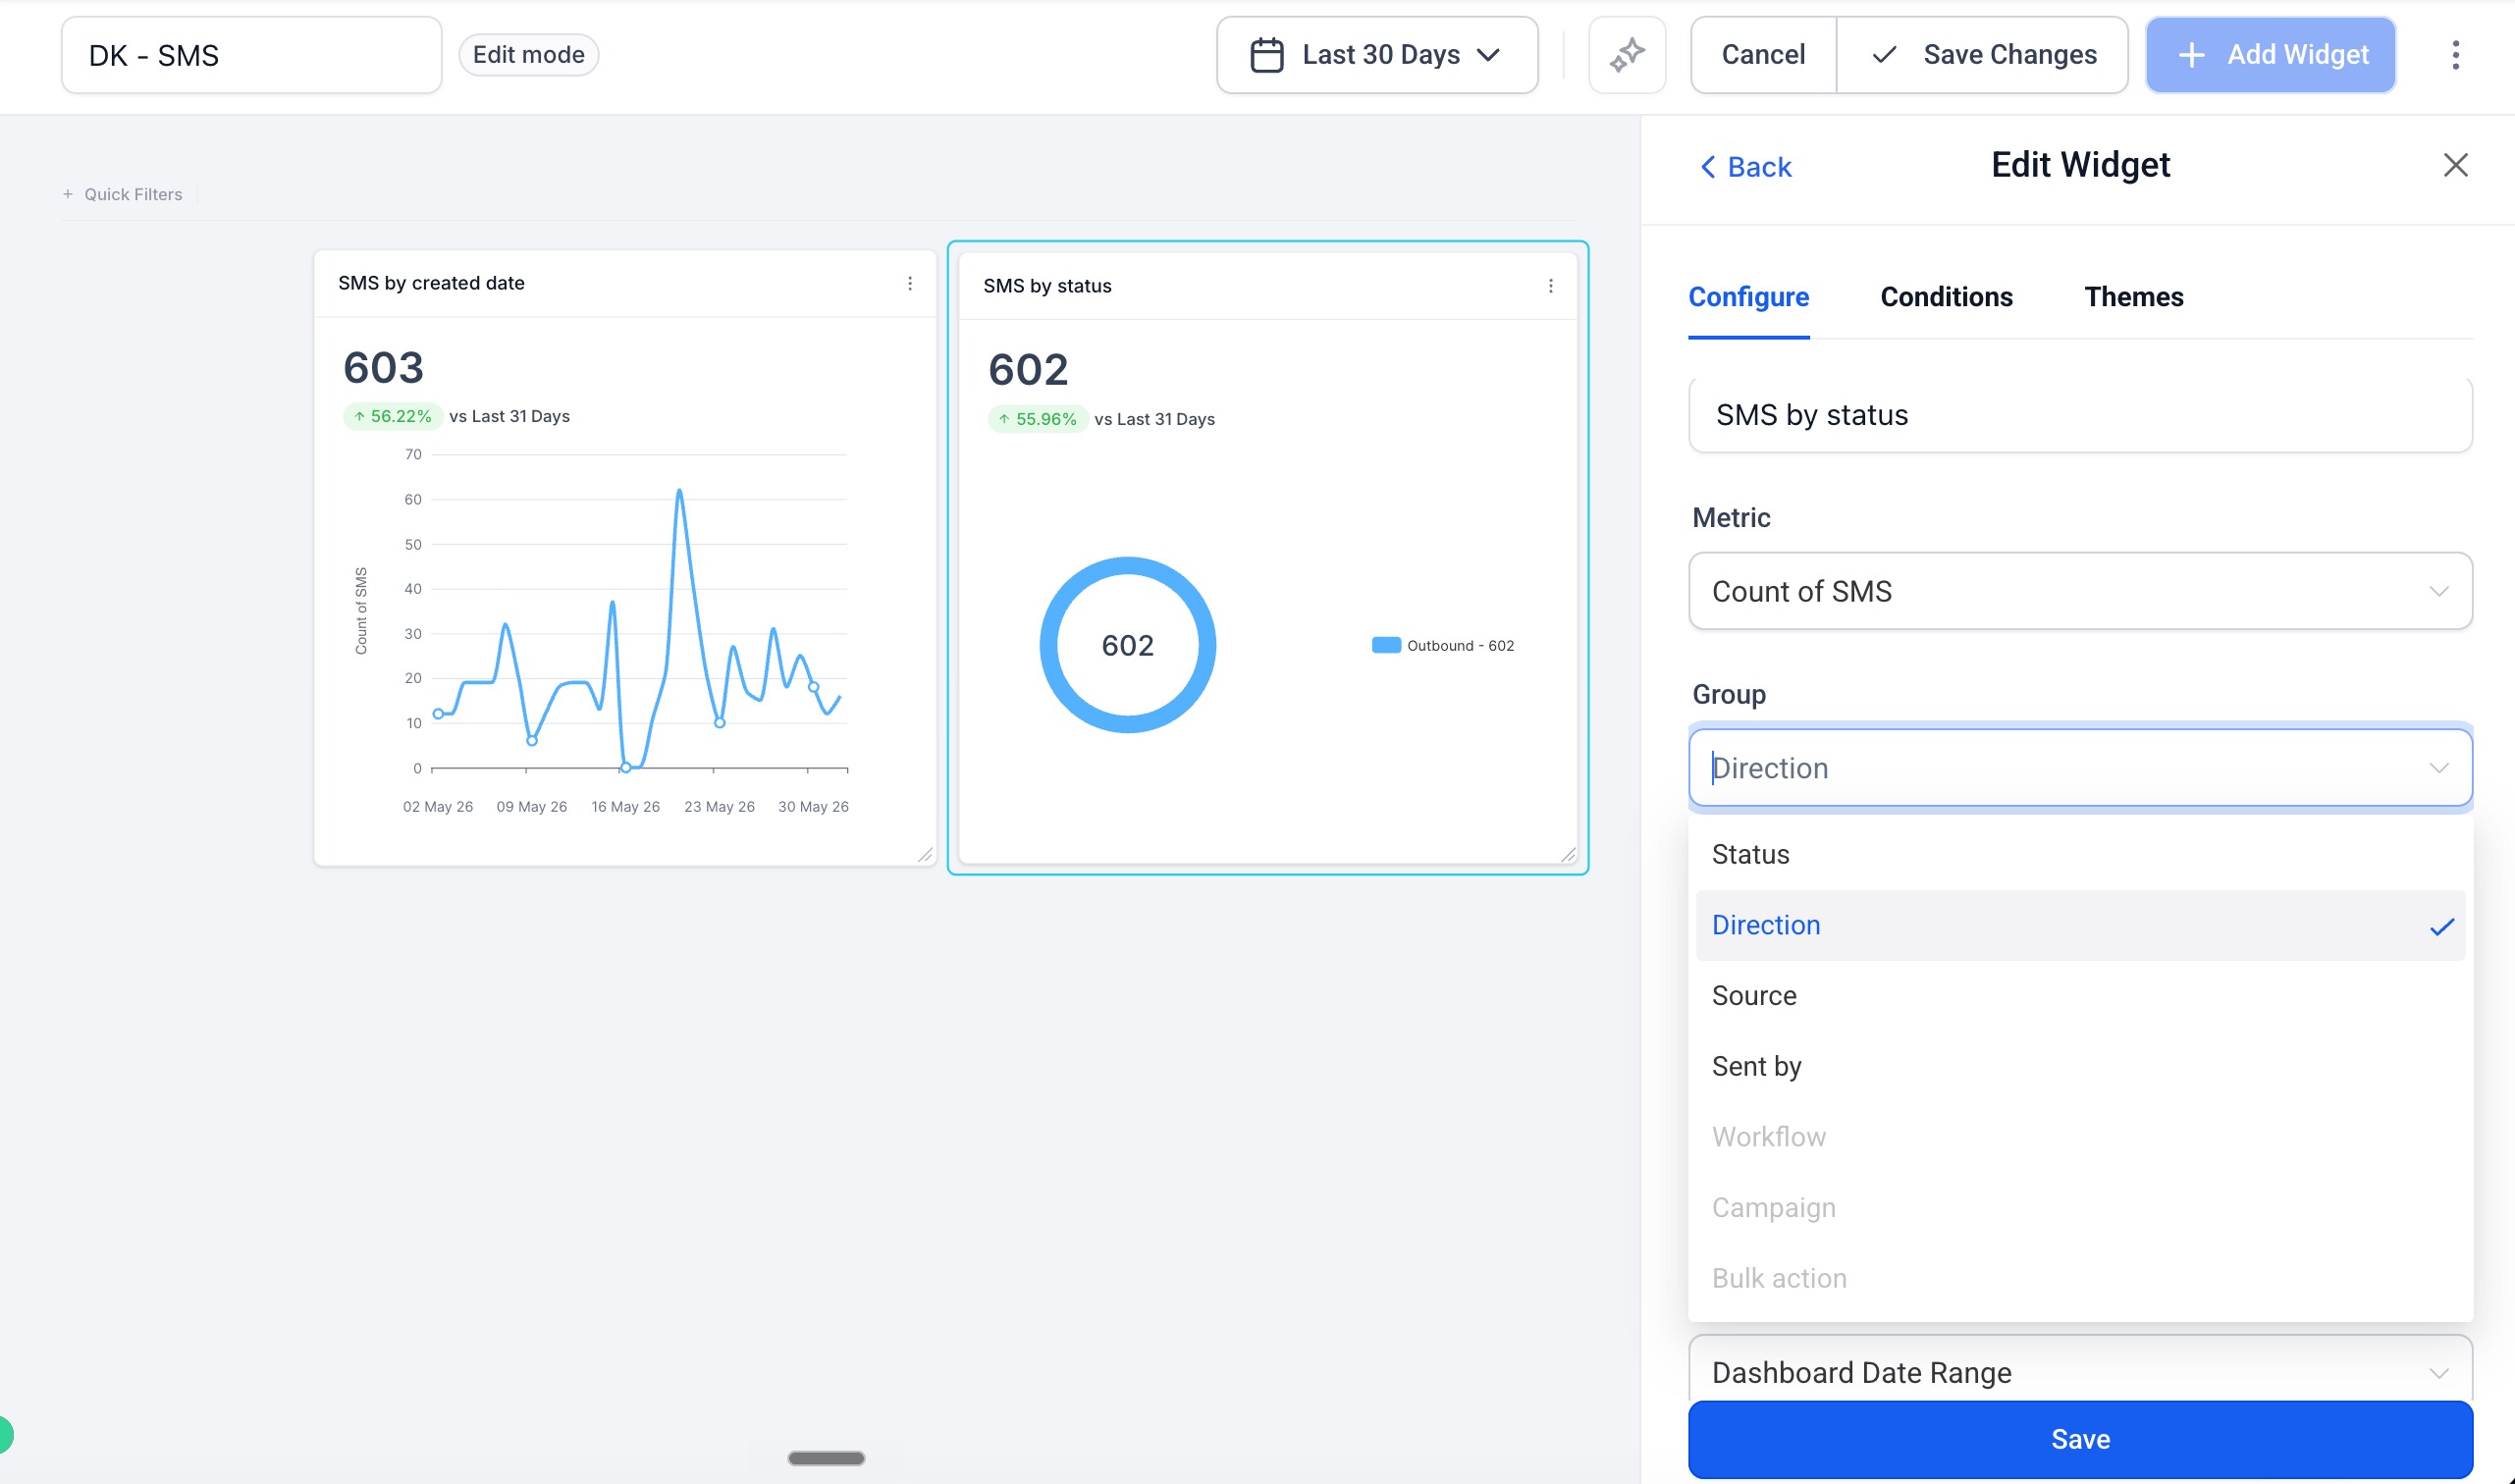
Group: Controls how widget data is broken down visually. Options are Status, Direction, Source, Sent by, and conditionally Workflow, Campaign, or Bulk action.
Workflow, Campaign, and Bulk action appear greyed out in the Group dropdown by default. To activate them:
Go to the Conditions tab first.
Add a Source filter and set its value (for example, Source = Workflow).
Make sure all condition branches use the same Source value.
Return to the Configure tab. The matching Group option is now active.
This lets you break down widget data by the specific workflow, campaign, or bulk action that triggered each SMS. For example, set Source = Workflow in Conditions, then Group by Workflow in Configure to see SMS volume broken down per workflow (useful for comparing a recall workflow against a birthday-offer workflow).
Conditions tab
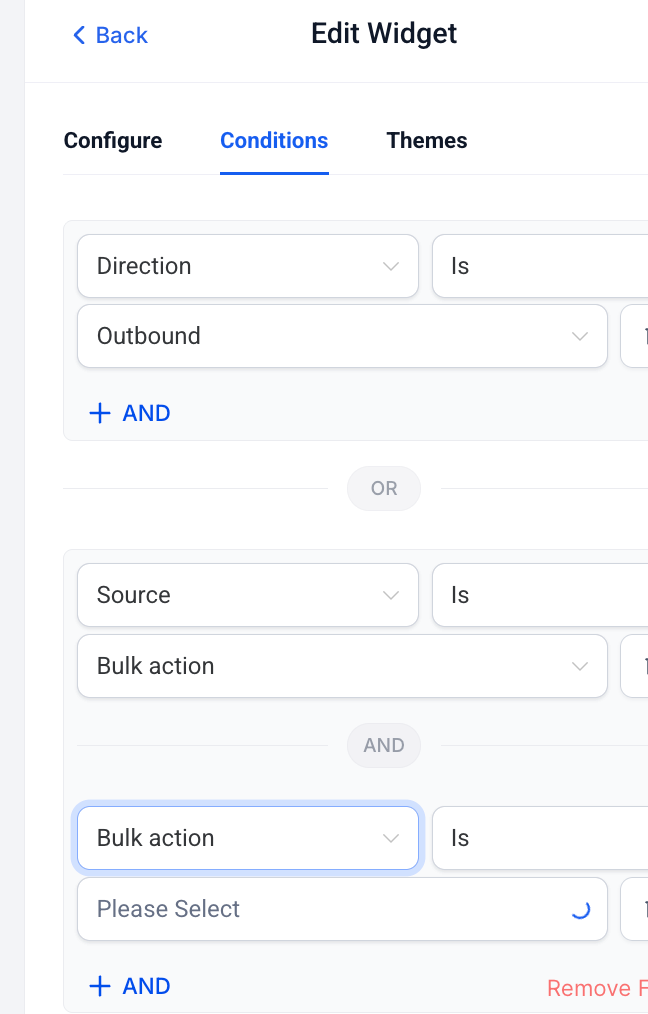
Add filters to control exactly which SMS data the widget displays. Conditions support AND/OR logic, so you can stack multiple filters to narrow or expand your dataset.
Condition | Values | Notes |
|---|---|---|
Status | Sent, Delivered, Failed, Pending, Undelivered, Clicked, Read | Filter outbound SMS by delivery outcome. |
Direction | Inbound, Outbound | Filter by message direction. |
Source | Workflow, Campaign, Bulk action, Other | Filter by what triggered the SMS send. |
Sent by | Logged in user, or any team member in the account | Filter outbound SMS by the sender. |
How AND/OR conditions work:
Use + AND to narrow results: all conditions in a group must be true.
Use OR to add a separate condition group: either group can be true.
Example: Source = Workflow AND Workflow = "Appointment Reminder" OR Source = Campaign shows SMS from one specific workflow, or from all campaigns.
Themes tab
Match widget colors to your dashboard or brand. Select from available theme presets or customize colors.
SMS is already available as a dimension in Custom Metrics. Use Count of SMS in the formula builder to create KPIs that combine SMS data with other metrics.
Go to Dashboards → Edit → Custom Metrics and click Create Custom Metric.
In the Formula builder, select Count of SMS as your metric (up to 4 metrics can be combined with operators).
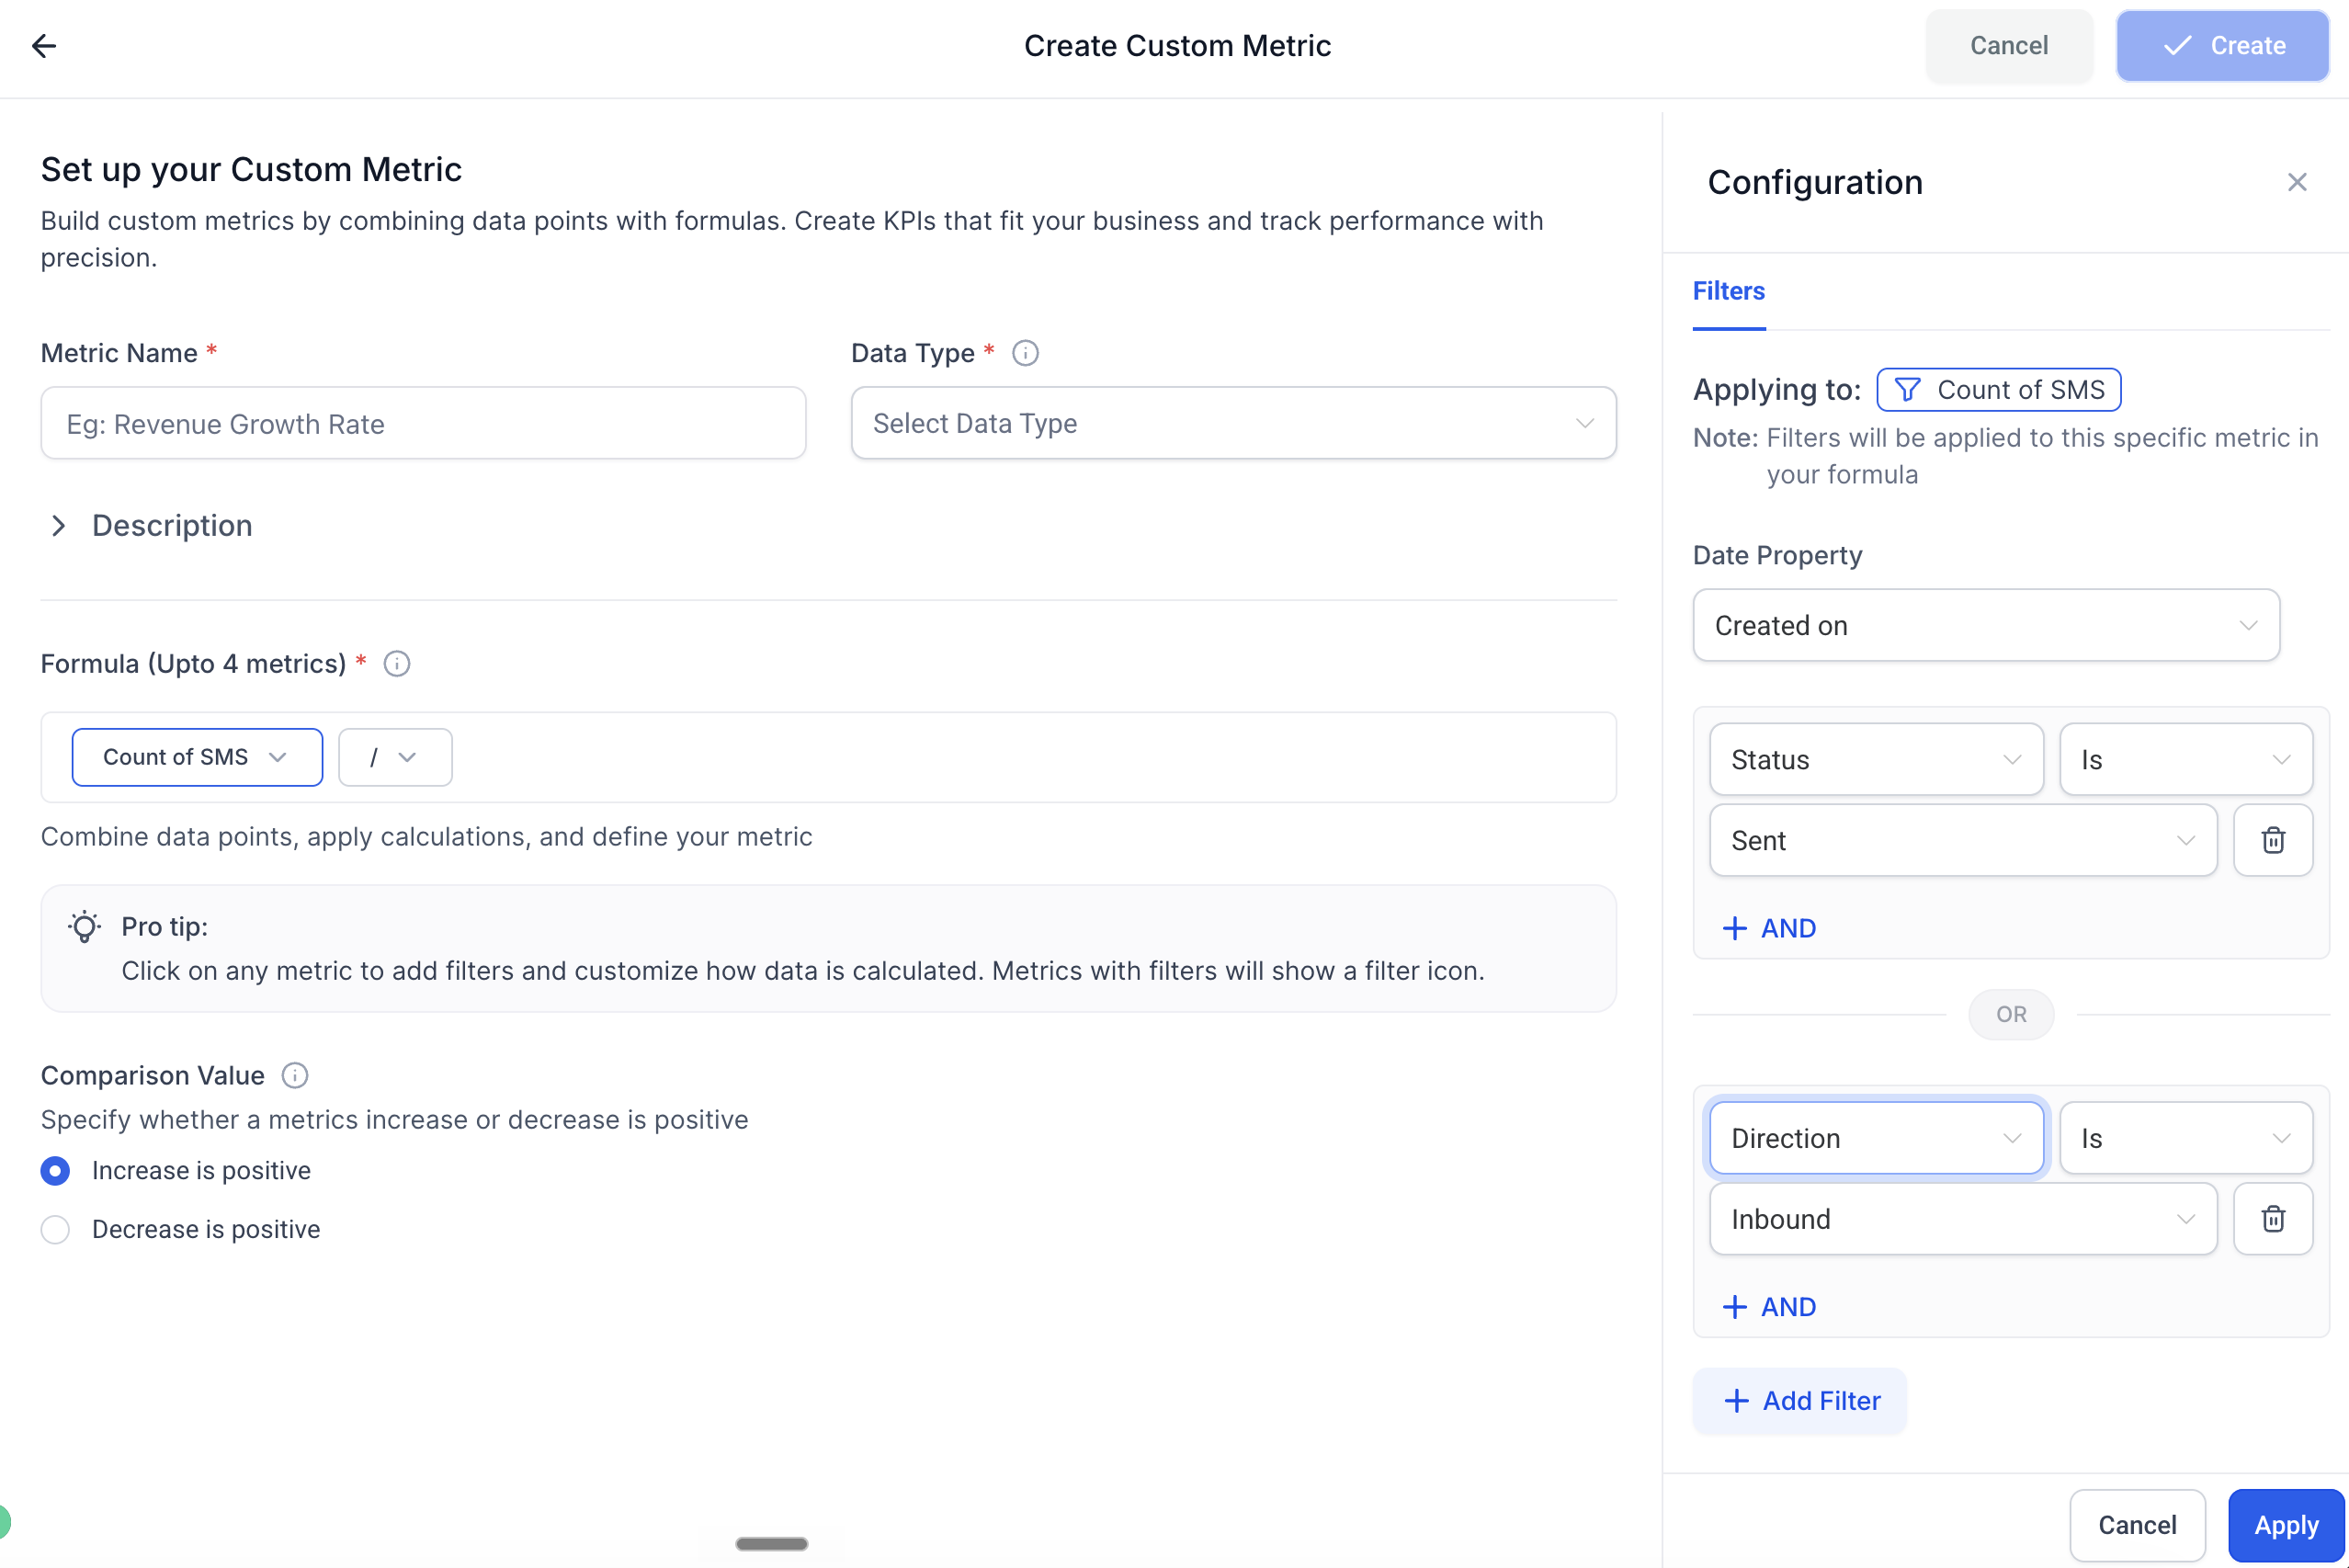
Click on Count of SMS in the formula to open the Configuration panel on the right.
Under Filters, add conditions to refine which SMS are counted. For example, Status Is Delivered to count only delivered messages, or Direction Is Inbound to count only replies received. Use + AND and OR to combine multiple filters.
Name your metric, set the Data Type, and click Create.
Example KPIs you can build:
SMS Delivery Rate: Count of SMS (Status = Delivered) ÷ Count of SMS (Status = Sent) × 100.
Inbound SMS Volume: Count of SMS (Direction = Inbound).
Campaign SMS Sent: Count of SMS (Source = Campaign).
Custom Object Widgets let you add charts that reference the Custom Objects you've created in your account settings, things like treatment packages, membership tiers, equipment inventory, or referral partners. Because every practice tracks some data that doesn't fit neatly into Contacts or Opportunities, these widgets turn those custom records into totals and averages you can filter, style, and reuse across dashboards.
Tailored analytics: Build metrics for the unique records you track (for example, average package sessions remaining).
Centralized reporting: Mix Contact, Opportunity, and Custom Object metrics on the same dashboard.
Flexible charting: Switch among Numeric, Line, Bar, Horizontal Bar, Donut, or Table to fit your story.
Reusable filters: Apply dashboard Quick Filters or widget-level filters without changing the original widget view.
Secure sharing: Custom Object Widgets respect existing dashboard permission tiers, so only the right users can view or edit them.
Metrics available: Count, Sum, Average.
Supported chart types: Numeric, Table, Bar, Horizontal Bar, Line, Donut.
A recommended chart type is pre-selected when you add a widget, and you can change it at any time from the chart picker.
Tables can display multiple fields as columns; charts can use eligible fields for grouping where supported.
Dashboard VIEW / EDIT / FULL / NO ACCESS roles apply to Custom Object Widgets the same way they apply to any other widget.
Editors can change chart type, metrics, filters, and theme. Viewers can interact with Quick Filters.
Use the three-dot menu on a widget to Duplicate or further configure it without affecting the original.
Before adding any widgets, make sure your Custom Object has already been created in Settings.
Insert a Custom Object widget into a dashboard
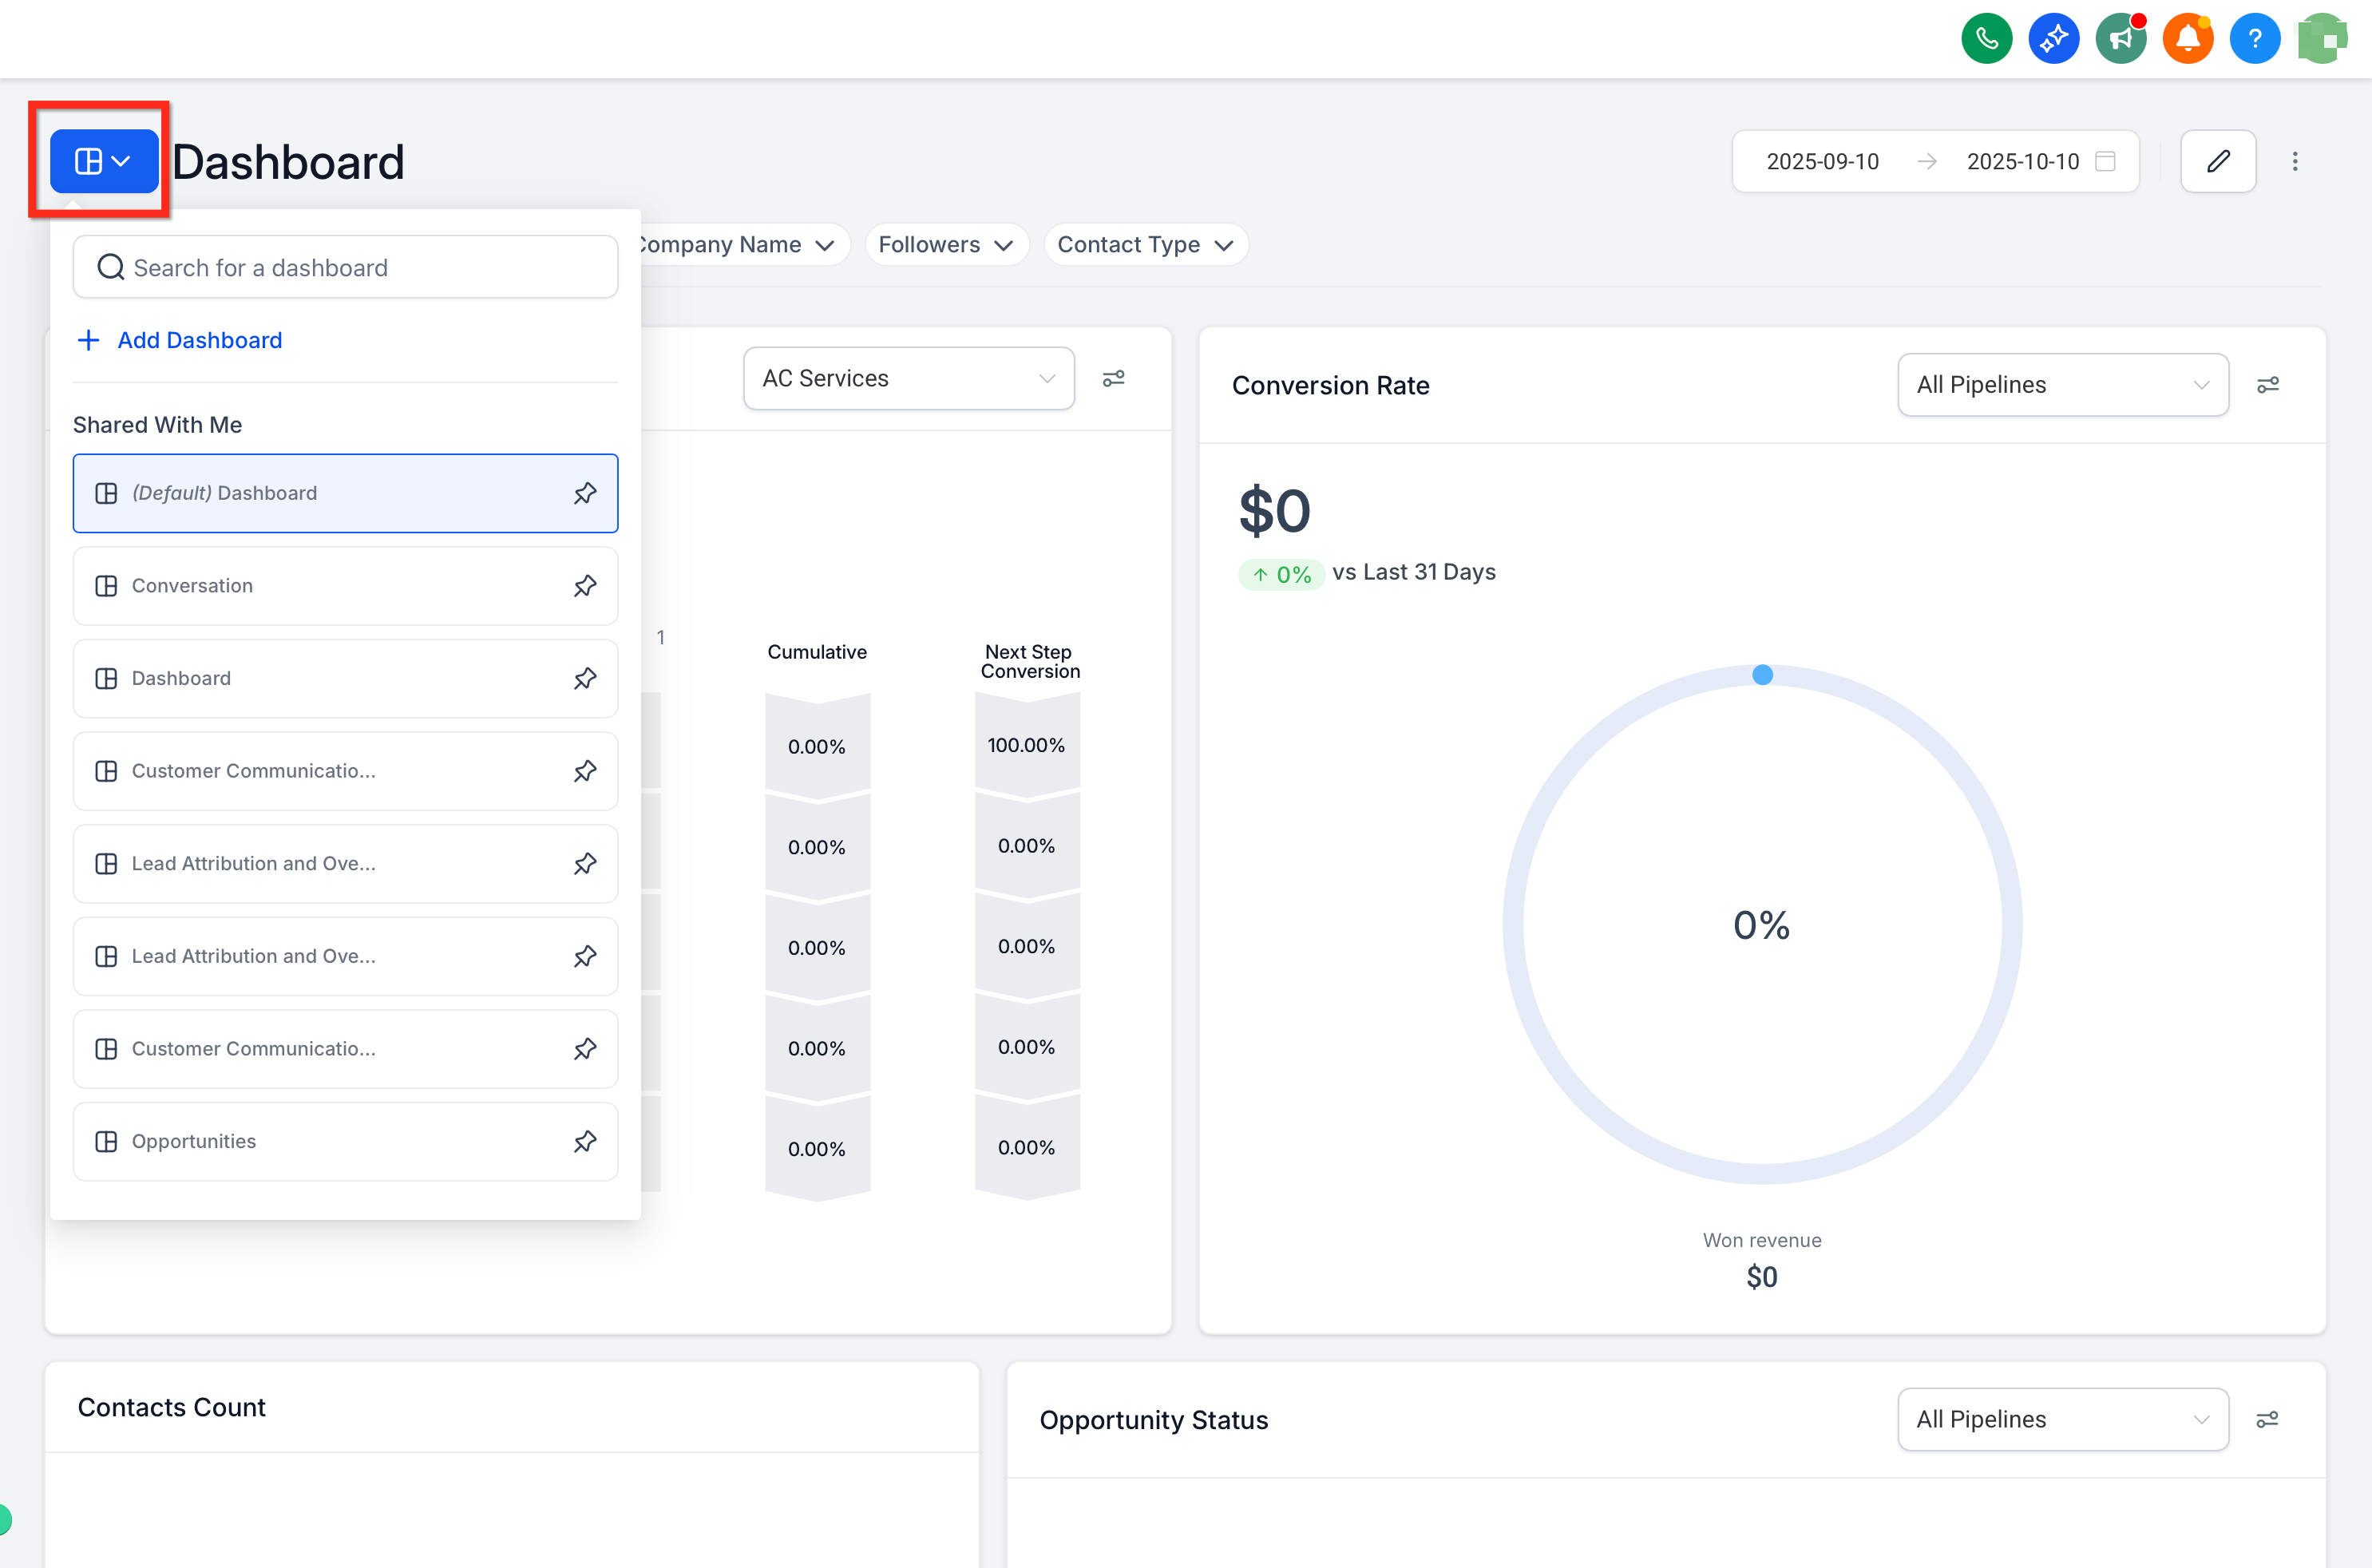
In your account, navigate to the Dashboard and click the blue button in the top-left corner to open the dashboard you want to edit.
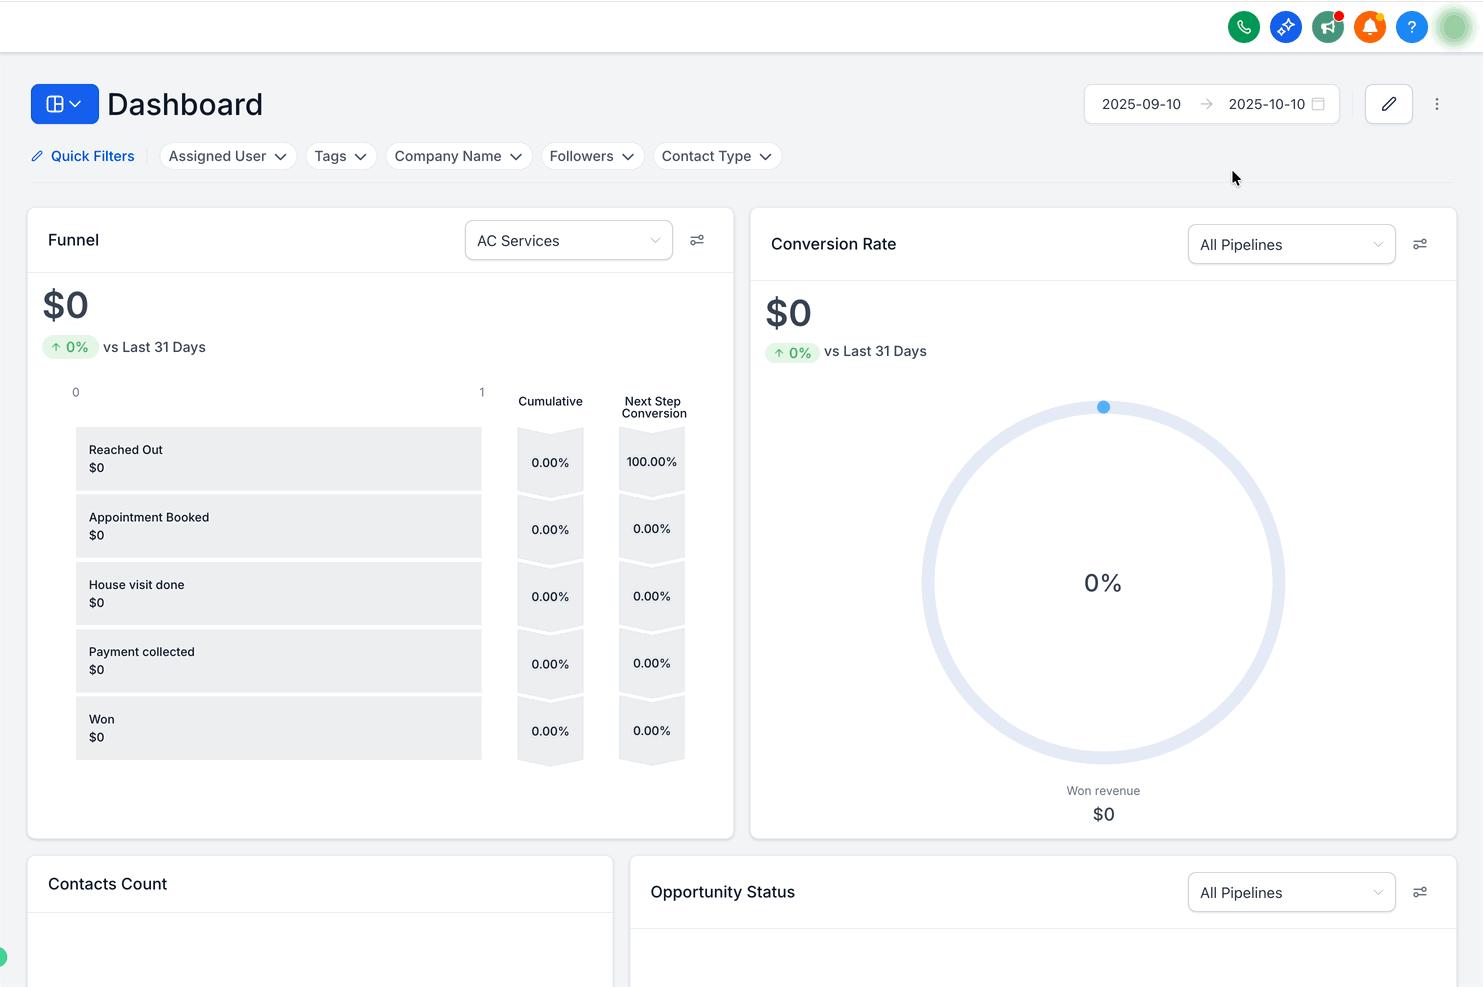
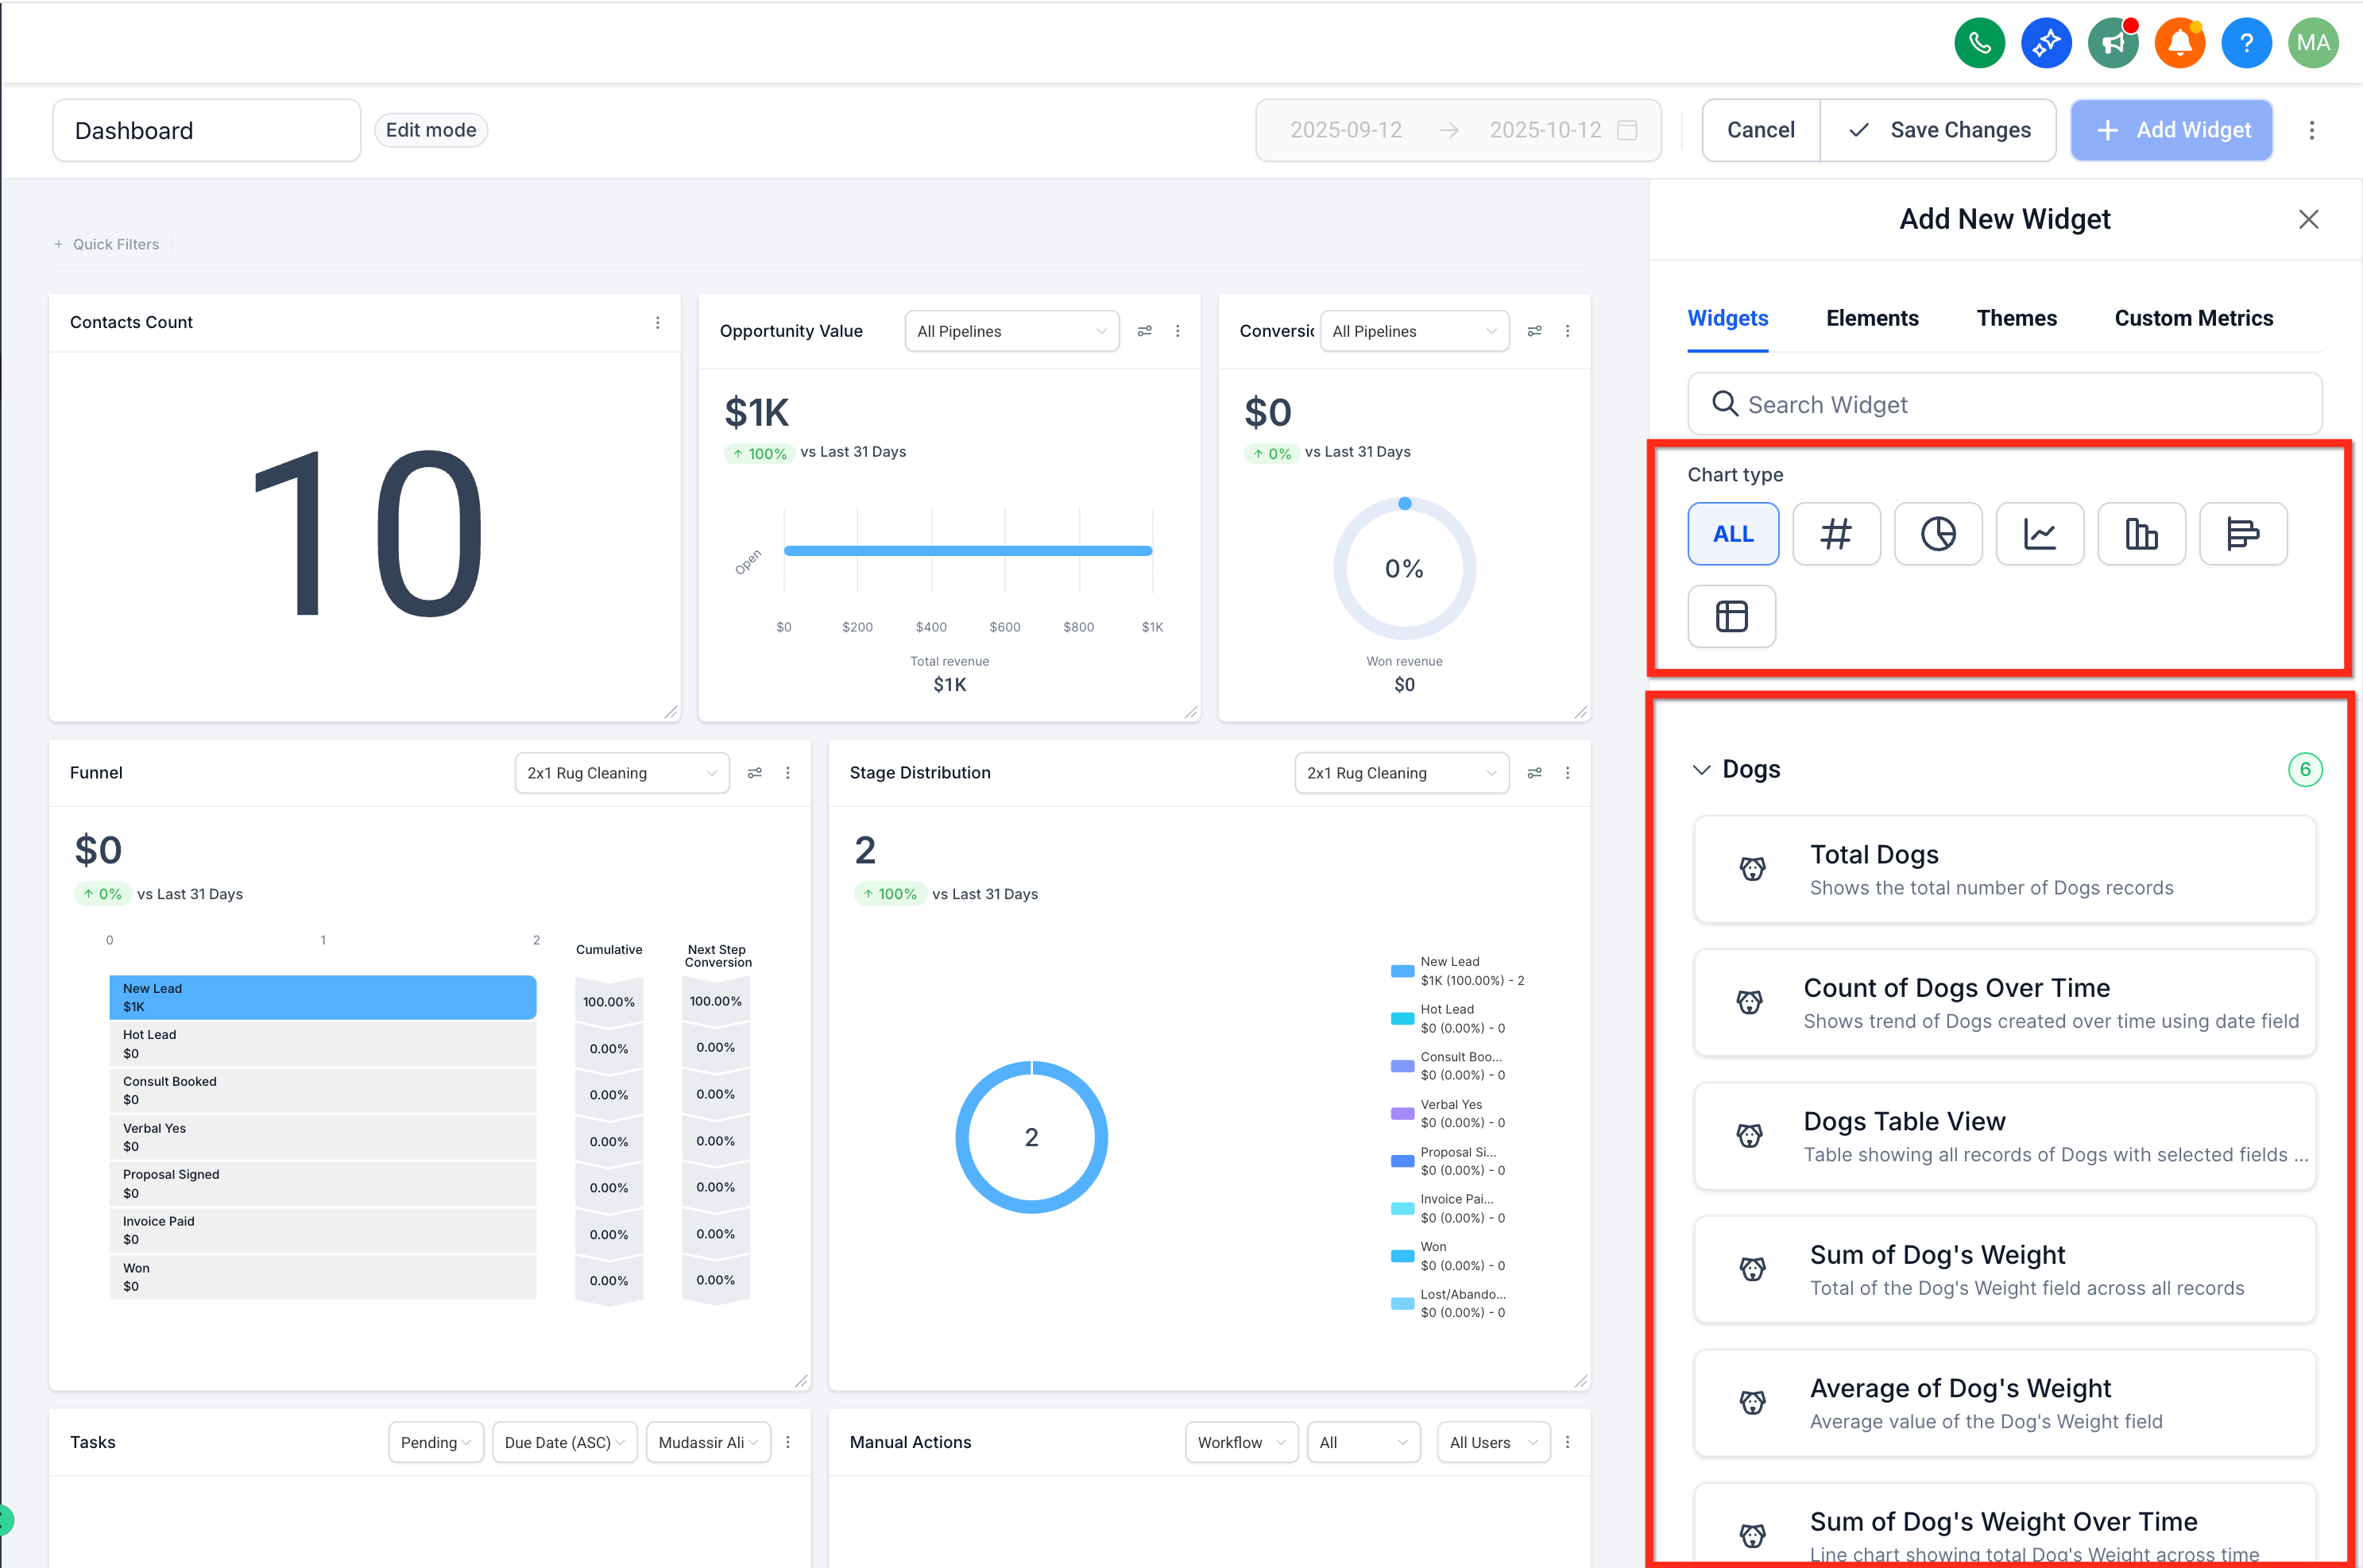
Click Edit (pencil icon) → Add Widget.
Choose your preferred chart type (Numeric, Donut, Line, Bar, or Table), then scroll to your Custom Objects category and select the metric you want.
Apply filters (for example, date range or a specific field) or switch theme and colors.
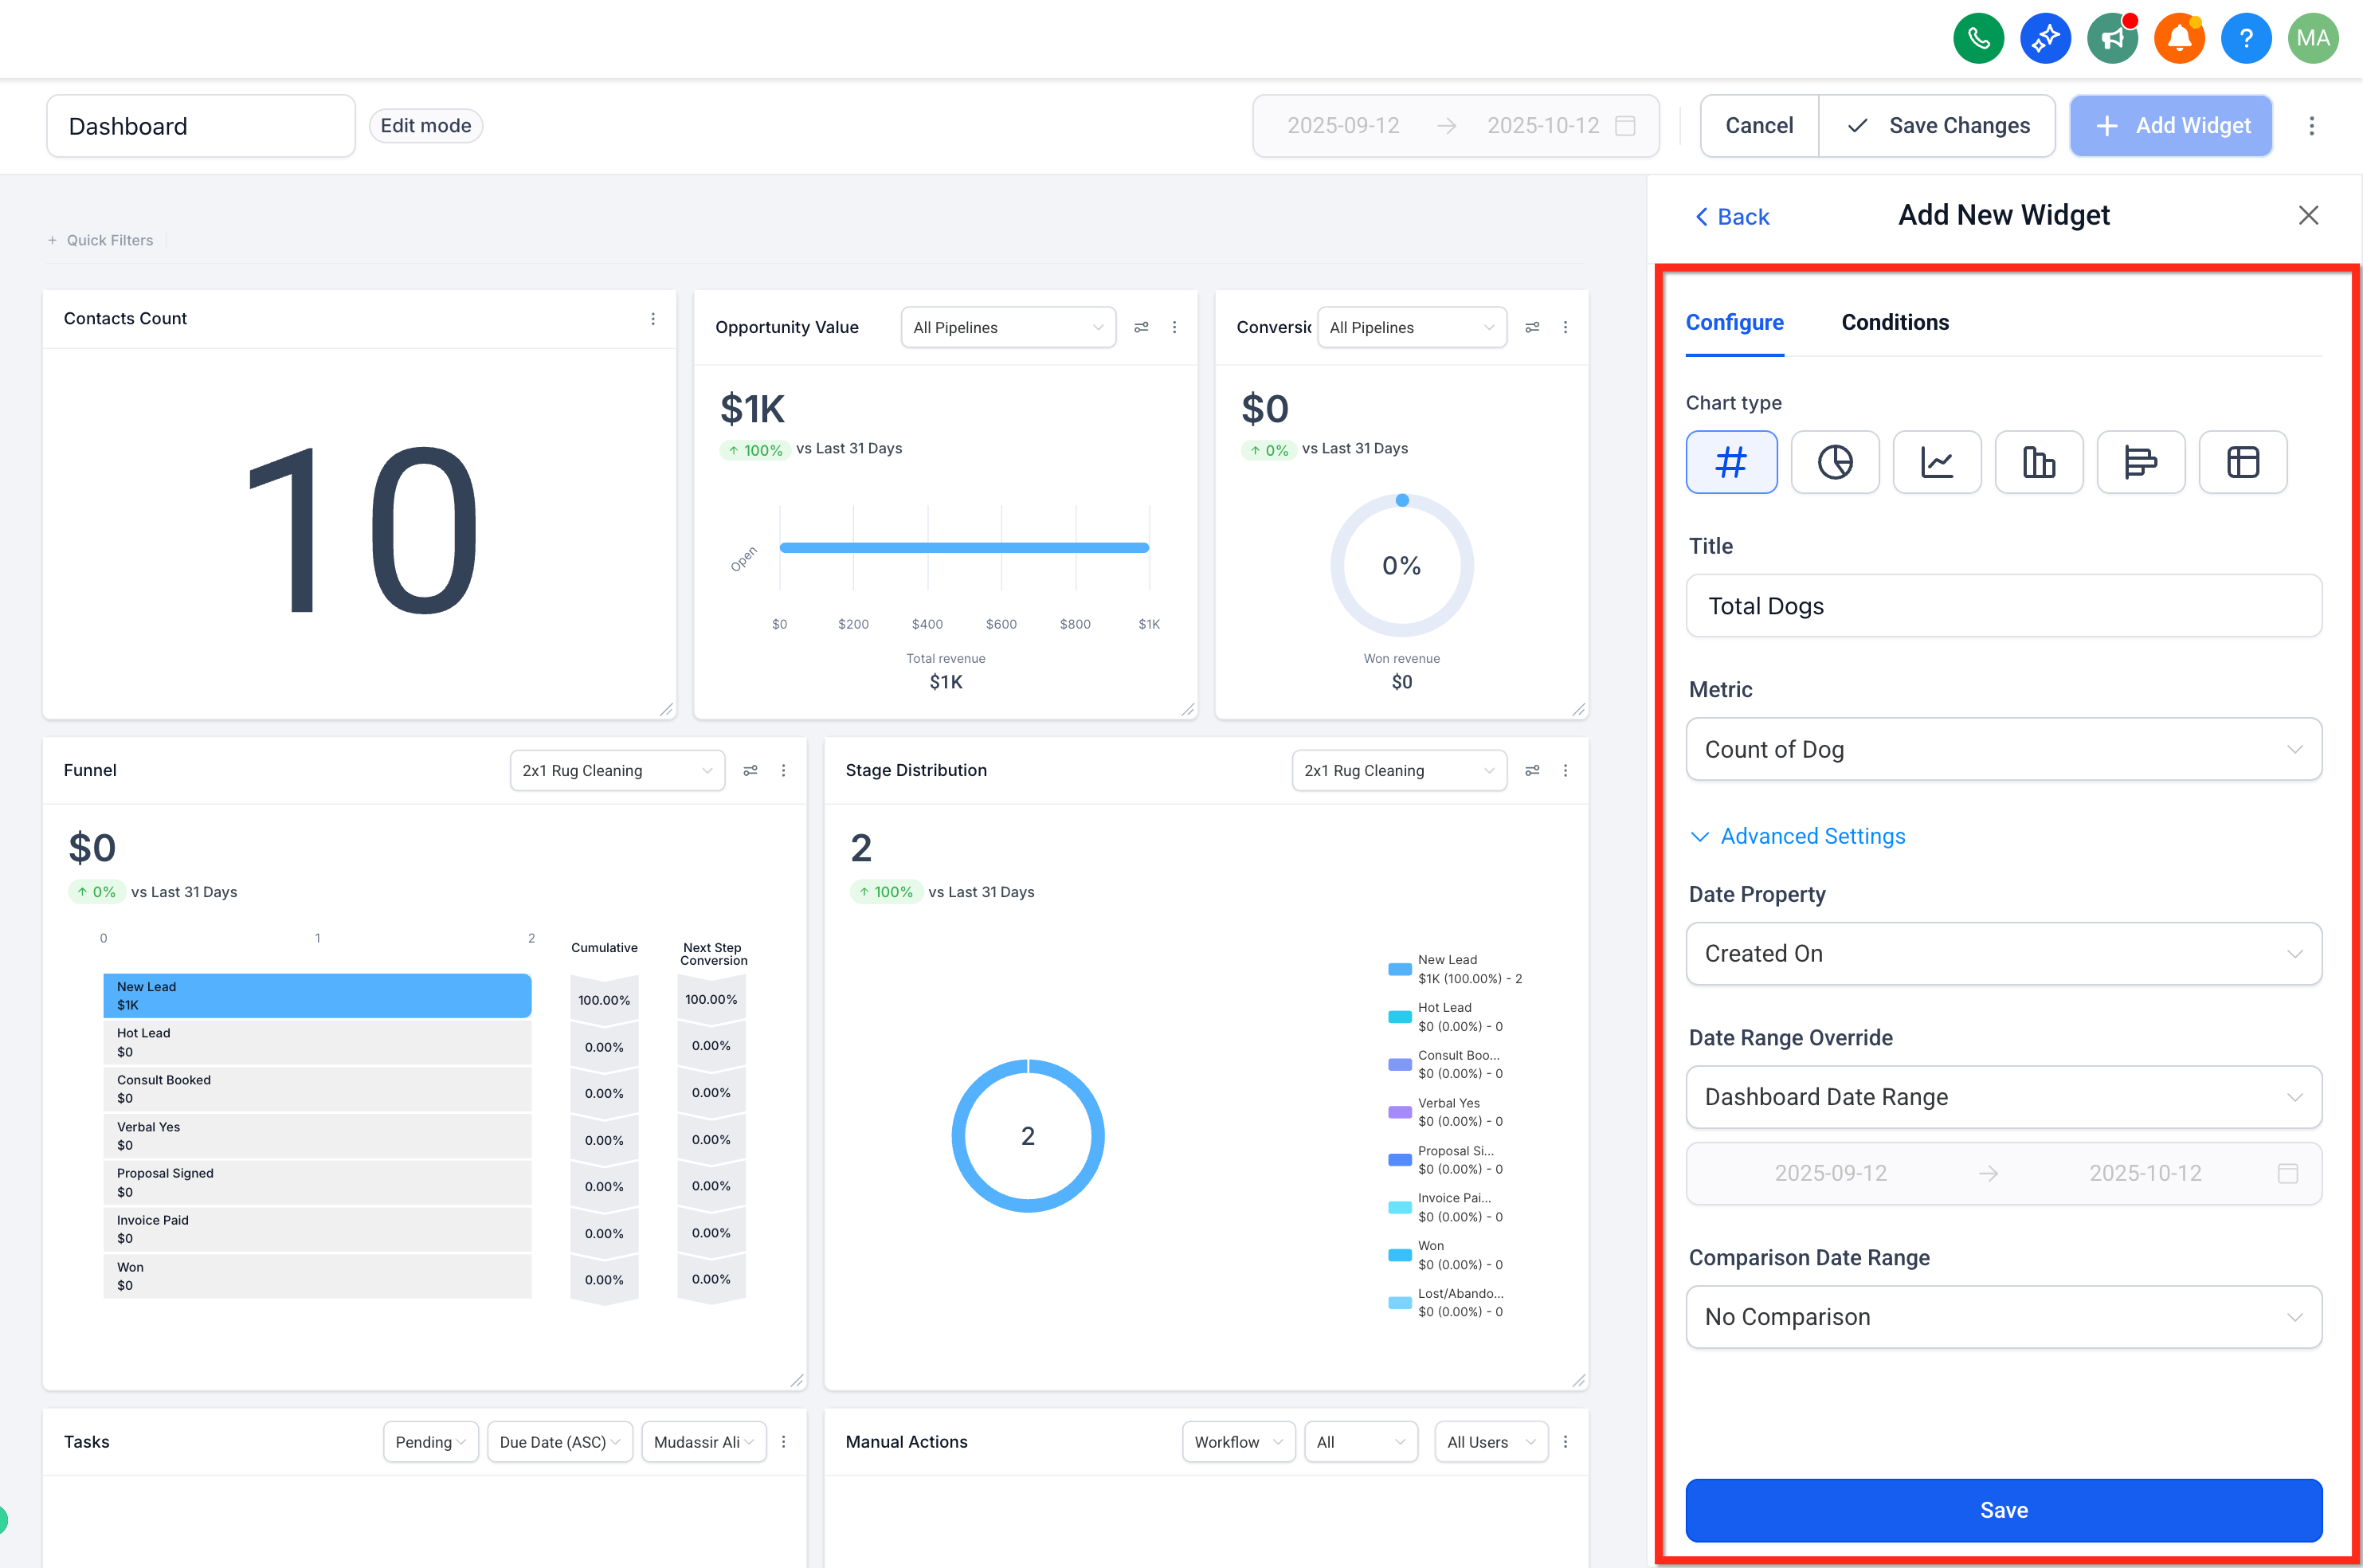
Click Save. The widget begins populating with your data.
Insert a Custom Object widget into a Custom Report
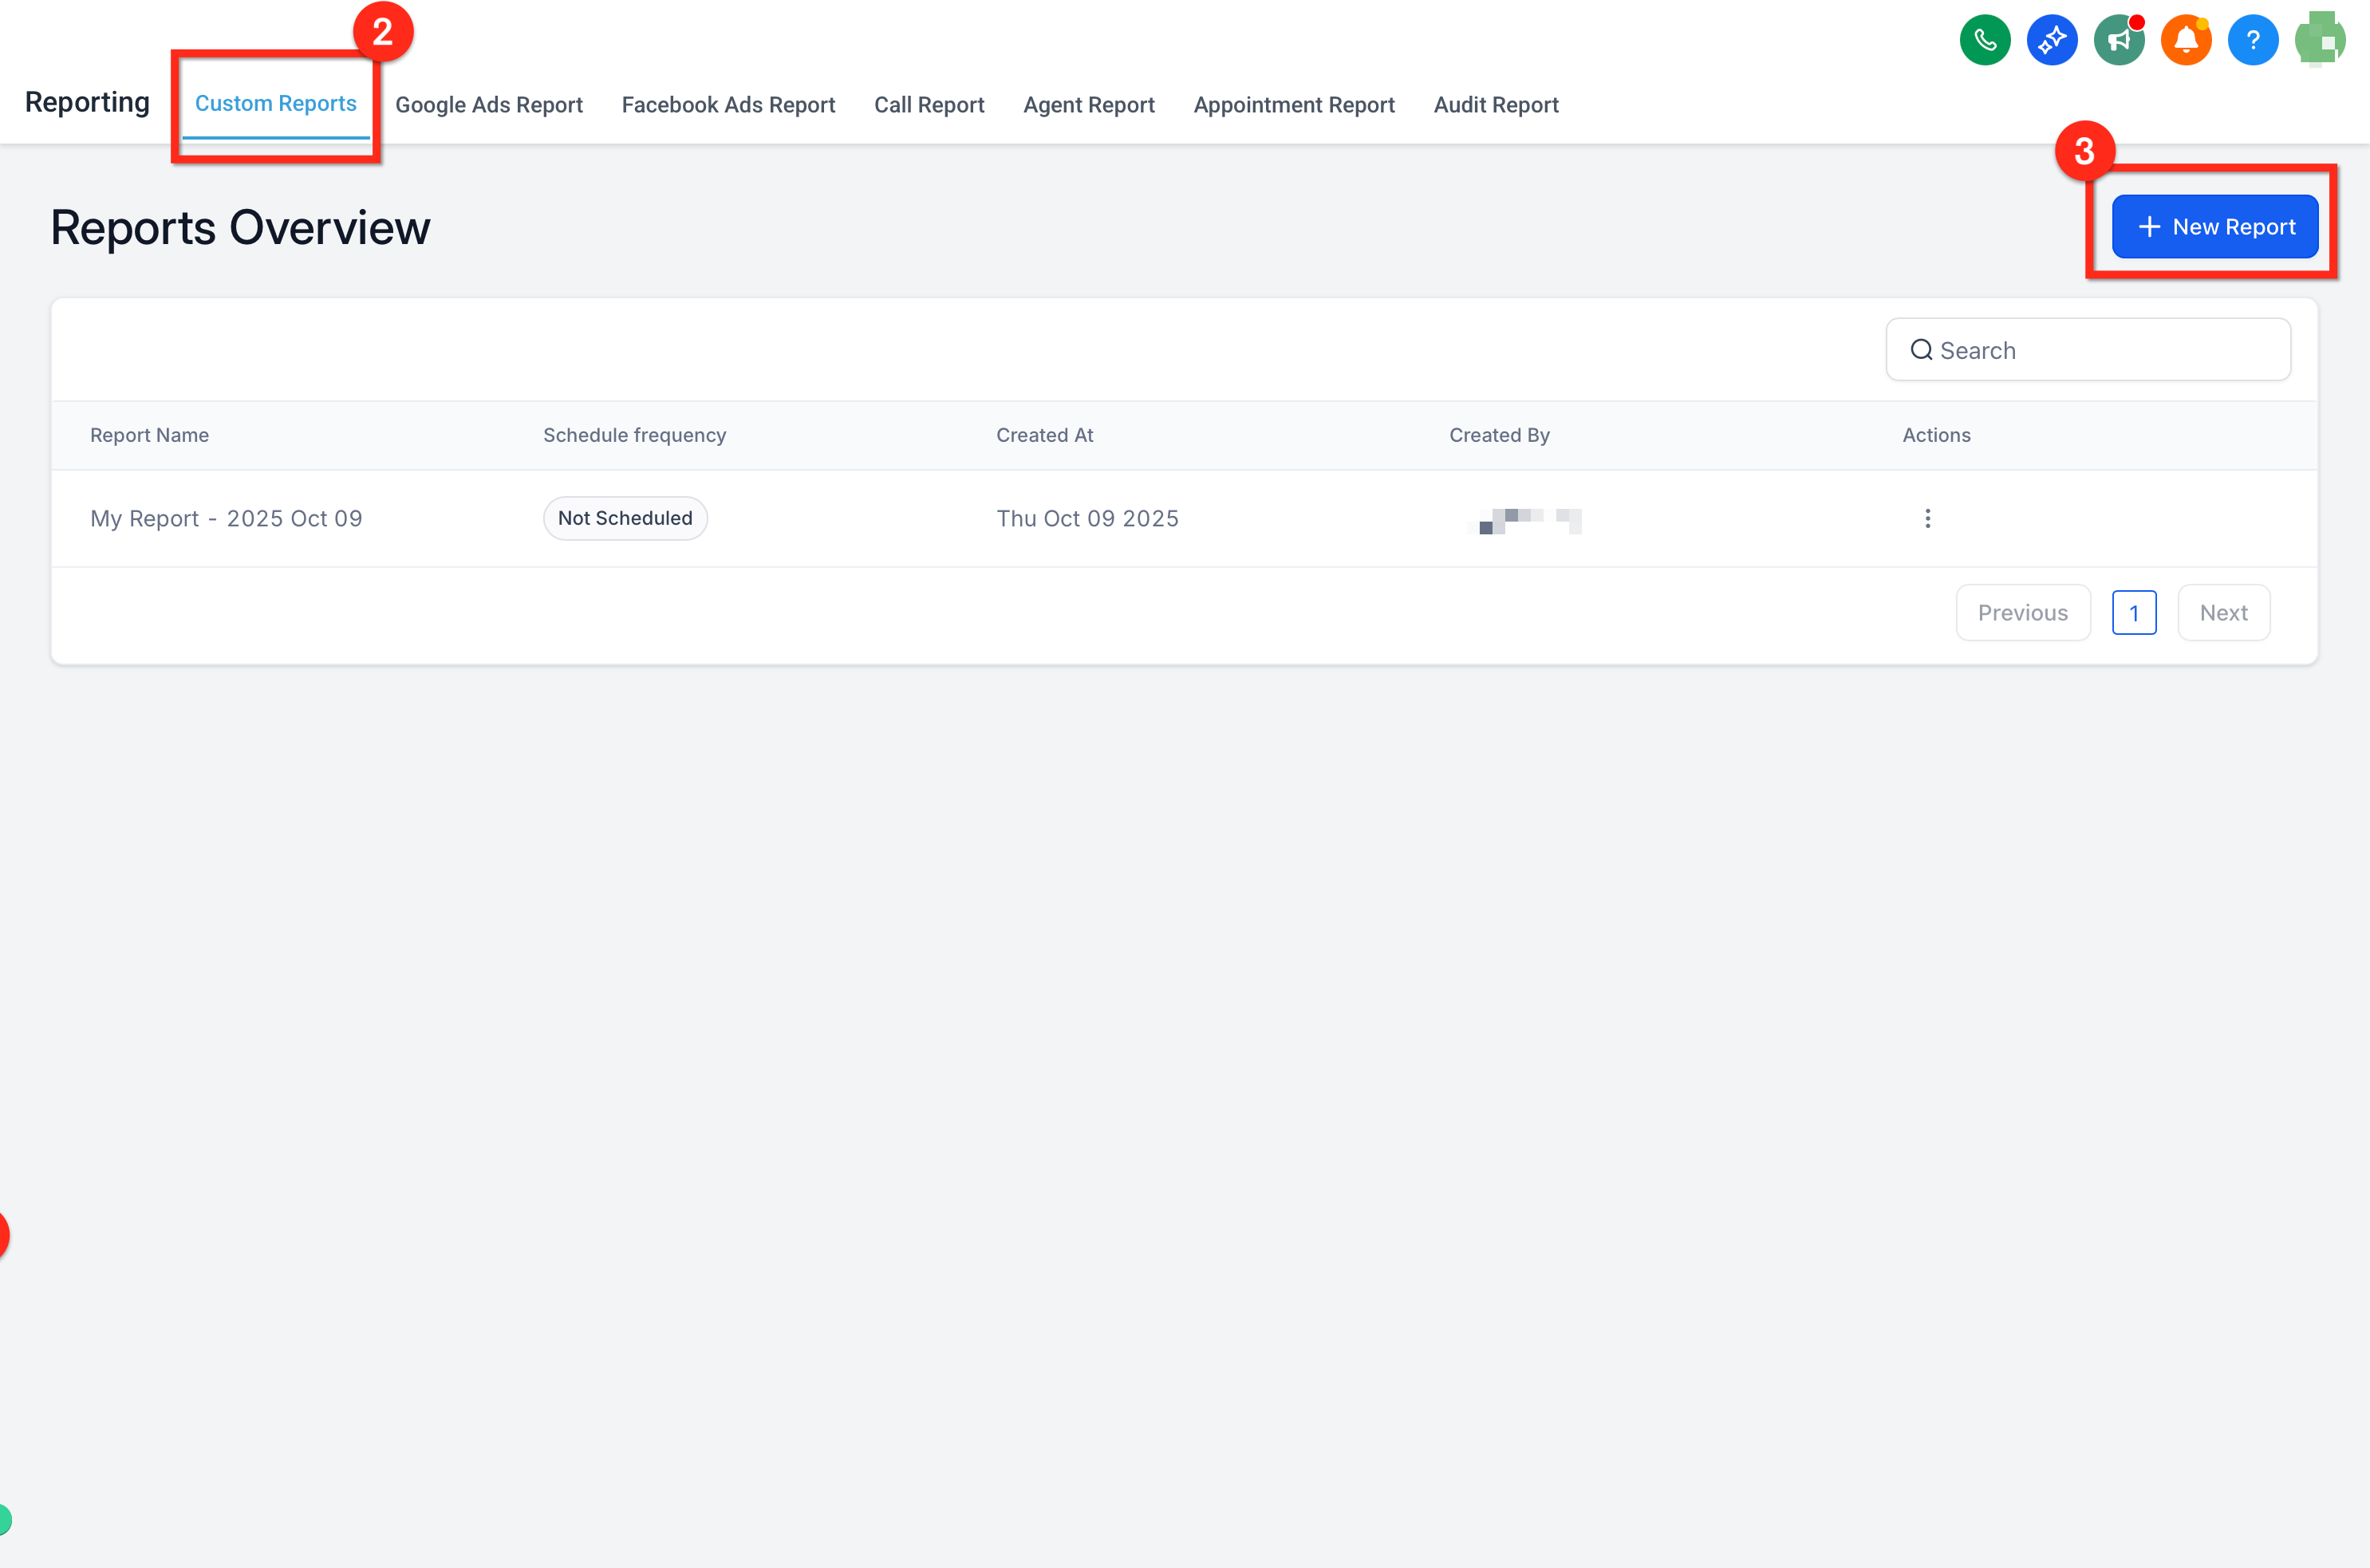
In your account, go to Reports → Custom Reports and open an existing report or click Create Report.
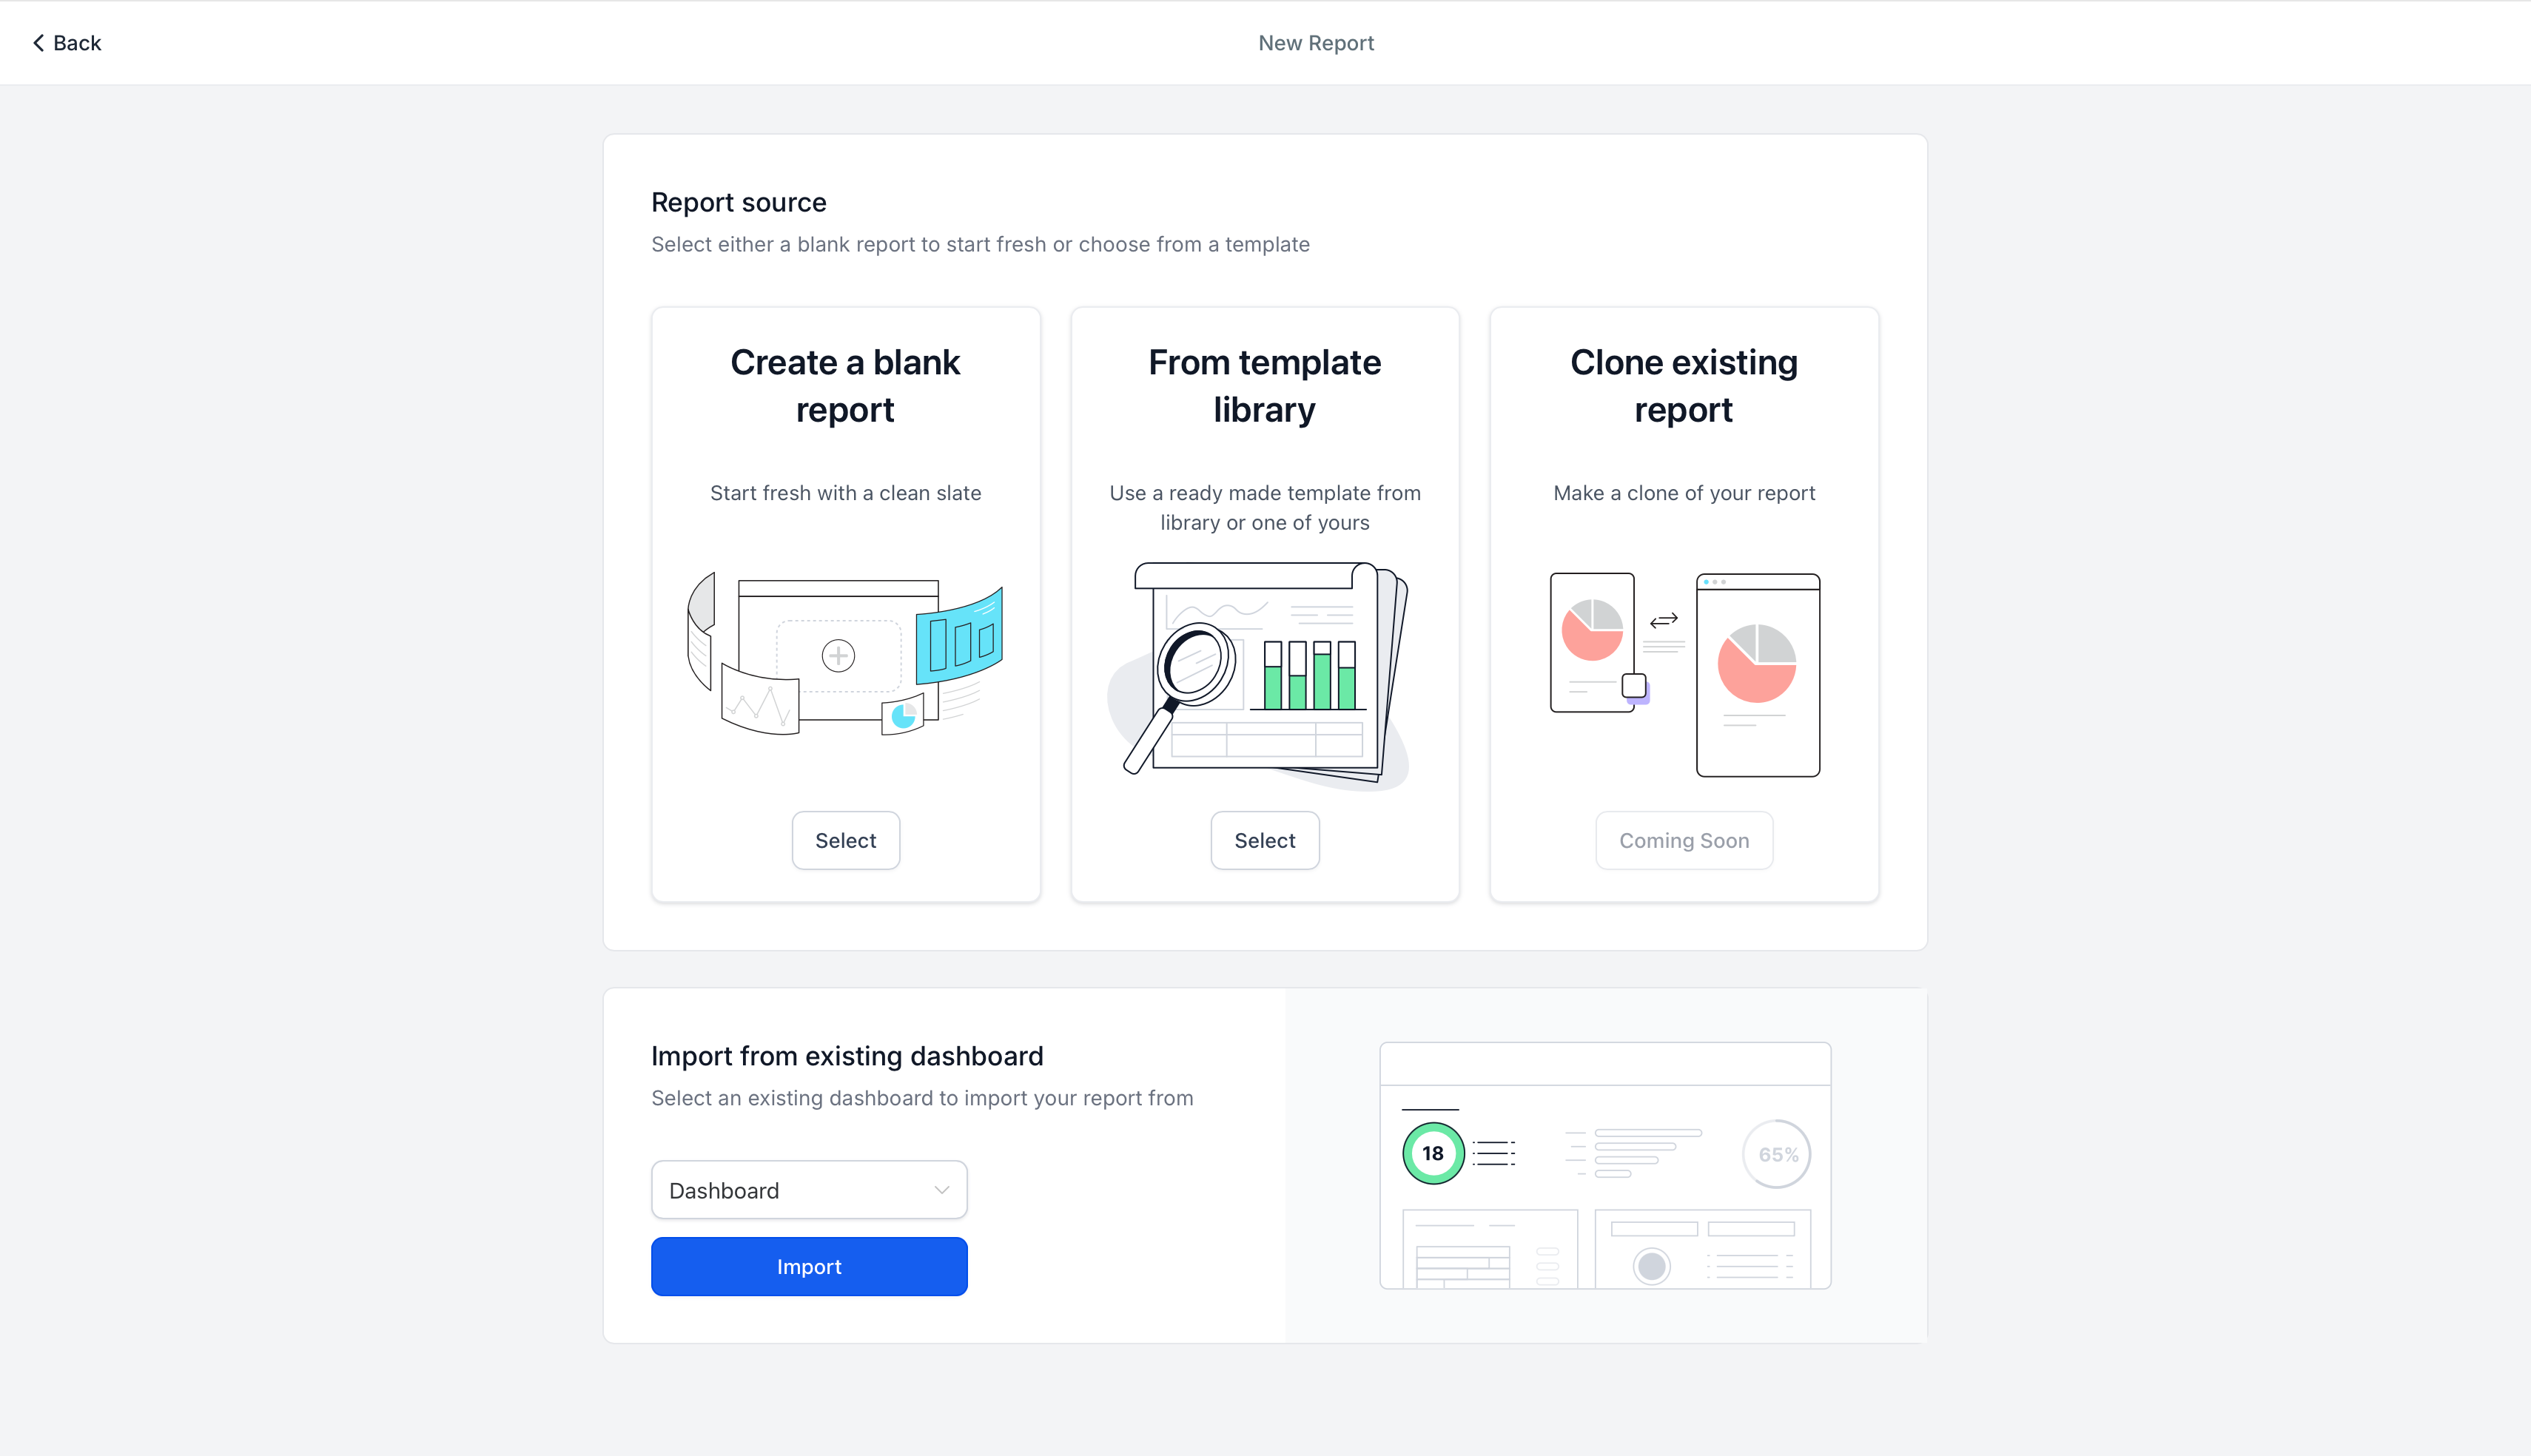
Choose to start from a blank canvas, use a template, or import an existing dashboard layout.
Click Add Widget/Element (top-left). In the widget list, find your Custom Objects category and drag the ones you want into the layout.
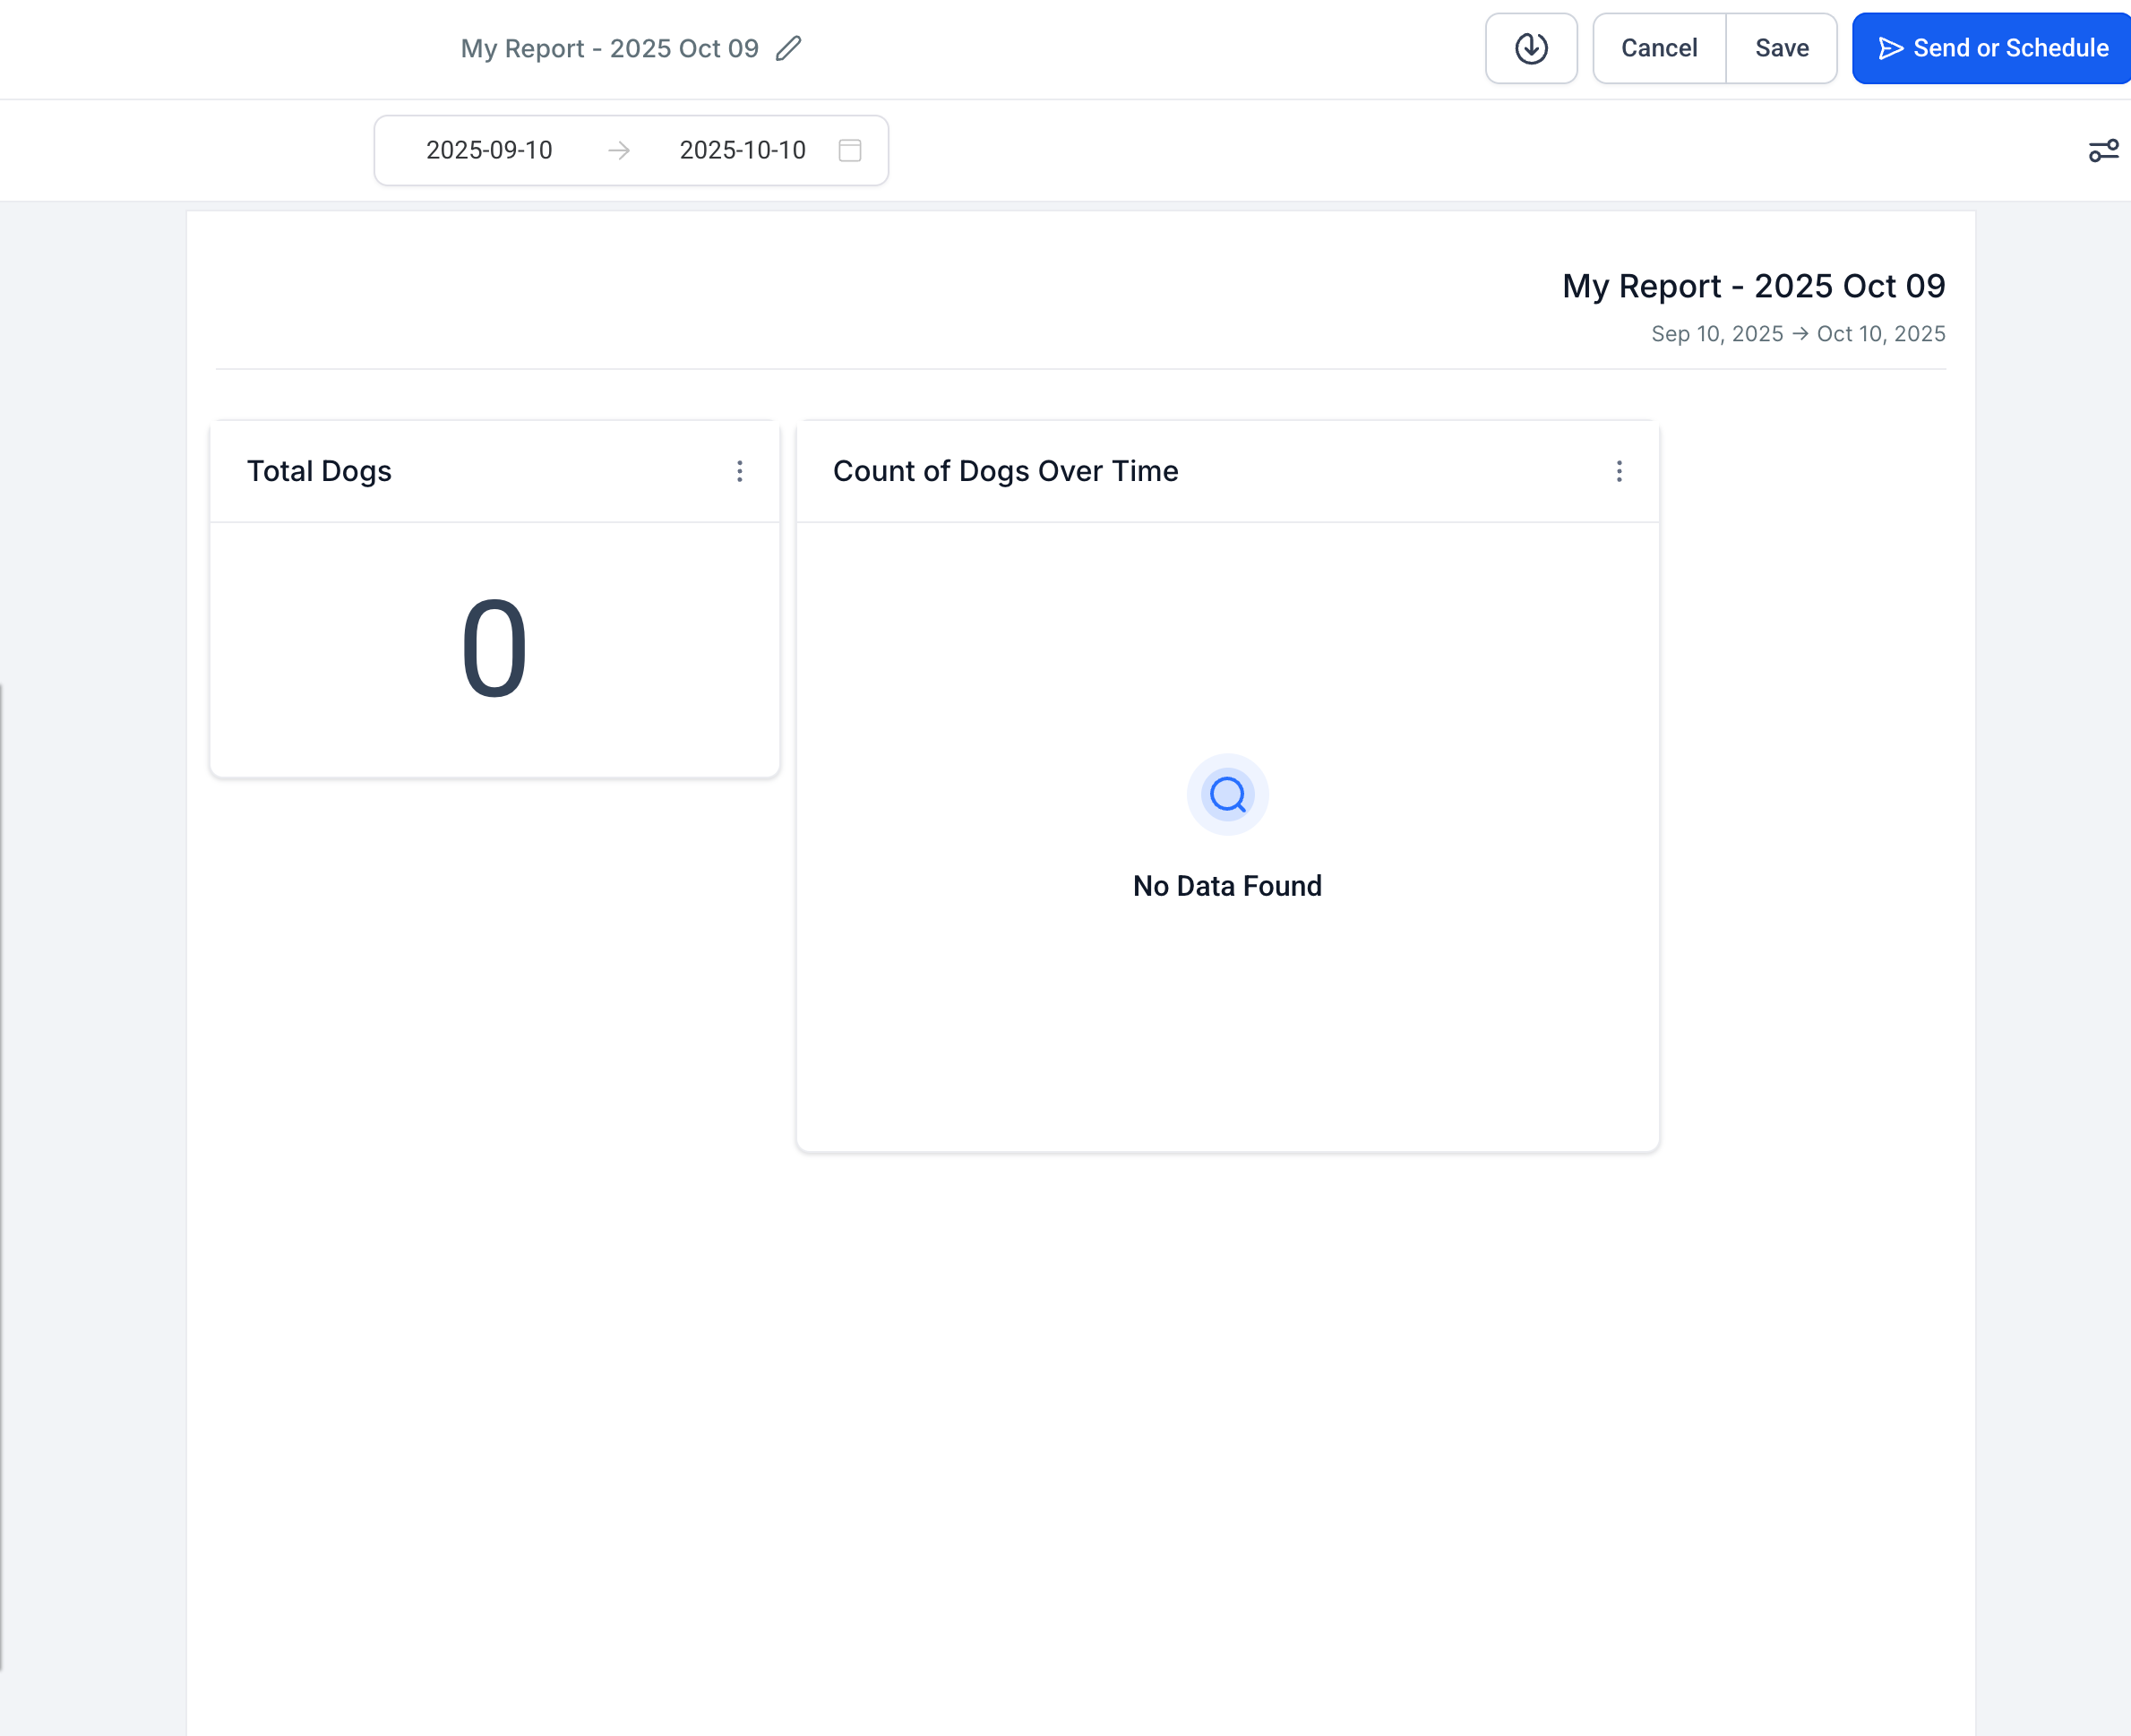
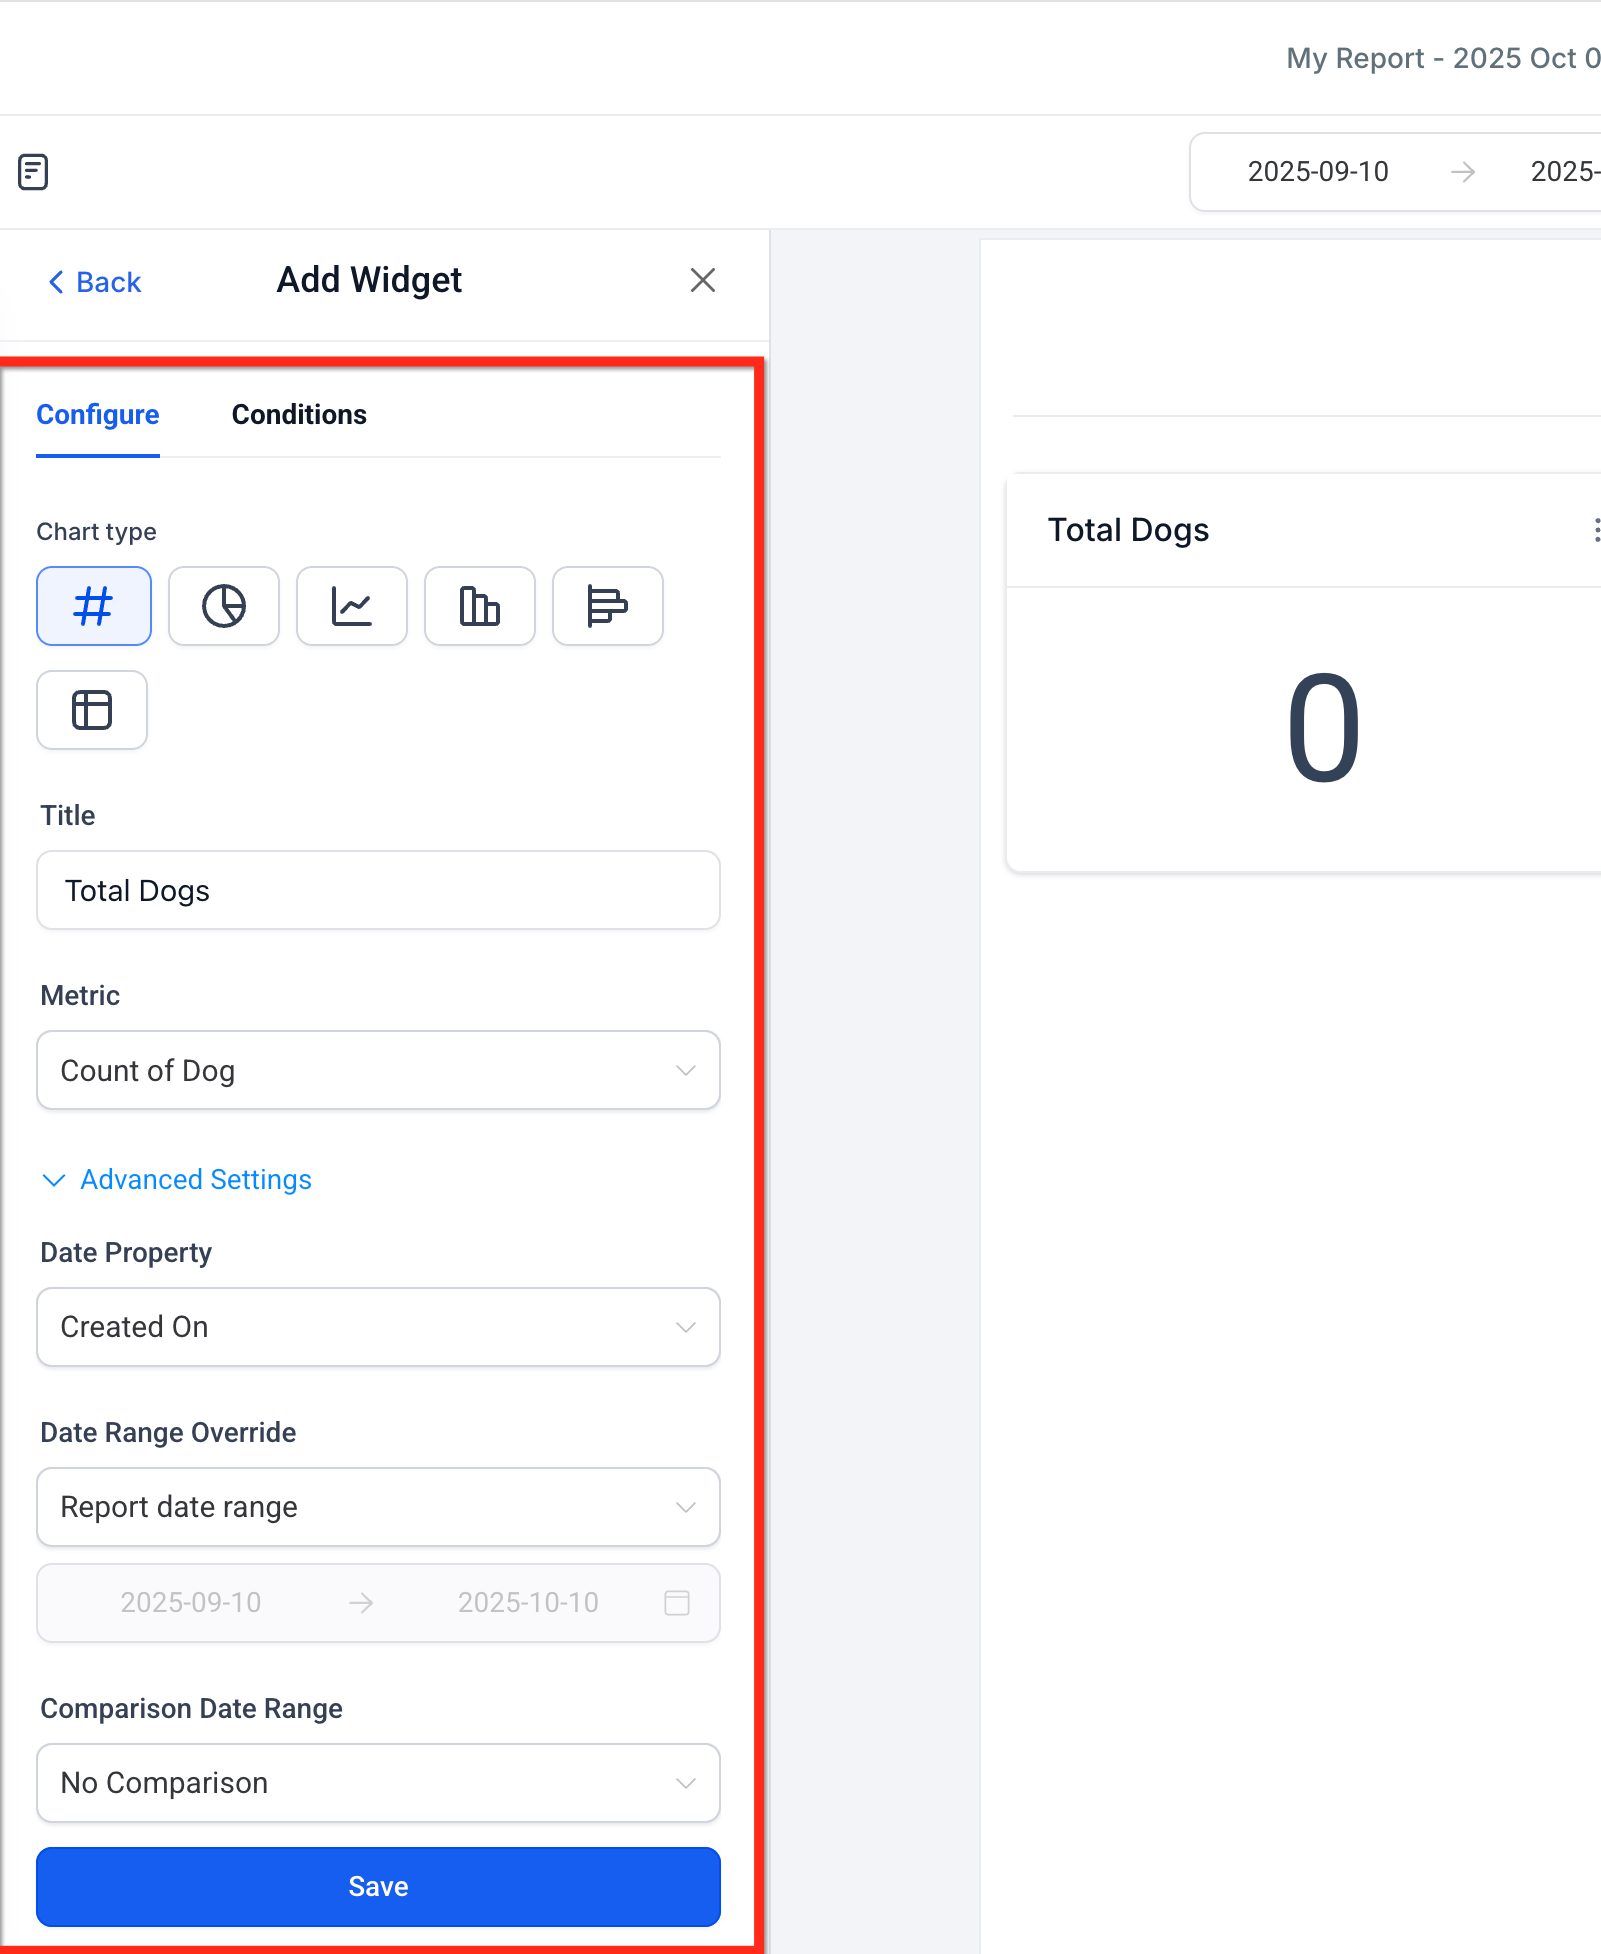
Configure each widget's chart type, filters, and theme, then click Save.
Click Send or Schedule to set up automatic email delivery of the report.
Do SMS widgets cover both outbound and inbound messages? Yes. Incoming SMS count is specifically for inbound messages. SMS by status, SMS by source type, SMS by sender, and SMS volume over time cover outbound. Use the Direction condition to filter any widget to Inbound or Outbound.
Why is Workflow greyed out in the SMS widget's Group dropdown? Workflow, Campaign, and Bulk action in the Group dropdown only activate when a matching Source filter is set in the Conditions tab first. Once you set Source = Workflow (or Campaign) across all condition branches, return to the Configure tab and that Group option becomes active.
Can I combine SMS, Email, and Call widgets on the same dashboard? Yes. All messaging categories can be placed on the same dashboard for a unified communication health view.
Why is my SMS widget showing no data? Common causes are a date range with no SMS activity, filters that are too narrow, or SMS simply not having been used yet in your account. Try removing conditions or widening the date range.
What does the Recurring Revenue Trend widget include? It visualizes revenue from subscriptions created on the Subscriptions tab, such as membership plans or recurring package payments. It does not include recurring invoices.
Why would I see failed payments in my dashboard? The Payment Failed Trend widget flags declined or failed payment attempts, which is a good place to spot expired cards or checkout issues before they affect a patient's next scheduled charge.
How many Custom Objects can I create? Up to ten Custom Objects per account, and each one can be used in dashboard widgets.
Can I duplicate a Custom Object widget? Yes. Use the three-dot menu on the widget and select Duplicate to copy its configuration and adjust it as needed.
Why does my Custom Object widget show "No data"? Check that your Custom Object has records, that you selected an eligible metric or field, that any date range you're using includes your data, and that filters or Quick Filters aren't excluding everything.
Can I schedule any of these widgets to email to my team automatically? Yes. Add revenue, SMS, or Custom Object widgets to a Custom Report, then use Send or Schedule to deliver it by email on a daily, weekly, or monthly cadence.
