Aesthetix CRM's Dashboard includes a set of pipeline widgets that turn your Opportunities pipeline into visual, trackable numbers: how many leads came in, how many booked a consult, how many closed into a paying patient, and how much revenue that represents. This guide covers each widget, how to read its data, and the pipeline settings that control what shows up.
You'll find these widgets under Dashboard, either on the default dashboard or a custom dashboard you build with the widget library. Most are grouped under Pipeline or General widgets depending on the type.
The Opportunities widget shows a running count of leads that entered a given pipeline, filtered by a Date Range based on the opportunity's Date Created.
For example, if you're tracking a Consultation Requests pipeline, the widget might show 5 leads opted in between two dates, all sitting in an OPEN status. If you want to see how many opted in on one specific day, double-click that date on the chart to drill in.
Pipeline Value totals the dollar value assigned to opportunities in a pipeline, usually representing the treatment or service value tied to each lead. Use it alongside Opportunities to see not just how many leads you have, but what they're worth if every one of them converts.
Conversion Rate is calculated as:
Number of opportunities in WON status ÷ total number of opportunities in the pipeline
For example, if 1 out of 5 leads that opted into your Consultation Requests pipeline reaches WON, your conversion rate is 20%. The WON stage is added automatically to every pipeline. You don't need to create it yourself, and every opportunity that closes successfully lands there.
The Funnel widget visualizes a step-by-step process, showing how leads move (and drop off) from one pipeline stage to the next. It's the widget to use when you want to see your consult-to-treatment journey as a classic sales funnel: New Lead, Consultation Booked, Consultation Completed, Treatment Plan Presented, Purchased.
Switch between different pipelines using the dropdown inside the widget.
Requirements:
You need Dashboard stats permission enabled on your user profile to view this widget.
The pipeline must have the Visible in Funnel Chart toggle turned on in Pipeline Settings, or it won't appear as an option.
The funnel uses each opportunity's last status change date, not its created date, to determine which stage it's counted in.
The funnel shows sequential, cumulative data: each section counts every opportunity from that stage onward, not just the opportunities currently sitting in that exact stage.
Say your pipeline has these stages and current counts:
Stage | Opportunities currently in stage |
|---|---|
New Lead | 229 |
Consultation Booked | 4 |
Consultation Completed | 32 |
Treatment Plan Presented | 7 |
Financing Discussed | 0 |
On the funnel chart, you'll see one section per stage plus a final WON section, since WON is the desired exit point for every opportunity. The formula for each section is:
Opportunities in a section = opportunities from the current stage through the last stage, including every WON opportunity in the pipeline
So the New Lead section shows the full total of opportunities anywhere in the pipeline, at any status (open, lost, won, or abandoned). The next section (Consultation Booked) drops the ones still sitting in New Lead and shows everyone from Consultation Booked onward, including WON. Every later section keeps rolling forward the same way, and WON opportunities are always included in every section's count because a WON lead is assumed to have passed through every stage on its way there.
Revenue per section is calculated the same cumulative way. The chart also distinguishes cumulative conversion (opportunities that made it through every stage in the funnel) from next-step conversion (the conversion rate specific to just that one stage).
A stage-order tip: think of your pipeline like a staircase, New Lead, then Consultation Booked, then Consultation Completed, then Purchased. If a lead is sitting in Consultation Completed, the funnel assumes they already passed through New Lead and Consultation Booked, so those earlier stages get credited with that lead too. Build your pipeline stages so each one really is one step closer to the sale (Lead, Consult Booked, Consult Completed, Treatment Purchased), and the funnel math will hold up.
Where the funnel breaks down: the funnel widget isn't the right tool for a branch stage like No Show. Because a WON opportunity is assumed to have passed through every stage, a No Show stage can look inflated on the funnel even when only one or two leads actually landed there. For tracking No Shows, use the Stage Distribution widget instead.
The Stage Distribution widget shows the number of OPEN opportunities currently sitting in each individual stage. WON and LOST opportunities are broken out separately rather than folded into the stage counts, so a stage like No Show doesn't get artificially inflated the way it can on the Funnel widget. Conversion rate here is calculated as the percentage of opportunities that converted into that specific stage.
Switch pipelines using the same dropdown pattern as the Funnel widget.
Requirements:
Dashboard stats permission must be enabled to view this widget.
The pipeline must have Visible in Pie Chart turned on in Pipeline Settings.
Tracking repeat visits to a stage (like No Show): by default, an opportunity only ever sits in one stage at a time, so if a patient no-shows and then reschedules, the No Show card moves rather than leaving a record behind. To keep a history of every time a lead touched a stage:
Turn on Allow Duplicate Opportunity on the pipeline.
If you're using a workflow with an Add/Update Opportunity action to move leads between stages automatically, make sure Allow duplicate opportunities is also toggled on inside that action.
With duplicates allowed, a lead that no-shows leaves an opportunity card in the No Show stage even after they book and complete a new consult, giving you an accurate count of total no-shows over time on the Stage Distribution widget.
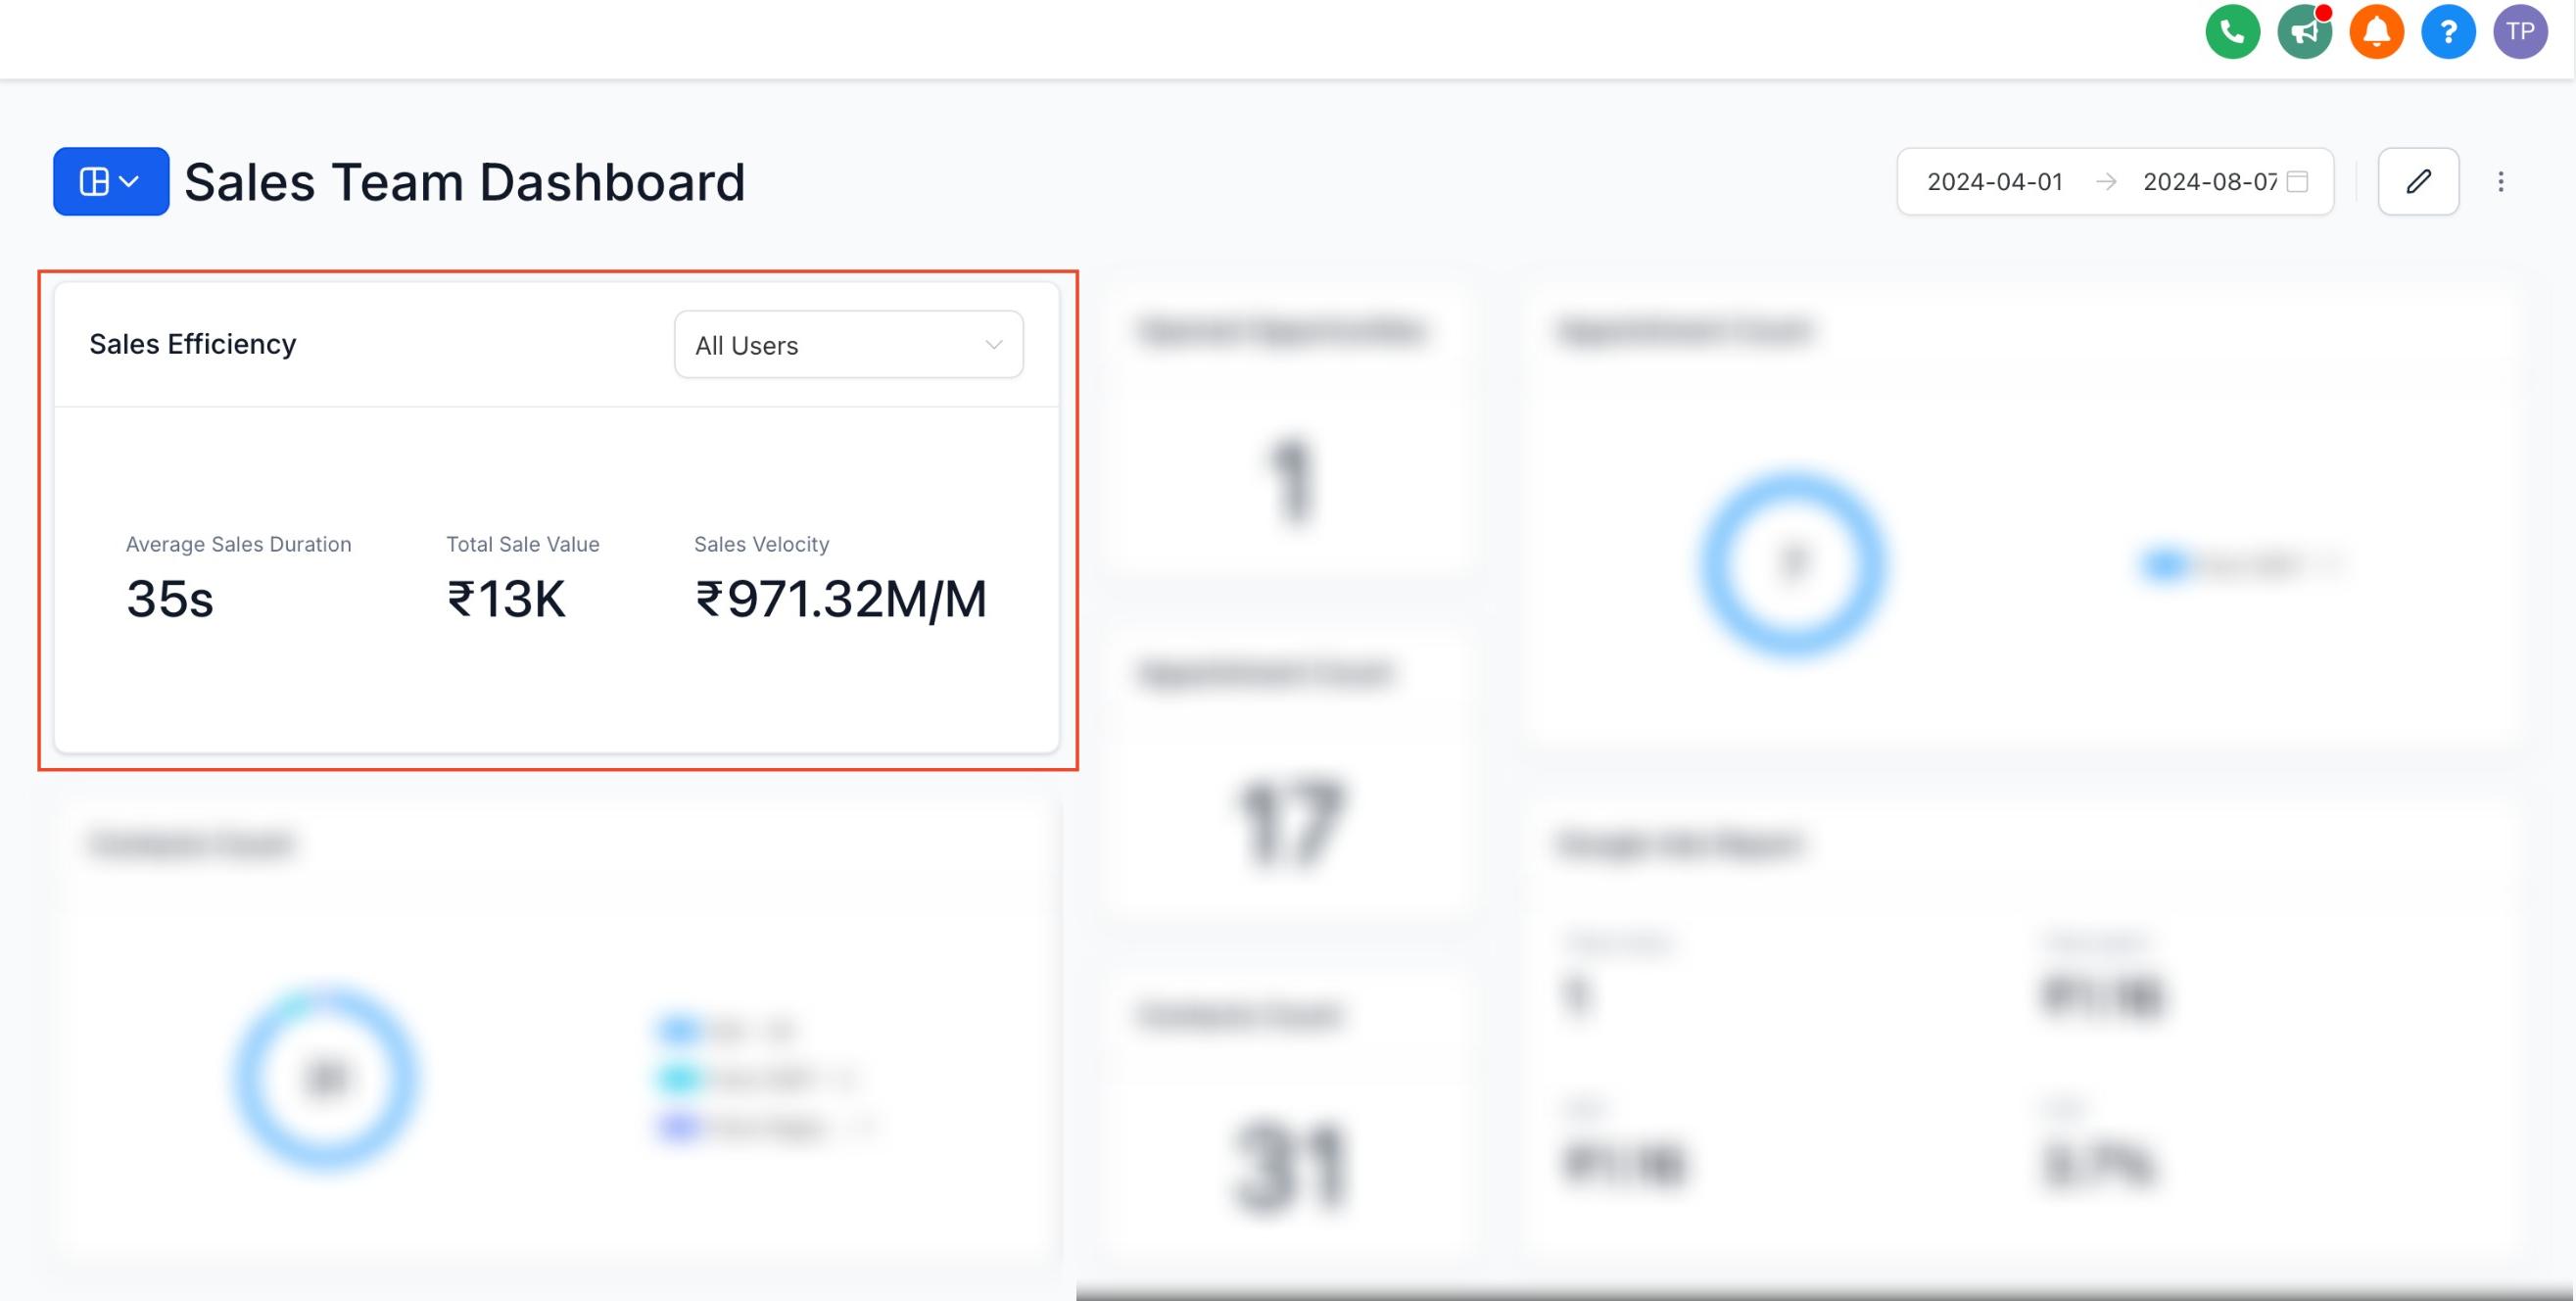
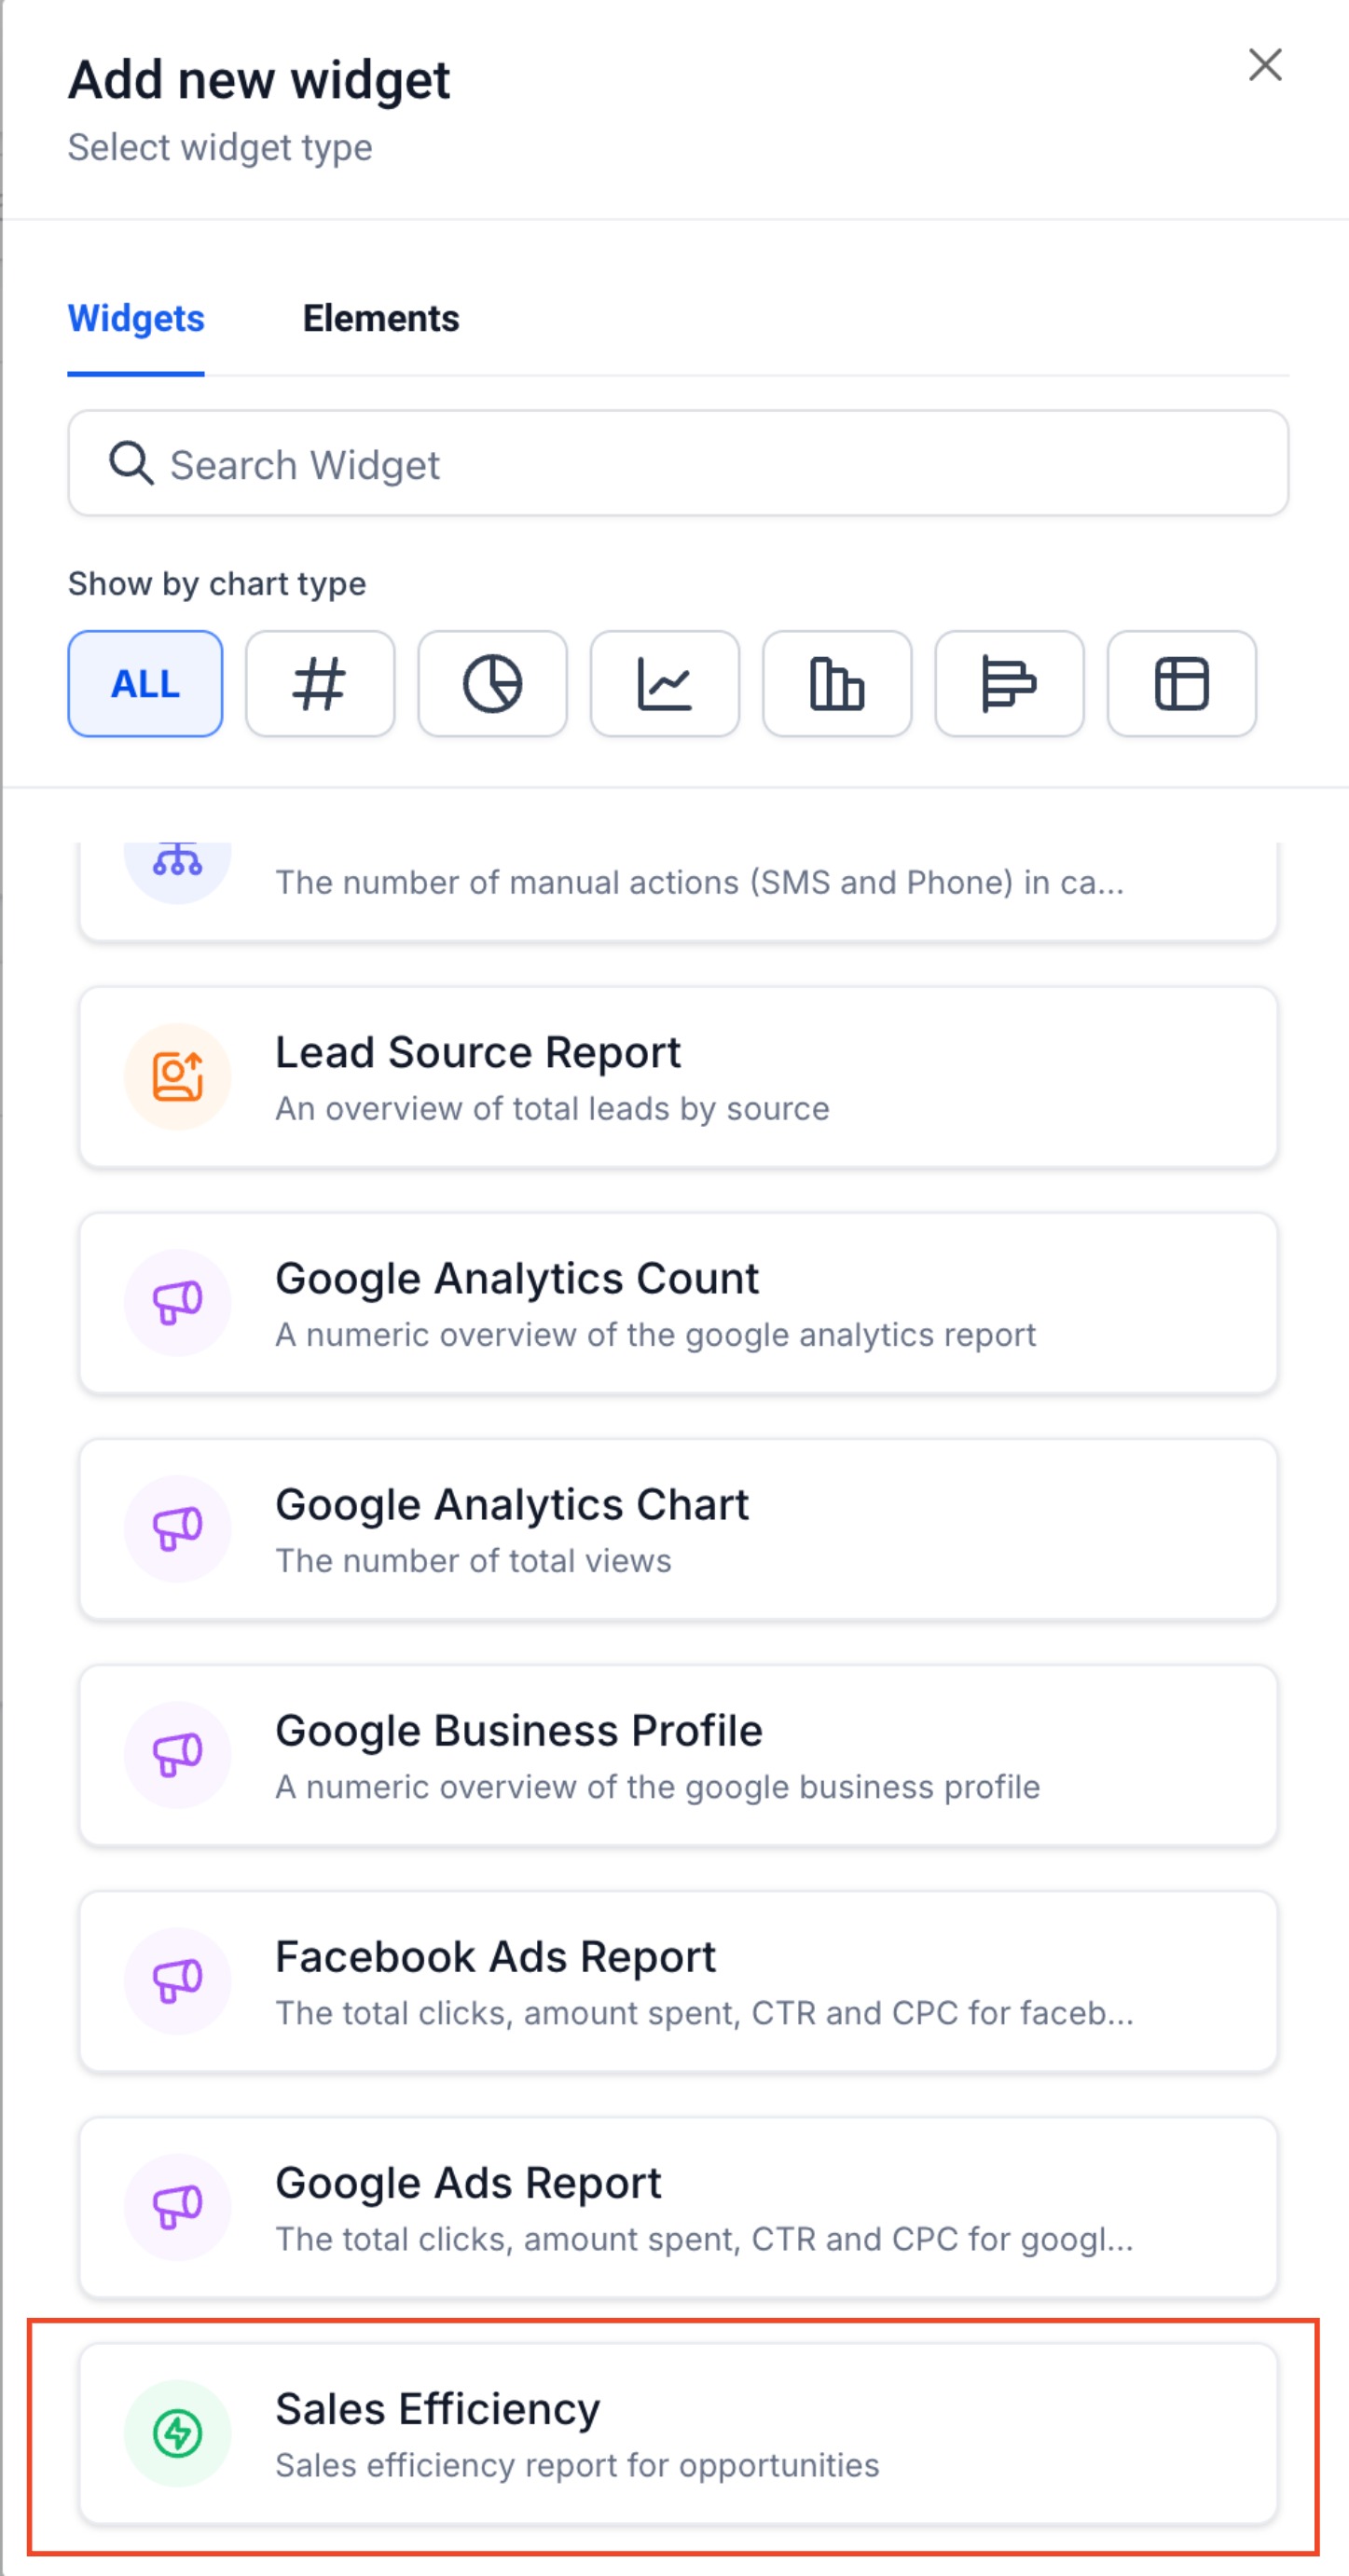
Sales Efficiency is a general widget (not tied to the Funnel/Pie Chart visibility toggles) that surfaces three performance metrics for your team:
Average Sales Duration: the average time it takes for opportunities to close, useful for spotting where consults are stalling before a patient commits to treatment.
Total Sales Value: the total dollar value of your closed sales.
Sales Velocity: how quickly opportunities are moving through your pipeline overall.
All three metrics are filterable by user, so you can see which front-desk or sales team member is booking and closing consults fastest, not just your practice's aggregate numbers.
By default, Sales Efficiency aggregates metrics across every pipeline. To focus on just one, for example your Consultation Requests pipeline versus a separate Retail/Product pipeline:
Go to your Dashboard.
Locate the Sales Efficiency widget.
Click the Pipeline dropdown inside the widget.
Select the pipeline you want to view.
Opportunity and lead records behind these widgets often include patient names and contact details. Limit Dashboard stats permission to the staff who need pipeline visibility, and treat exported or screenshotted dashboard views the same way you'd treat any other document containing patient information.
Which widget should I use to see how many leads booked a consult this month? Use the Opportunities widget with the Date Range filter set to this month, or the Funnel widget if you want to see the drop-off from lead to booked consult to completed consult.
Why doesn't my pipeline show up in the Funnel widget dropdown? The pipeline needs the Visible in Funnel Chart toggle turned on in Pipeline Settings. The Stage Distribution widget has its own separate toggle, Visible in Pie Chart.
Why does my No Show stage look bigger on the Funnel widget than I expect? The Funnel widget counts cumulatively, and WON opportunities are counted as having passed through every stage, which can visually inflate a branch stage like No Show. Use the Stage Distribution widget for an accurate count of opportunities sitting in that specific stage.
How is Conversion Rate calculated? It's the number of opportunities in WON status divided by the total number of opportunities in the pipeline.
Do I need to create a WON stage myself? No. WON is added automatically to every pipeline and always appears at the end of the Funnel widget.
Can I track every time a patient no-shows, even if they later rebook? Yes. Turn on Allow Duplicate Opportunity on the pipeline, and make sure any workflow action that updates the opportunity stage also has Allow duplicate opportunities enabled. That way a No Show card stays in place instead of being overwritten when the lead reschedules.
What does the Sales Efficiency widget measure that the other pipeline widgets don't? It adds time-based and per-user performance metrics: Average Sales Duration, Total Sales Value, and Sales Velocity, filterable by team member and by pipeline.
Why can't I see any of these widgets on my dashboard? You need Dashboard stats permission enabled on your user profile. Ask an admin on your account to grant it if it's missing.
Where do I set up the pipeline stages these widgets are built on? Pipelines and their stages are configured outside of the Dashboard; see the pipeline setup documentation for creating and ordering stages. Automating stage moves (like moving a lead to Consultation Completed after a calendar event) is handled through Workflows.
Is there a widget for ad-spend or reputation performance instead of pipeline stages? Yes, but they live elsewhere: ad-network performance is covered in Ads Manager's Ad Reporting, and reputation metrics are covered in Review Management's reporting. Full multi-channel attribution reporting lives in the Essential Guides collection.
