Table charts turn your Dashboard into a spreadsheet-style view of your practice data, listing contacts, opportunities, or other records in rows and columns instead of a graph. They're useful whenever you want to scan individual records at a glance, for example a table of leads by source with a status column for each one, rather than just a summary total.
Interactive walkthrough
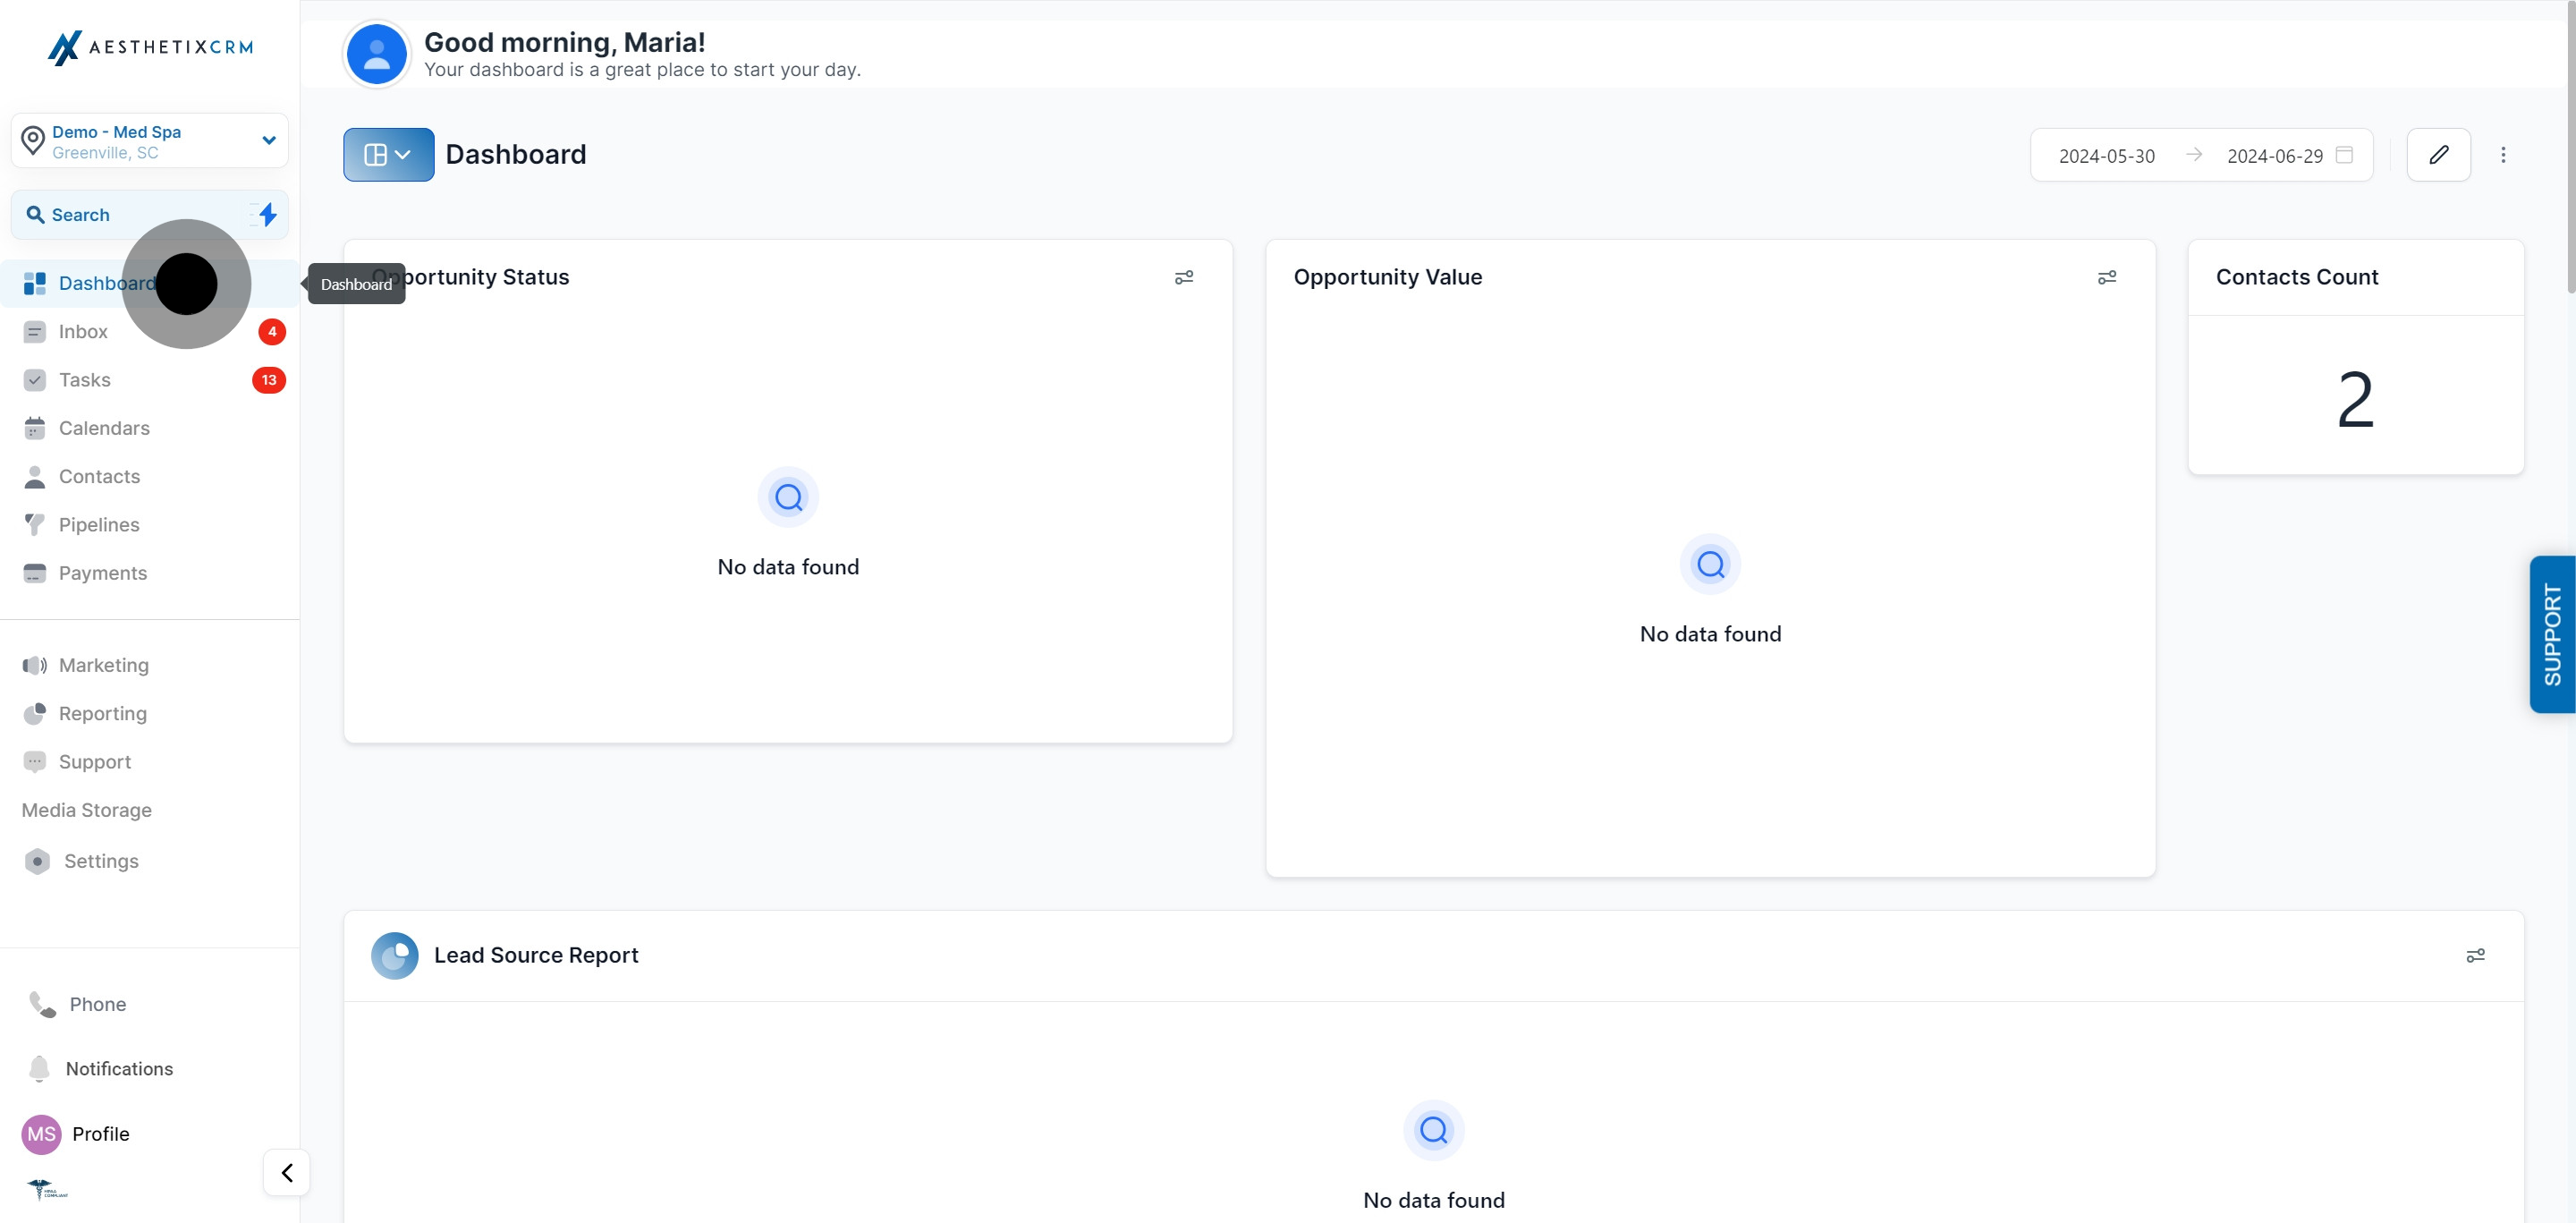
Click Dashboard from the left menu.
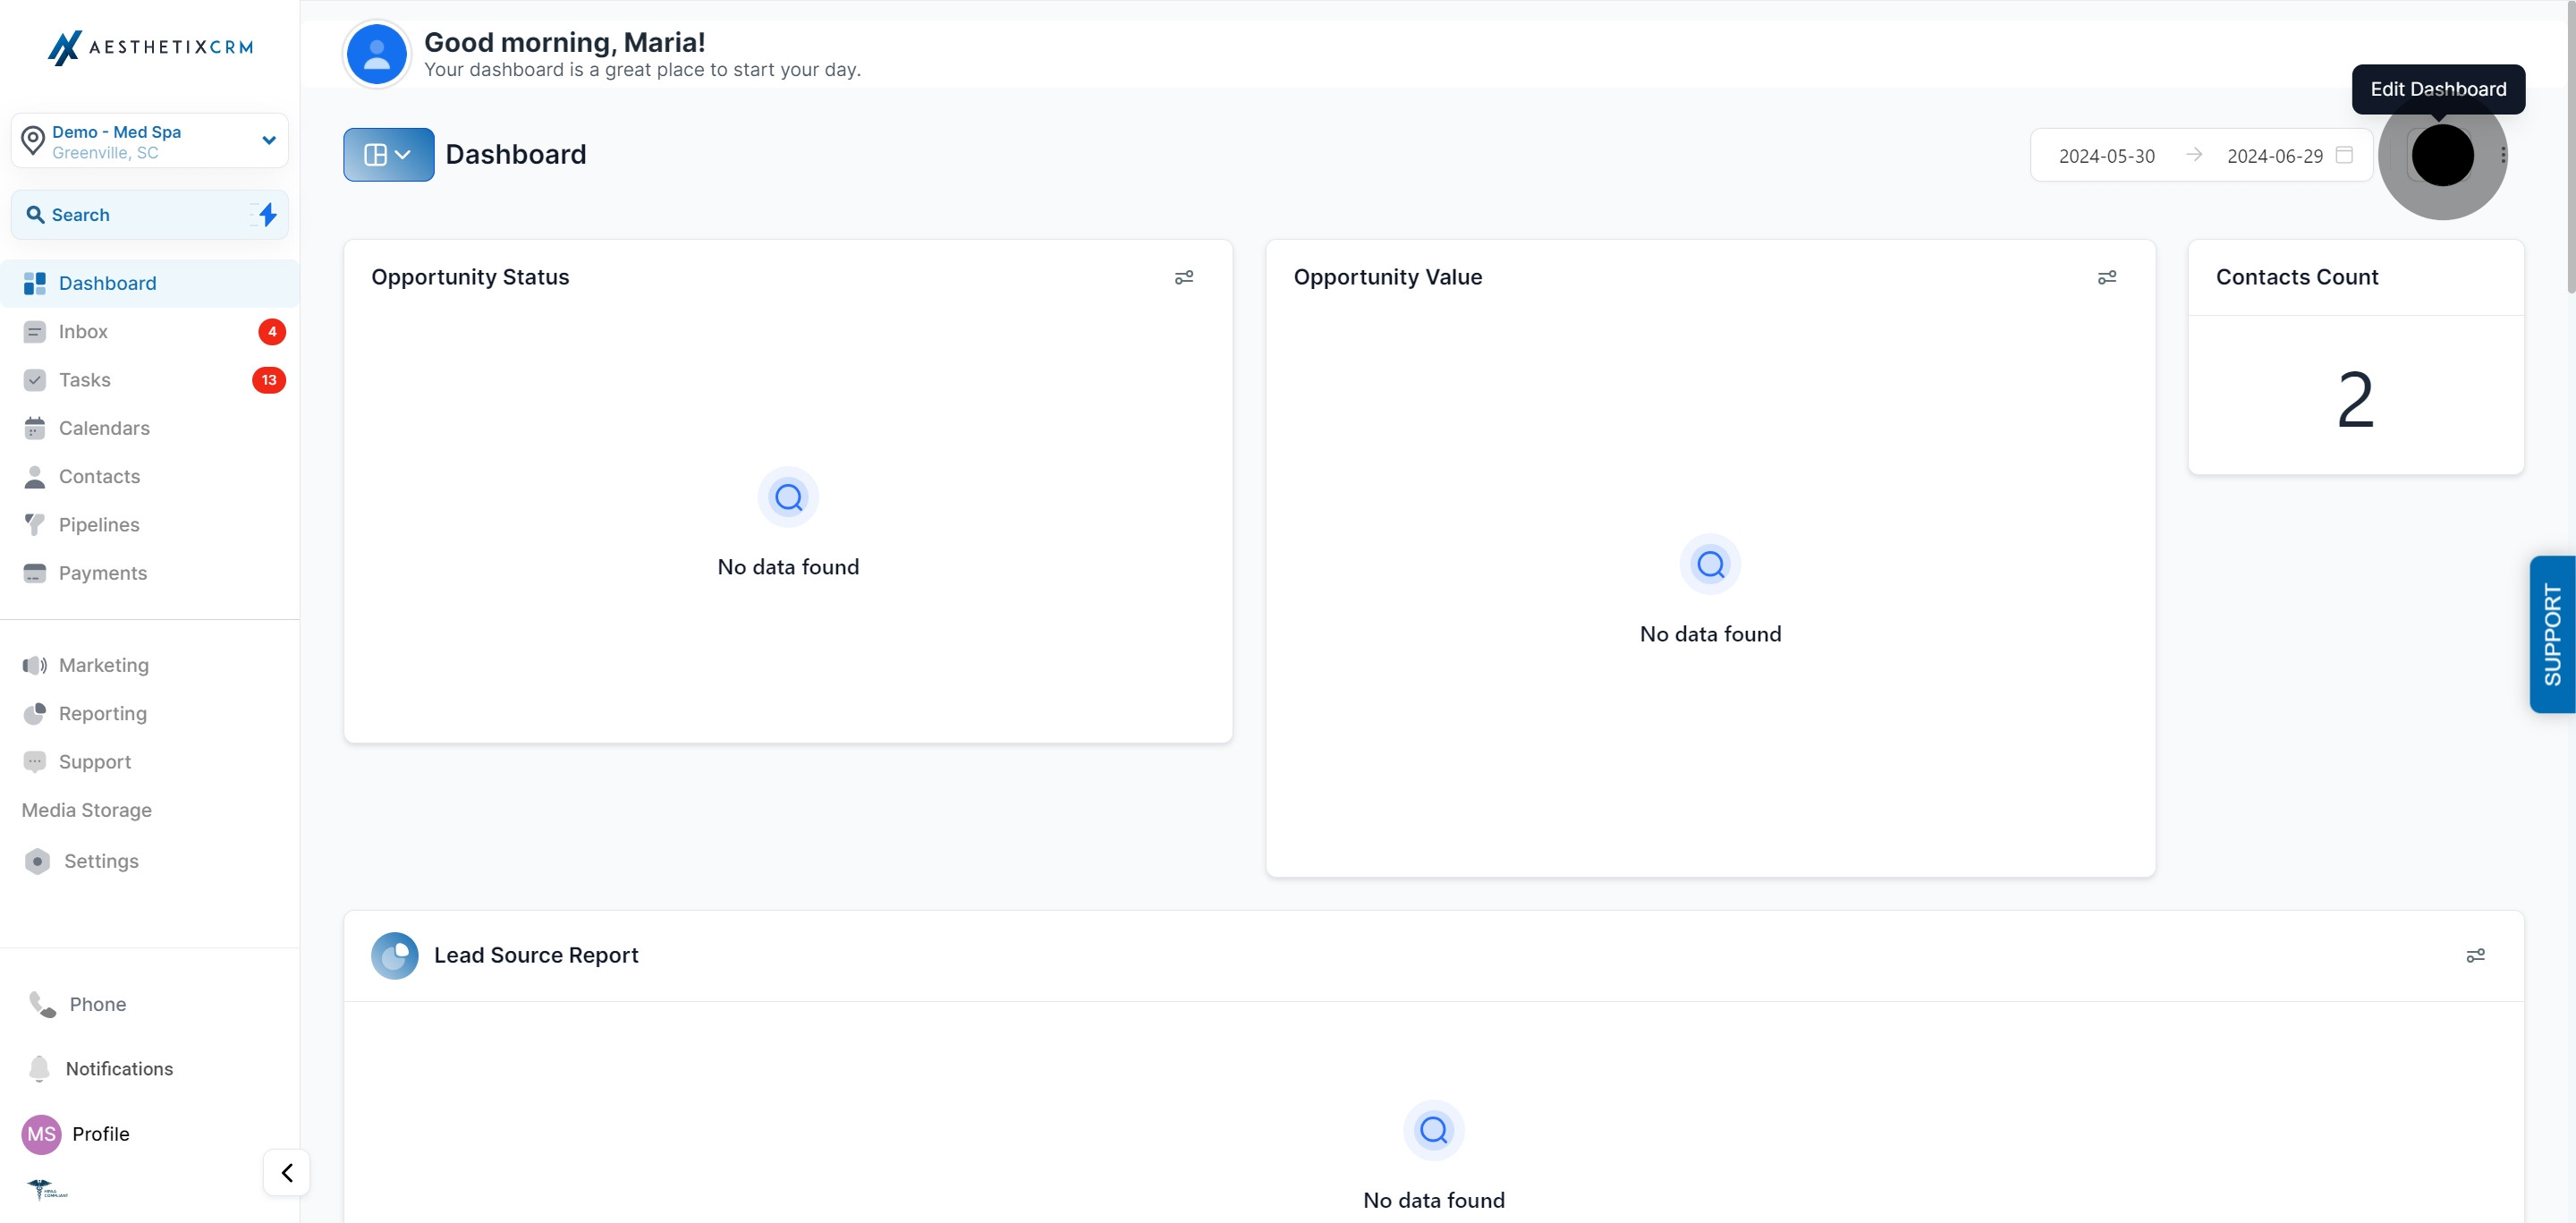
Click Edit Dashboard.
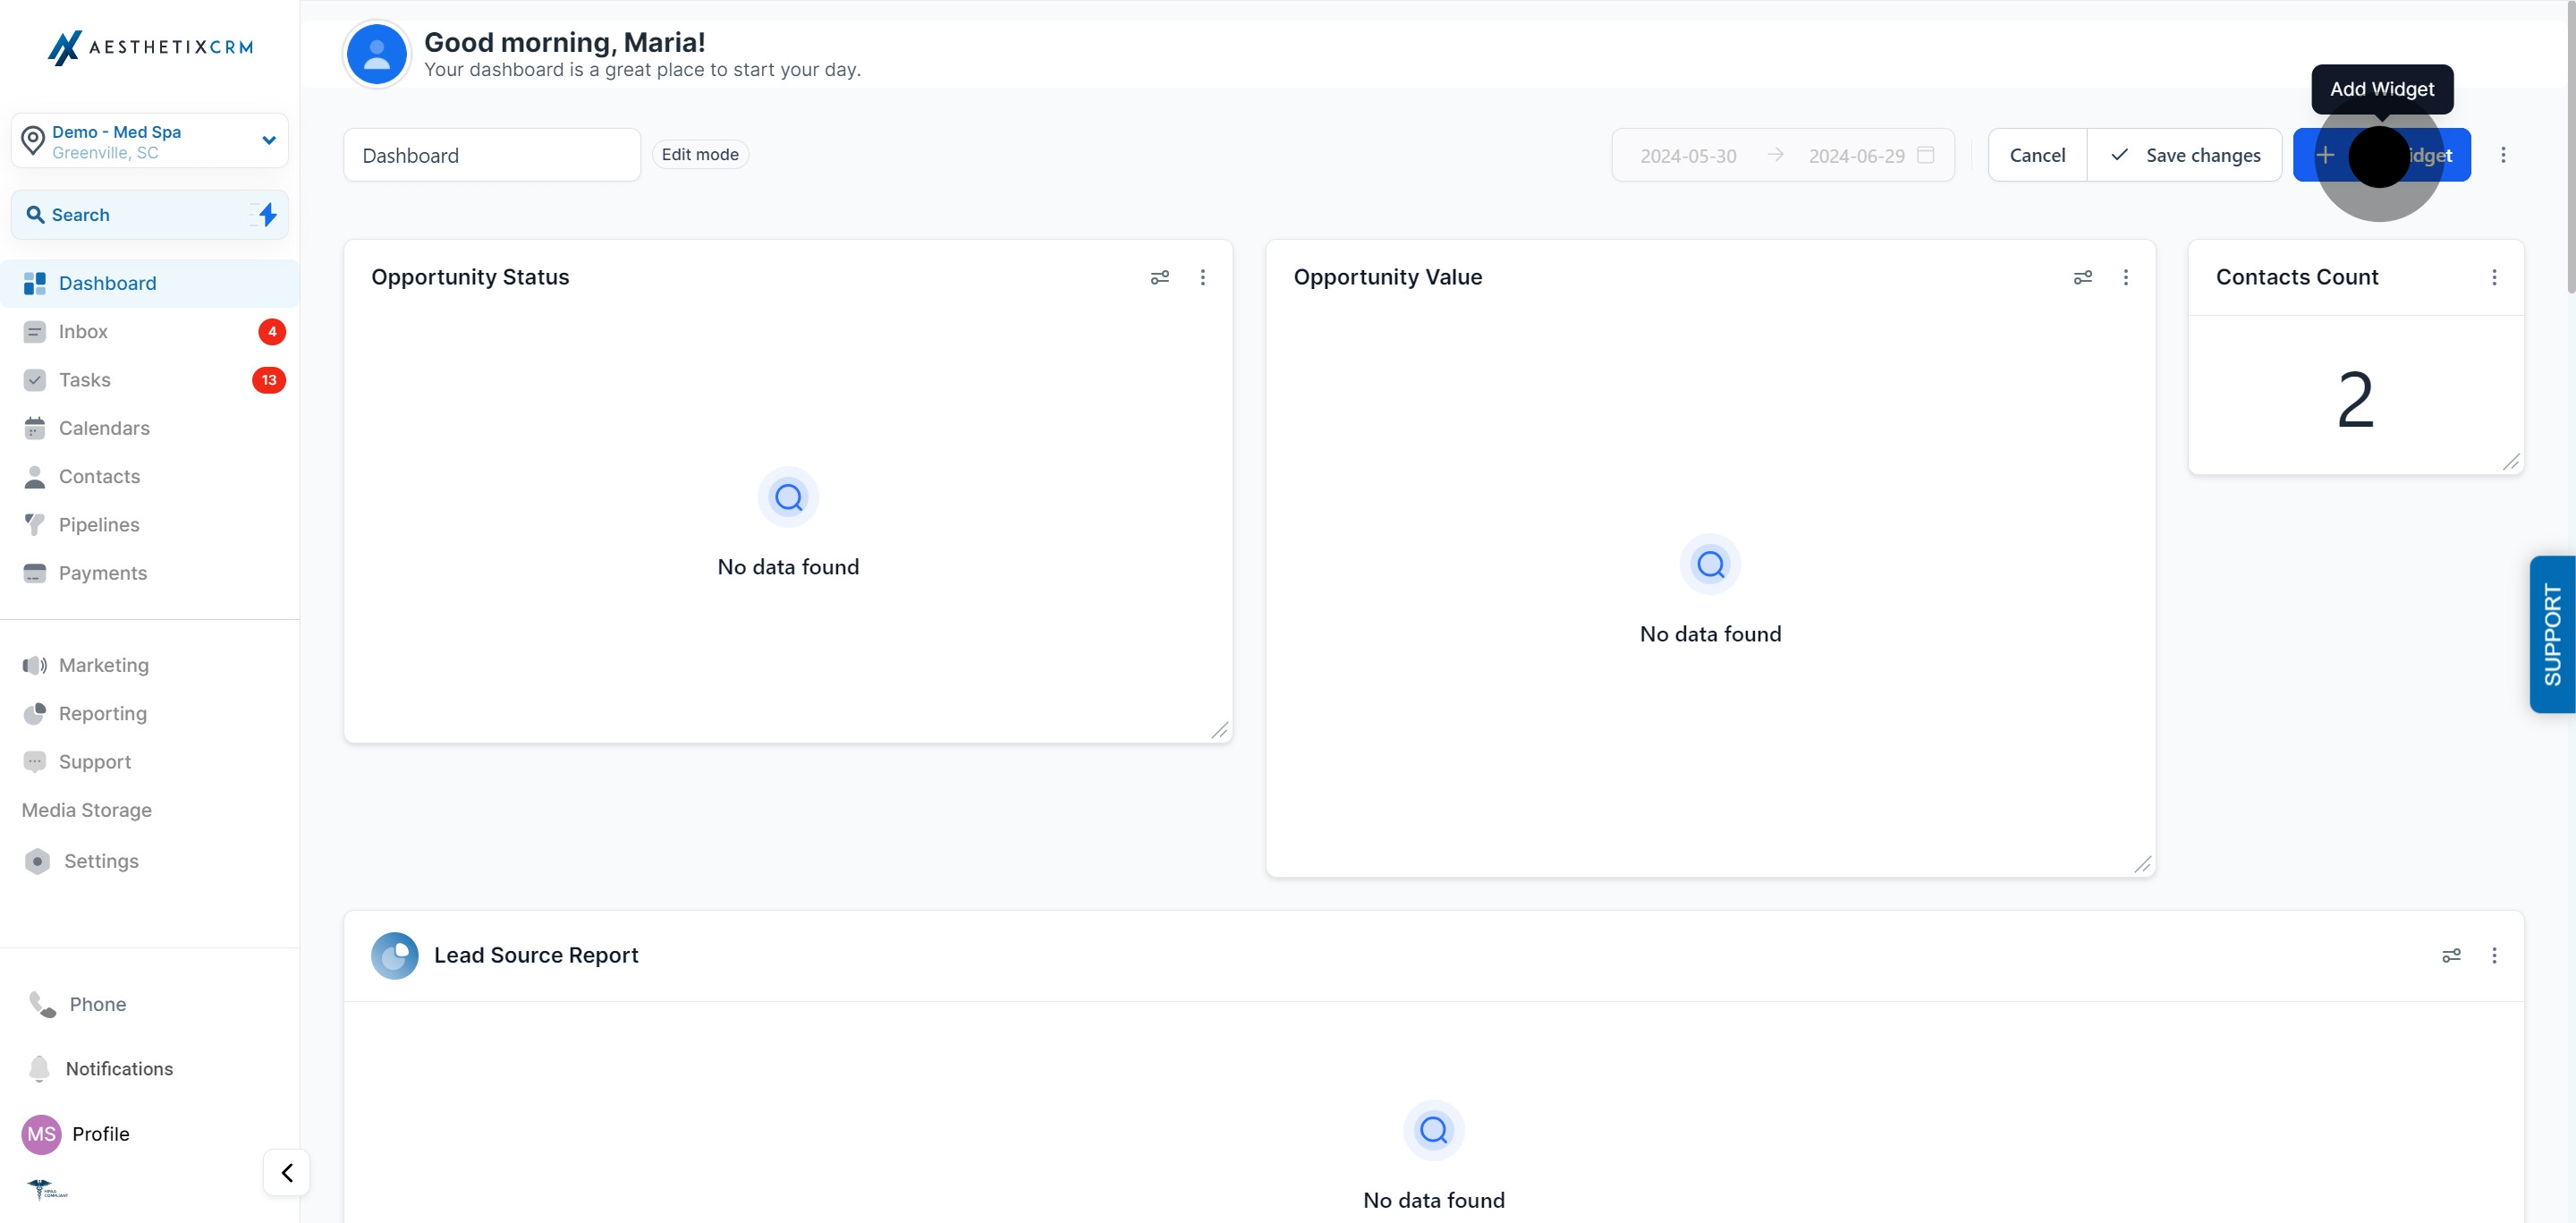
Click Add Widget.
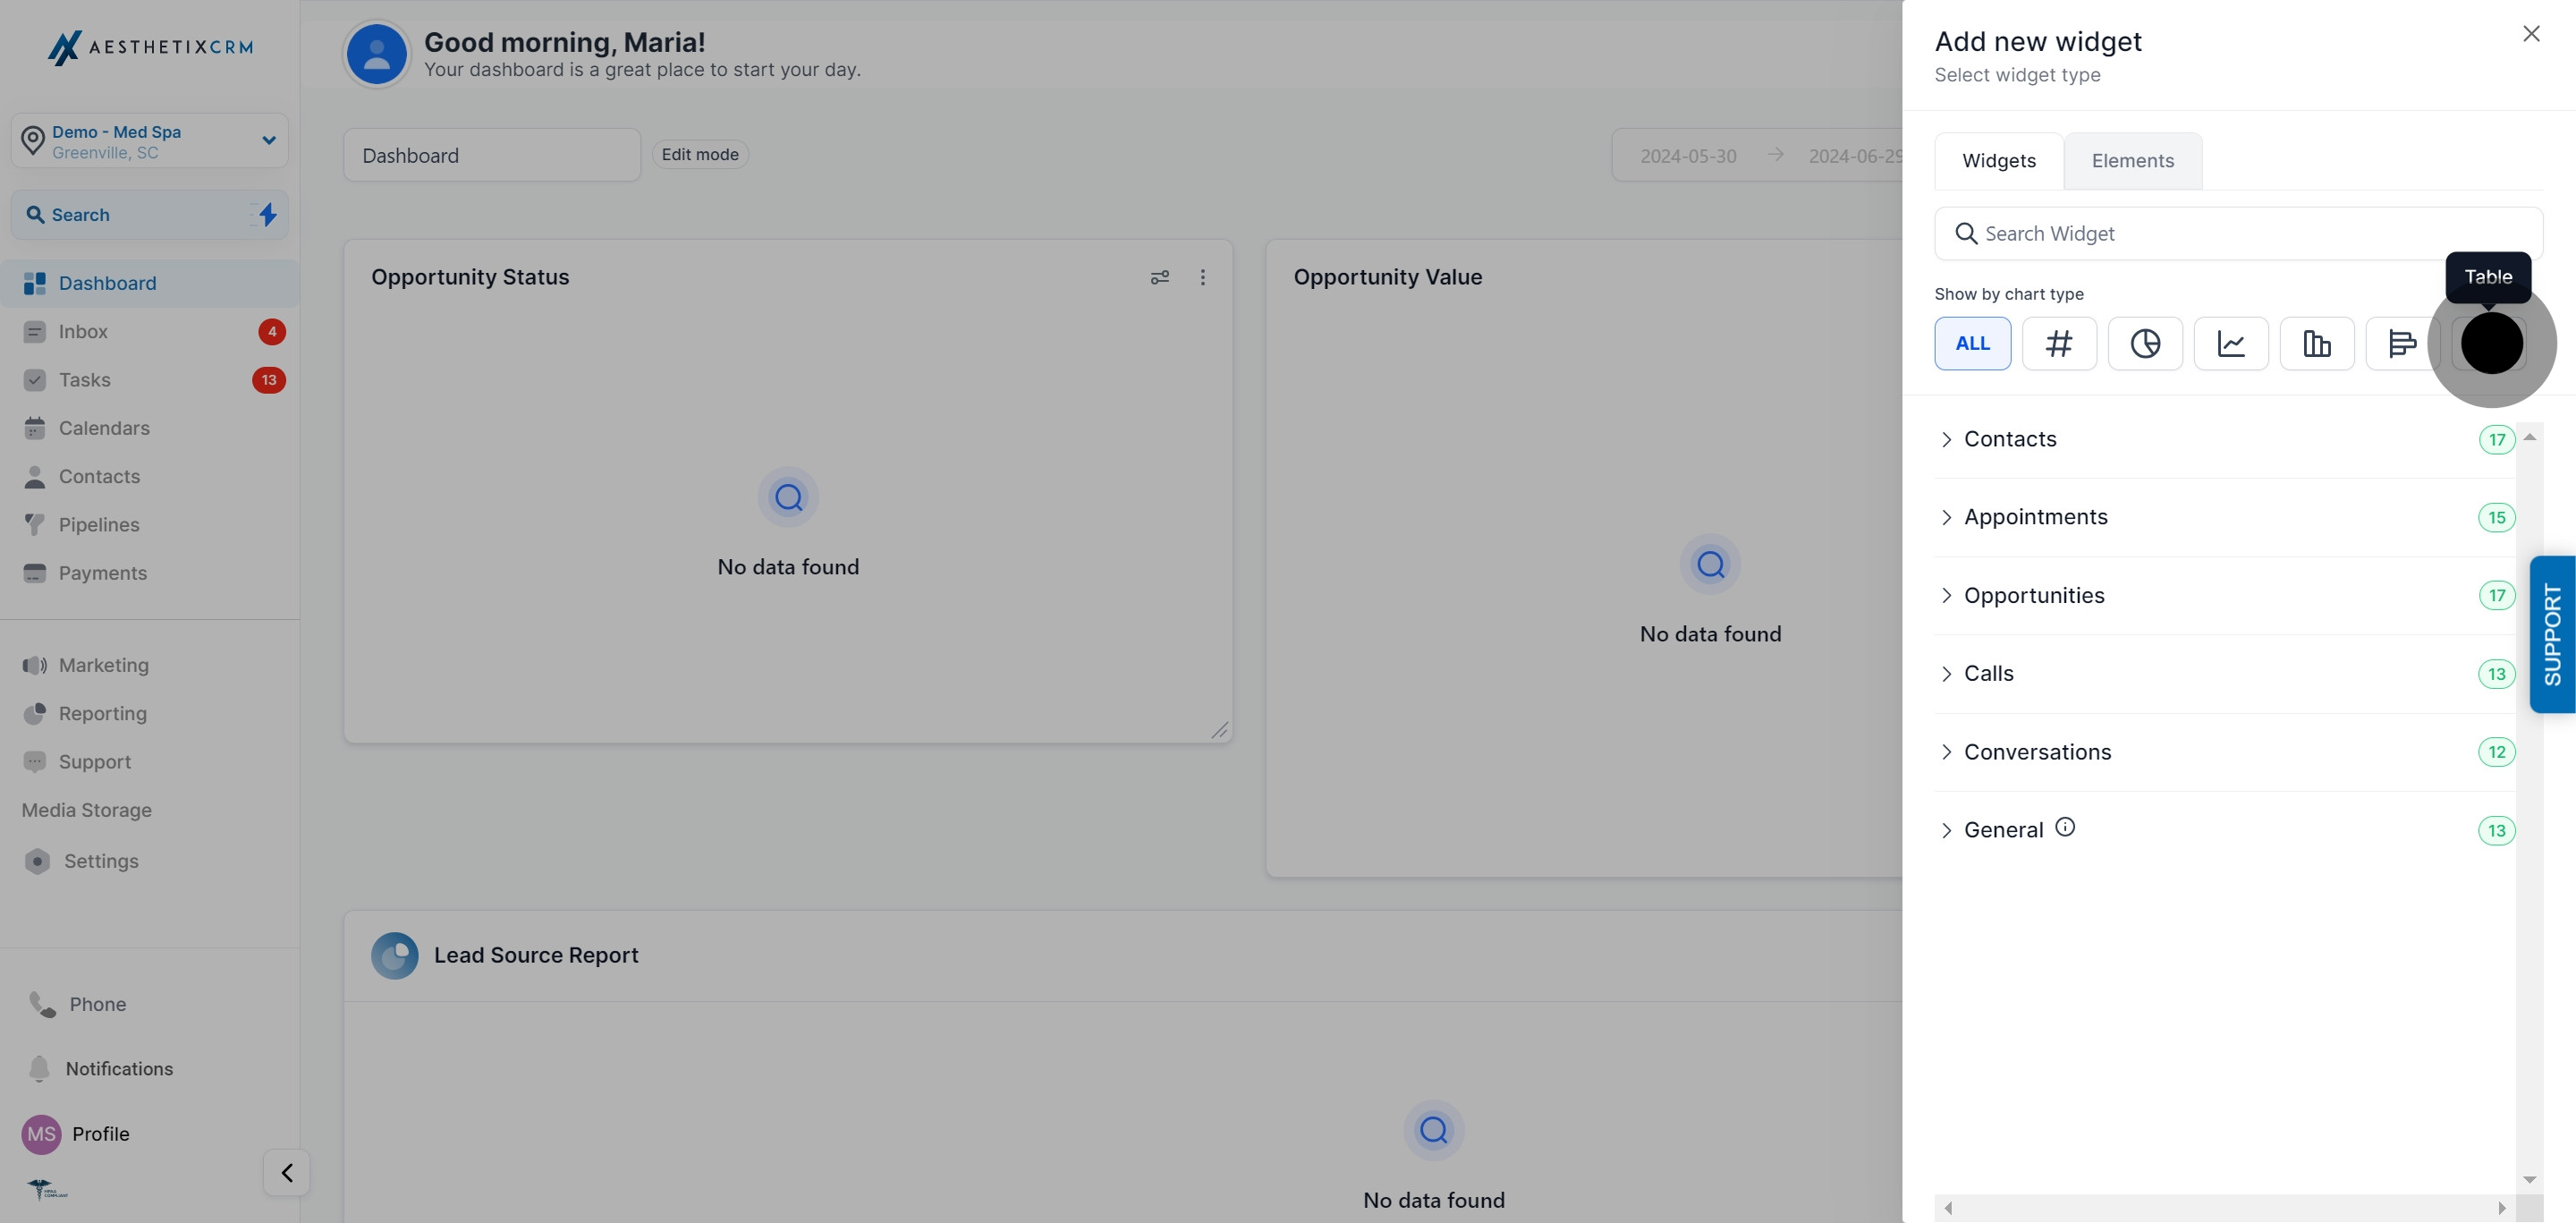
Scroll to the widget you want to add and change its chart type to Table.
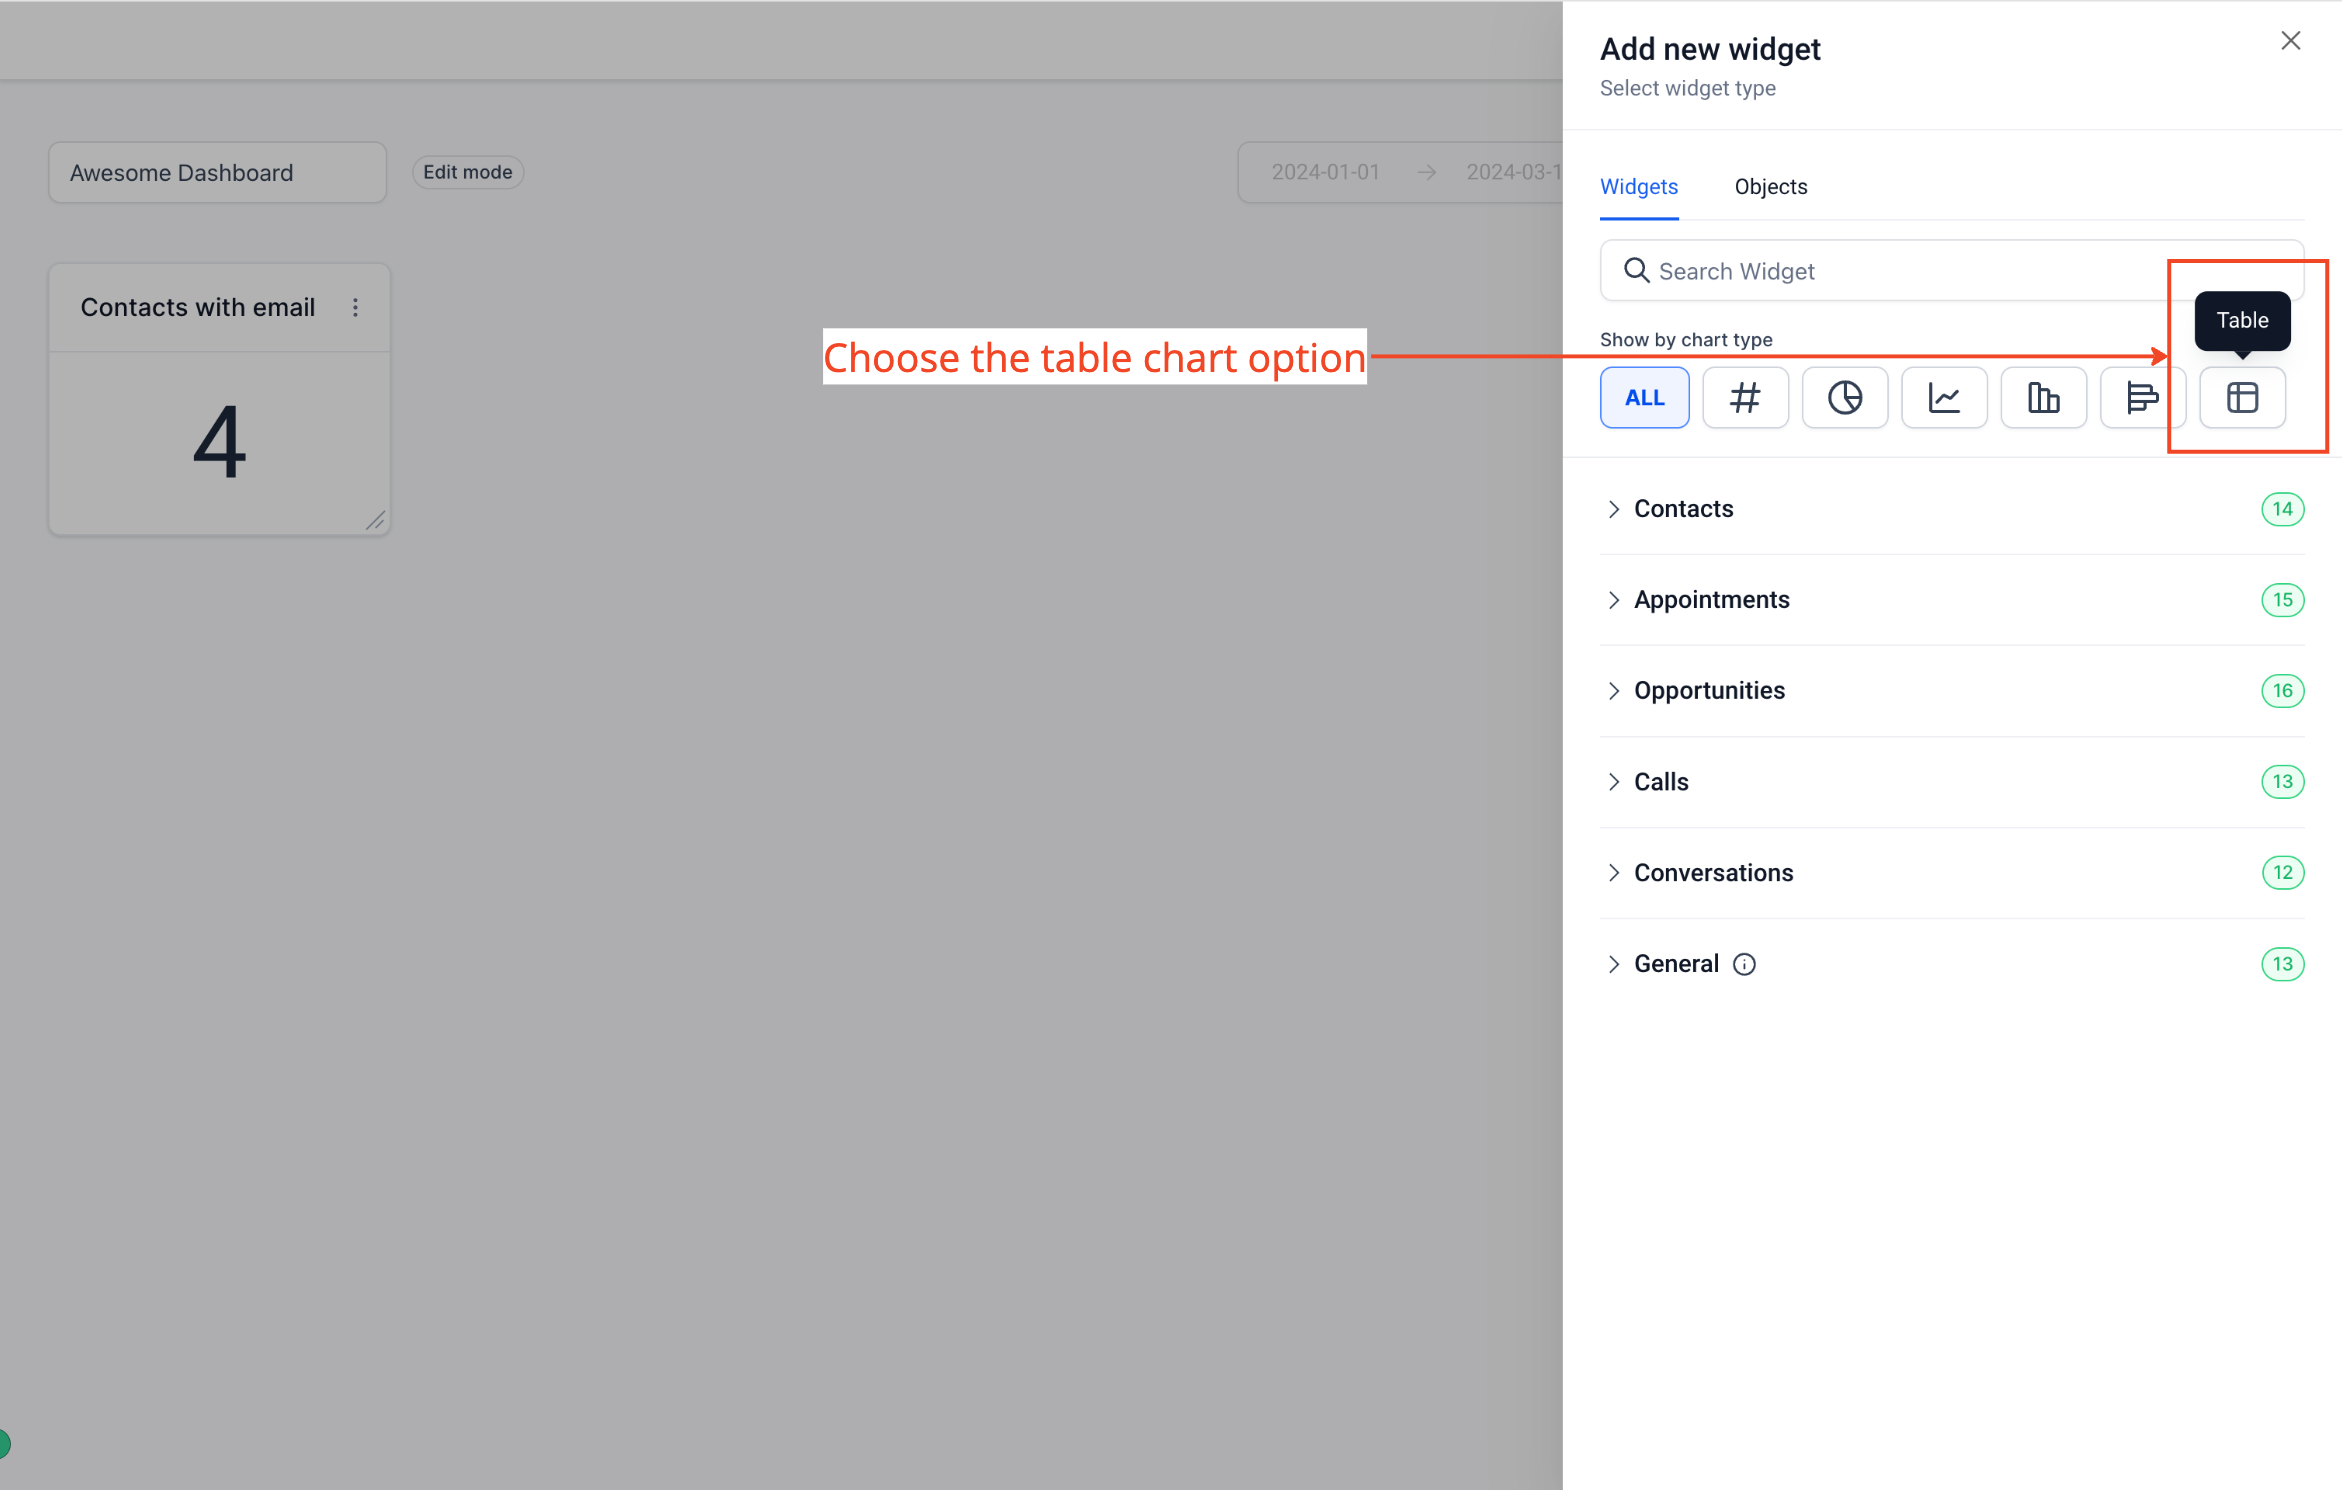
Open Advanced Settings on the widget to configure it.
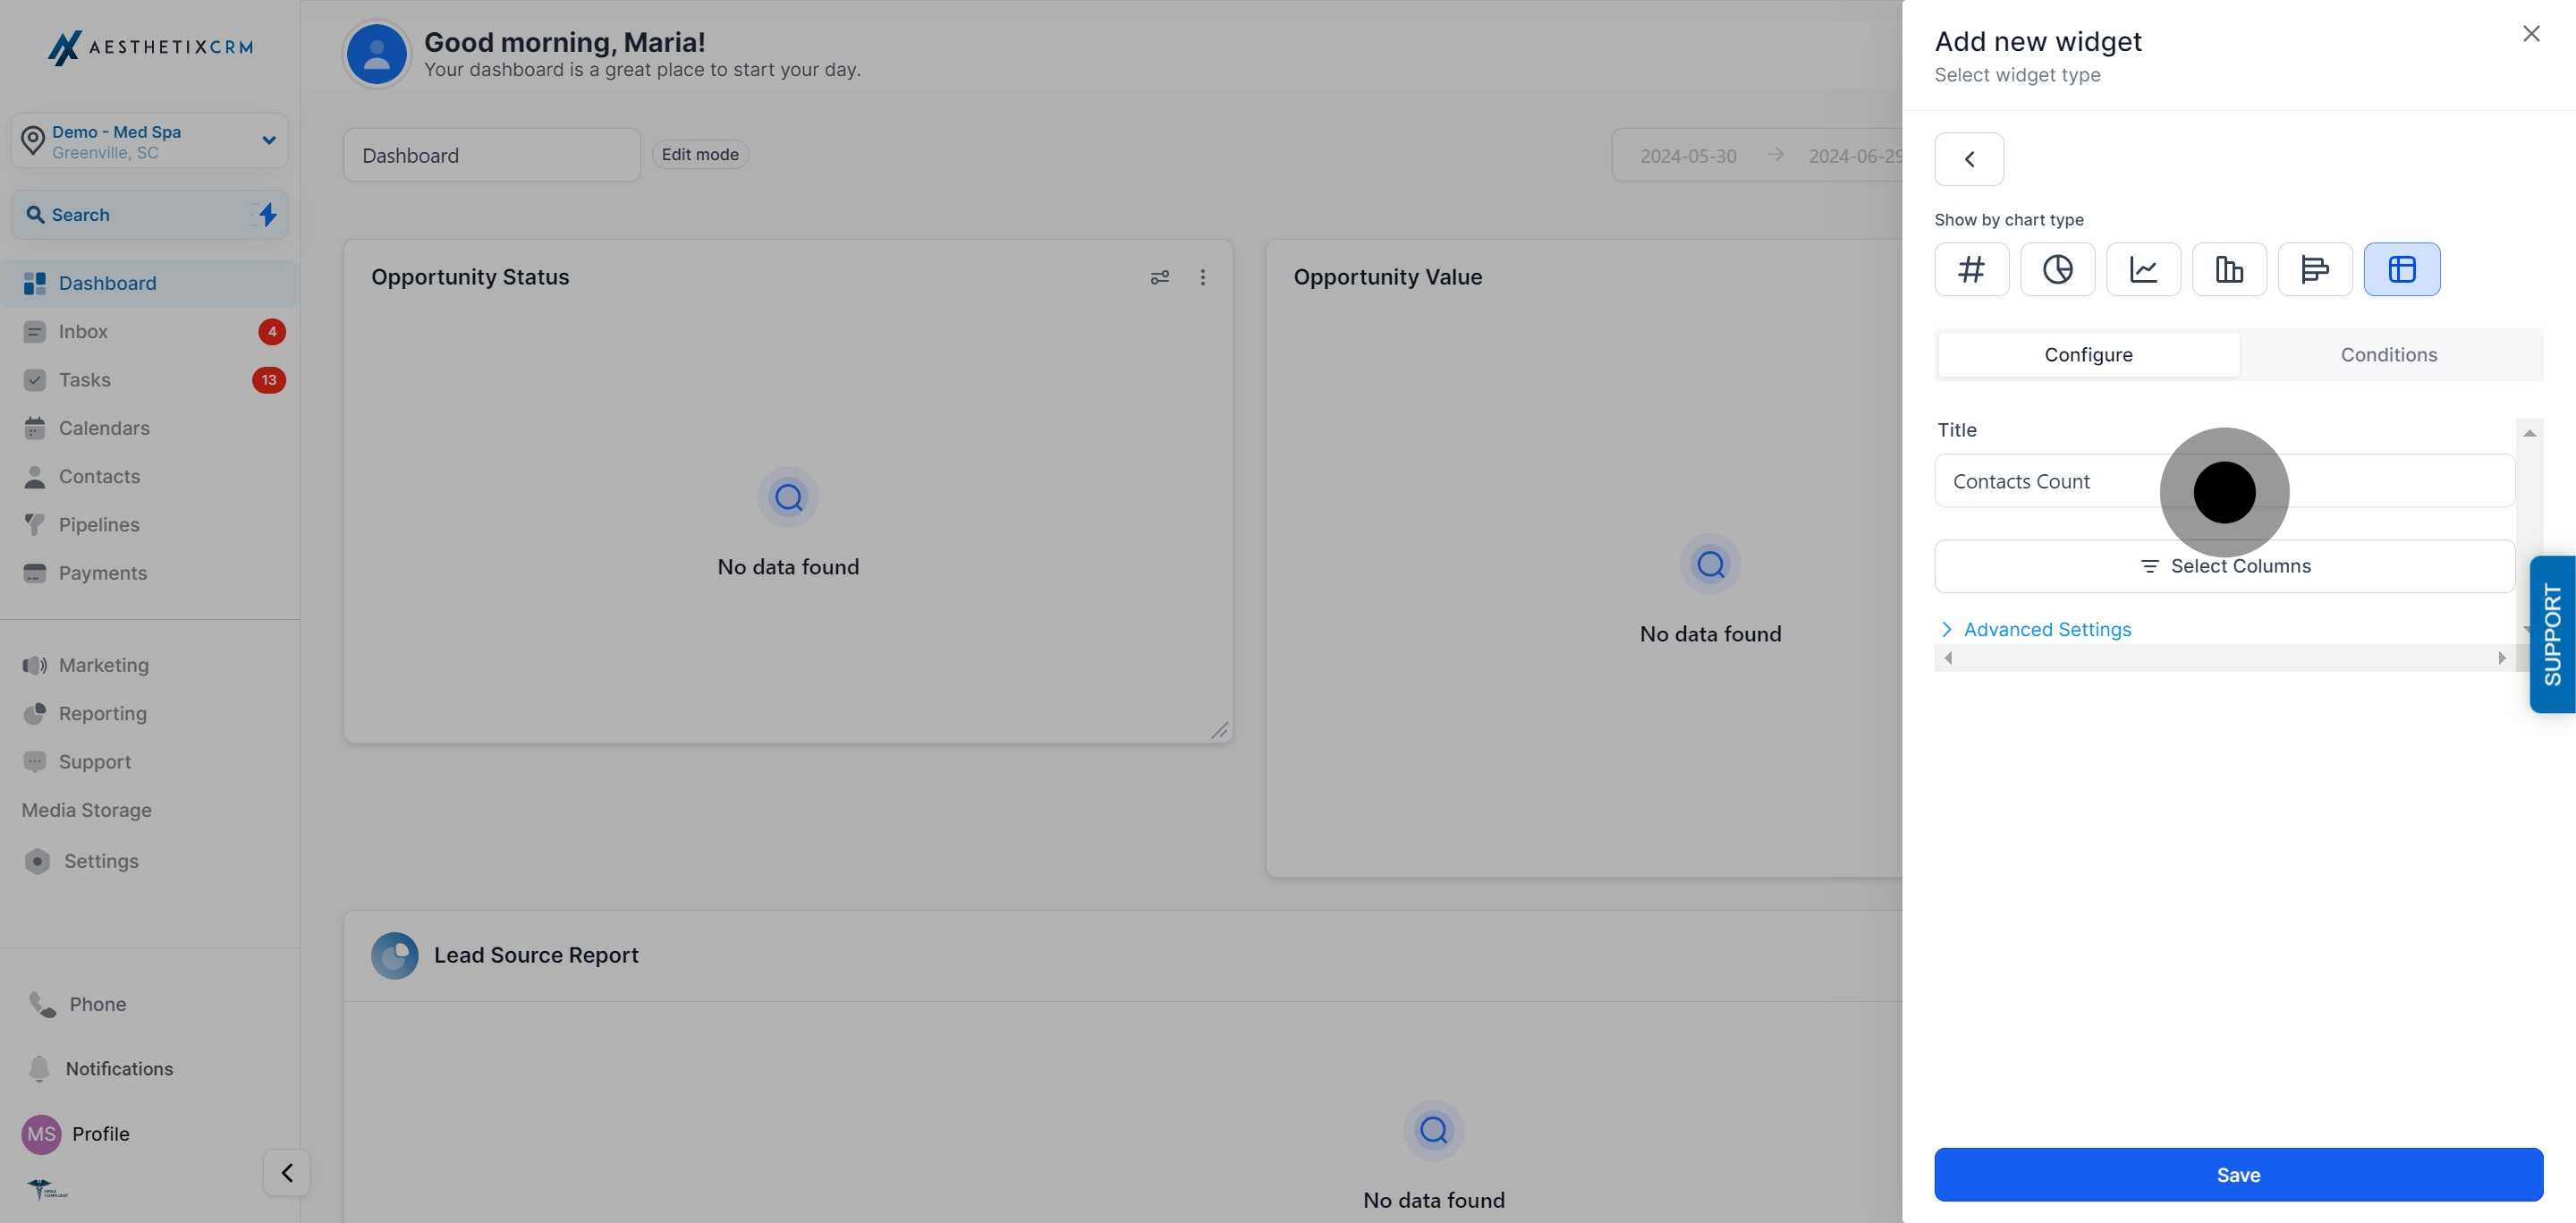
Click Select Columns to manage which columns appear on the table widget.
Check the fields you want to appear as columns. Available columns depend on the data source you picked for the widget (for example Contacts or Opportunities) and typically include standard fields like name, source, status, and value.
Click Save to apply your column selection.
Still in Advanced Settings, choose the column you want the table sorted by. For example, sort a leads-by-source table by Status so newer or unhandled leads surface at the top.
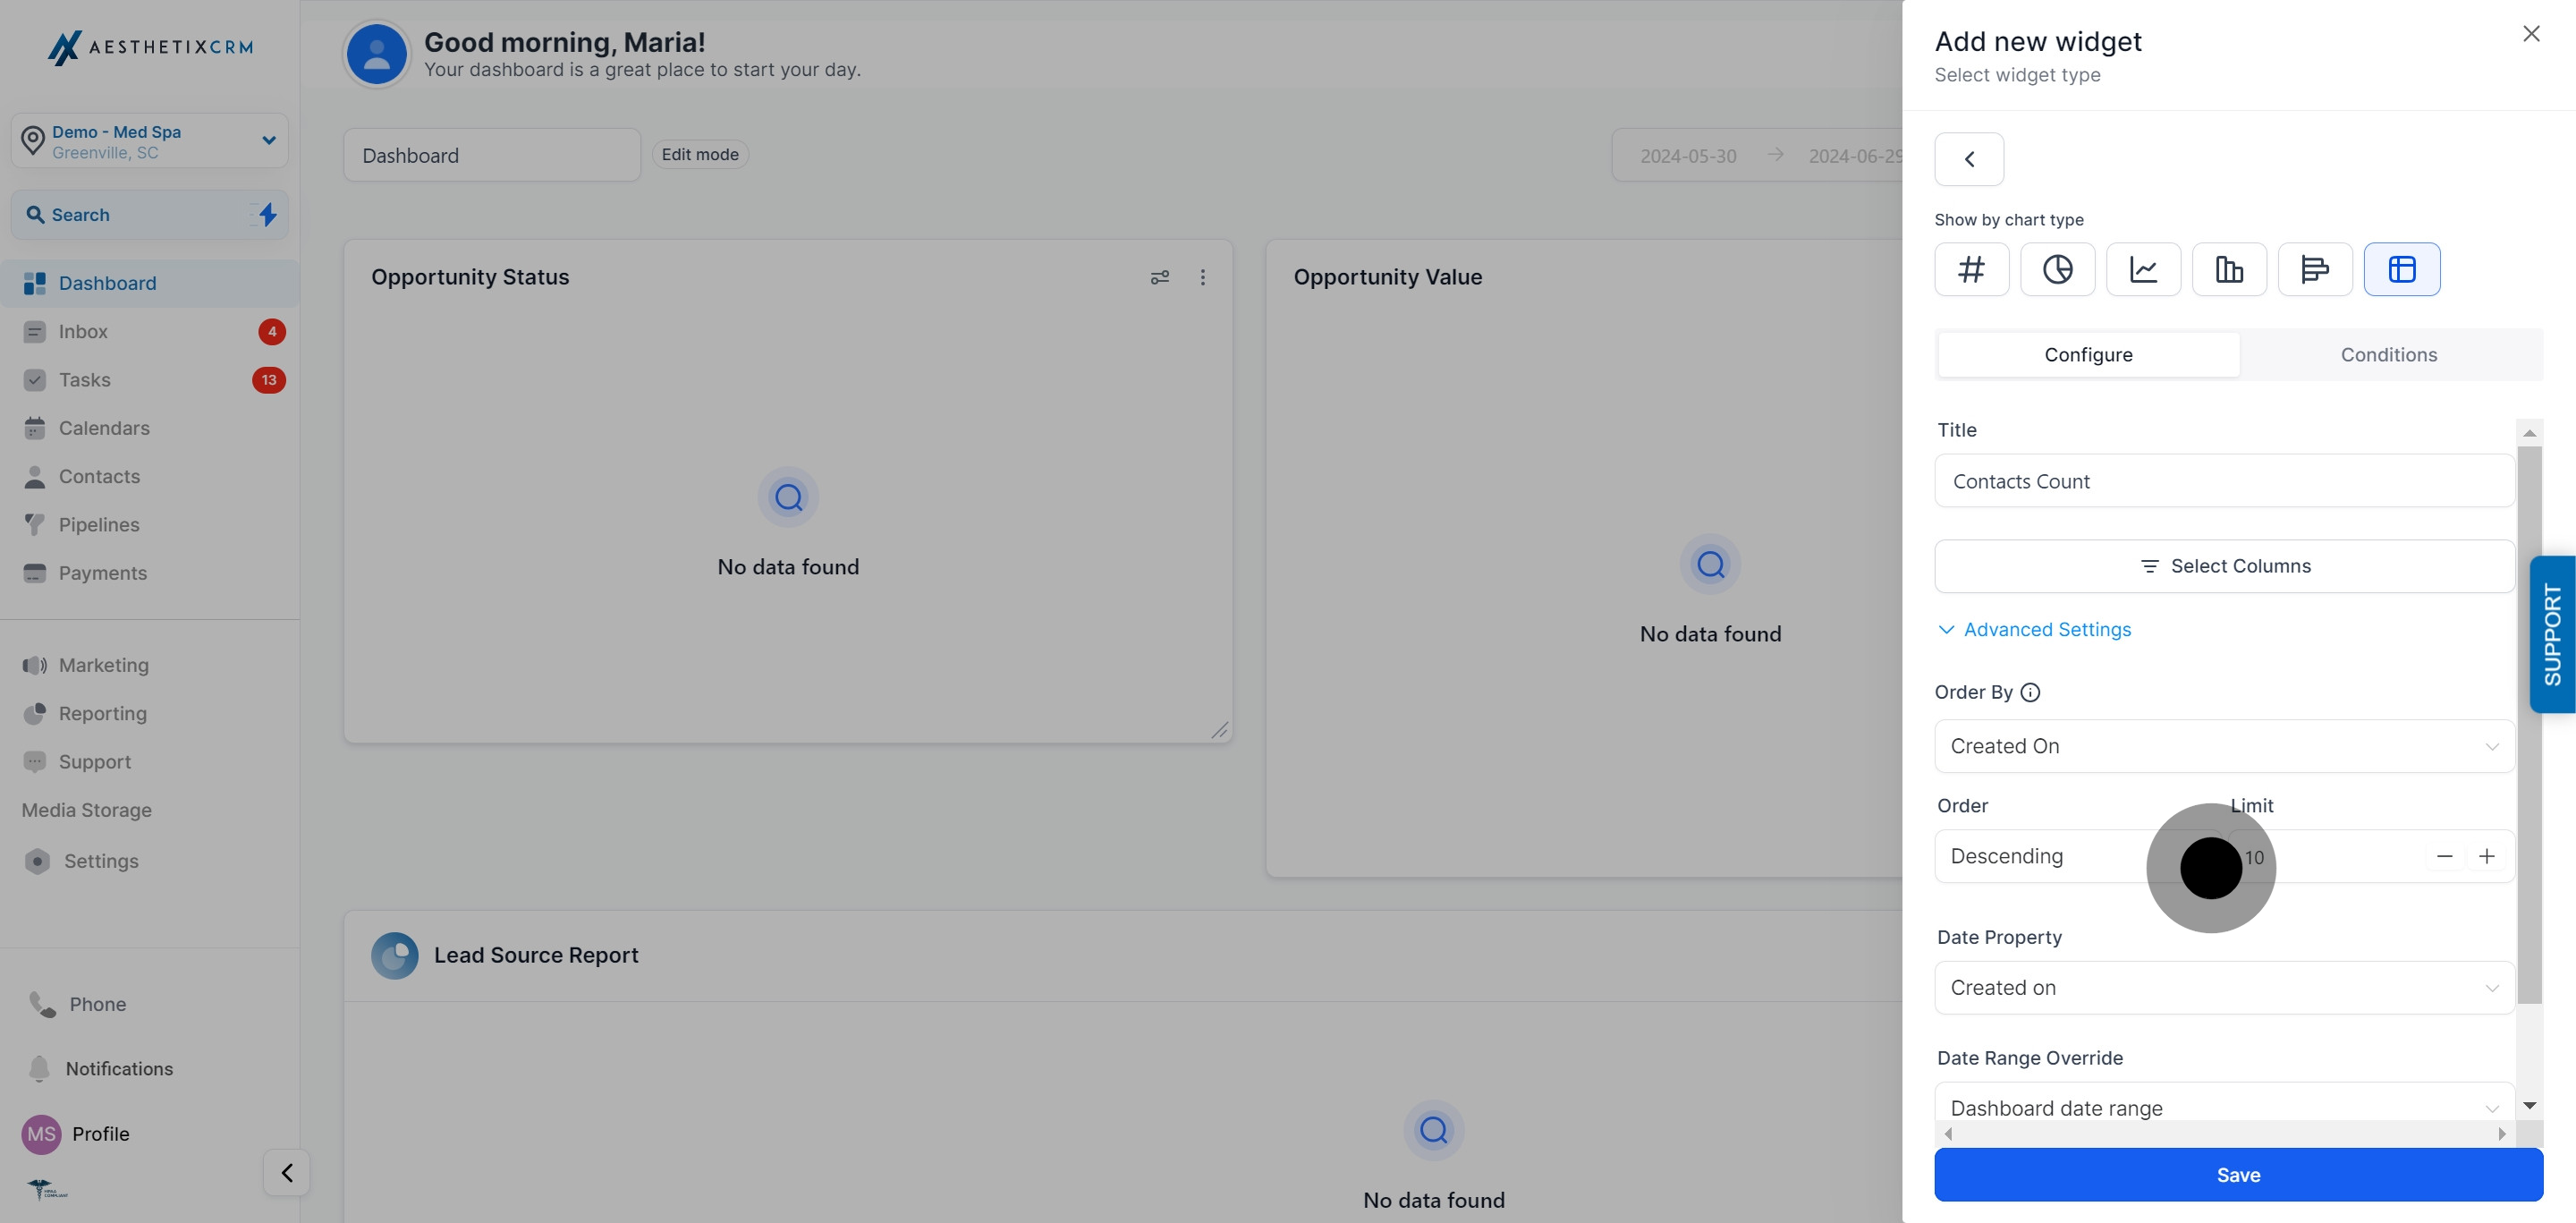
Click Save.
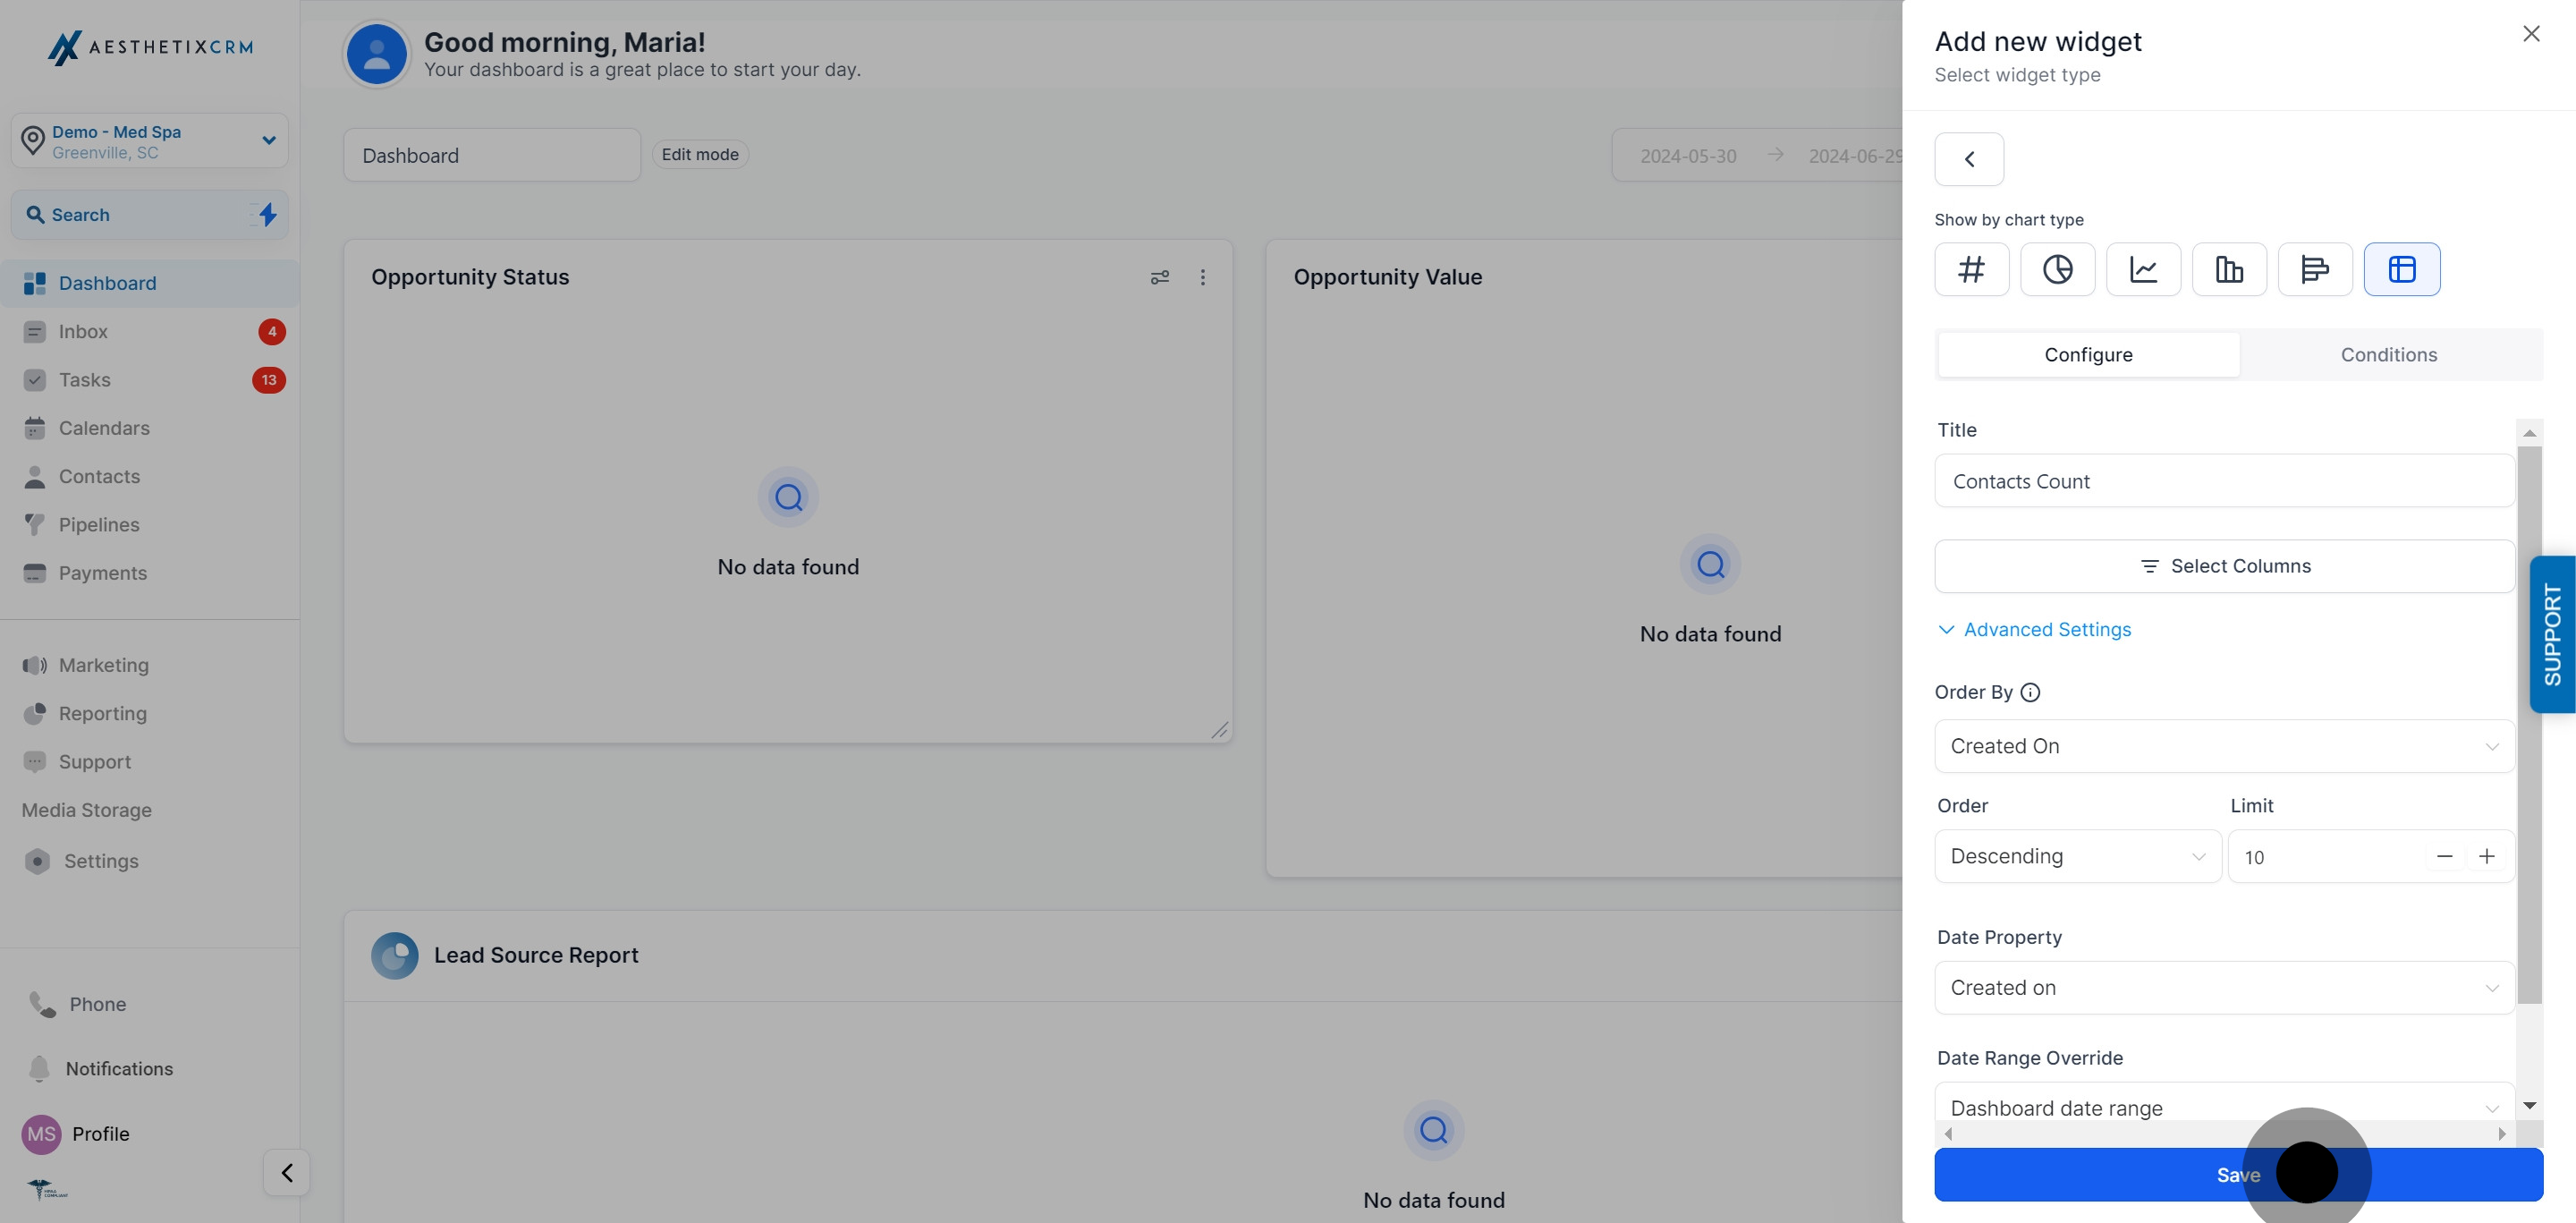
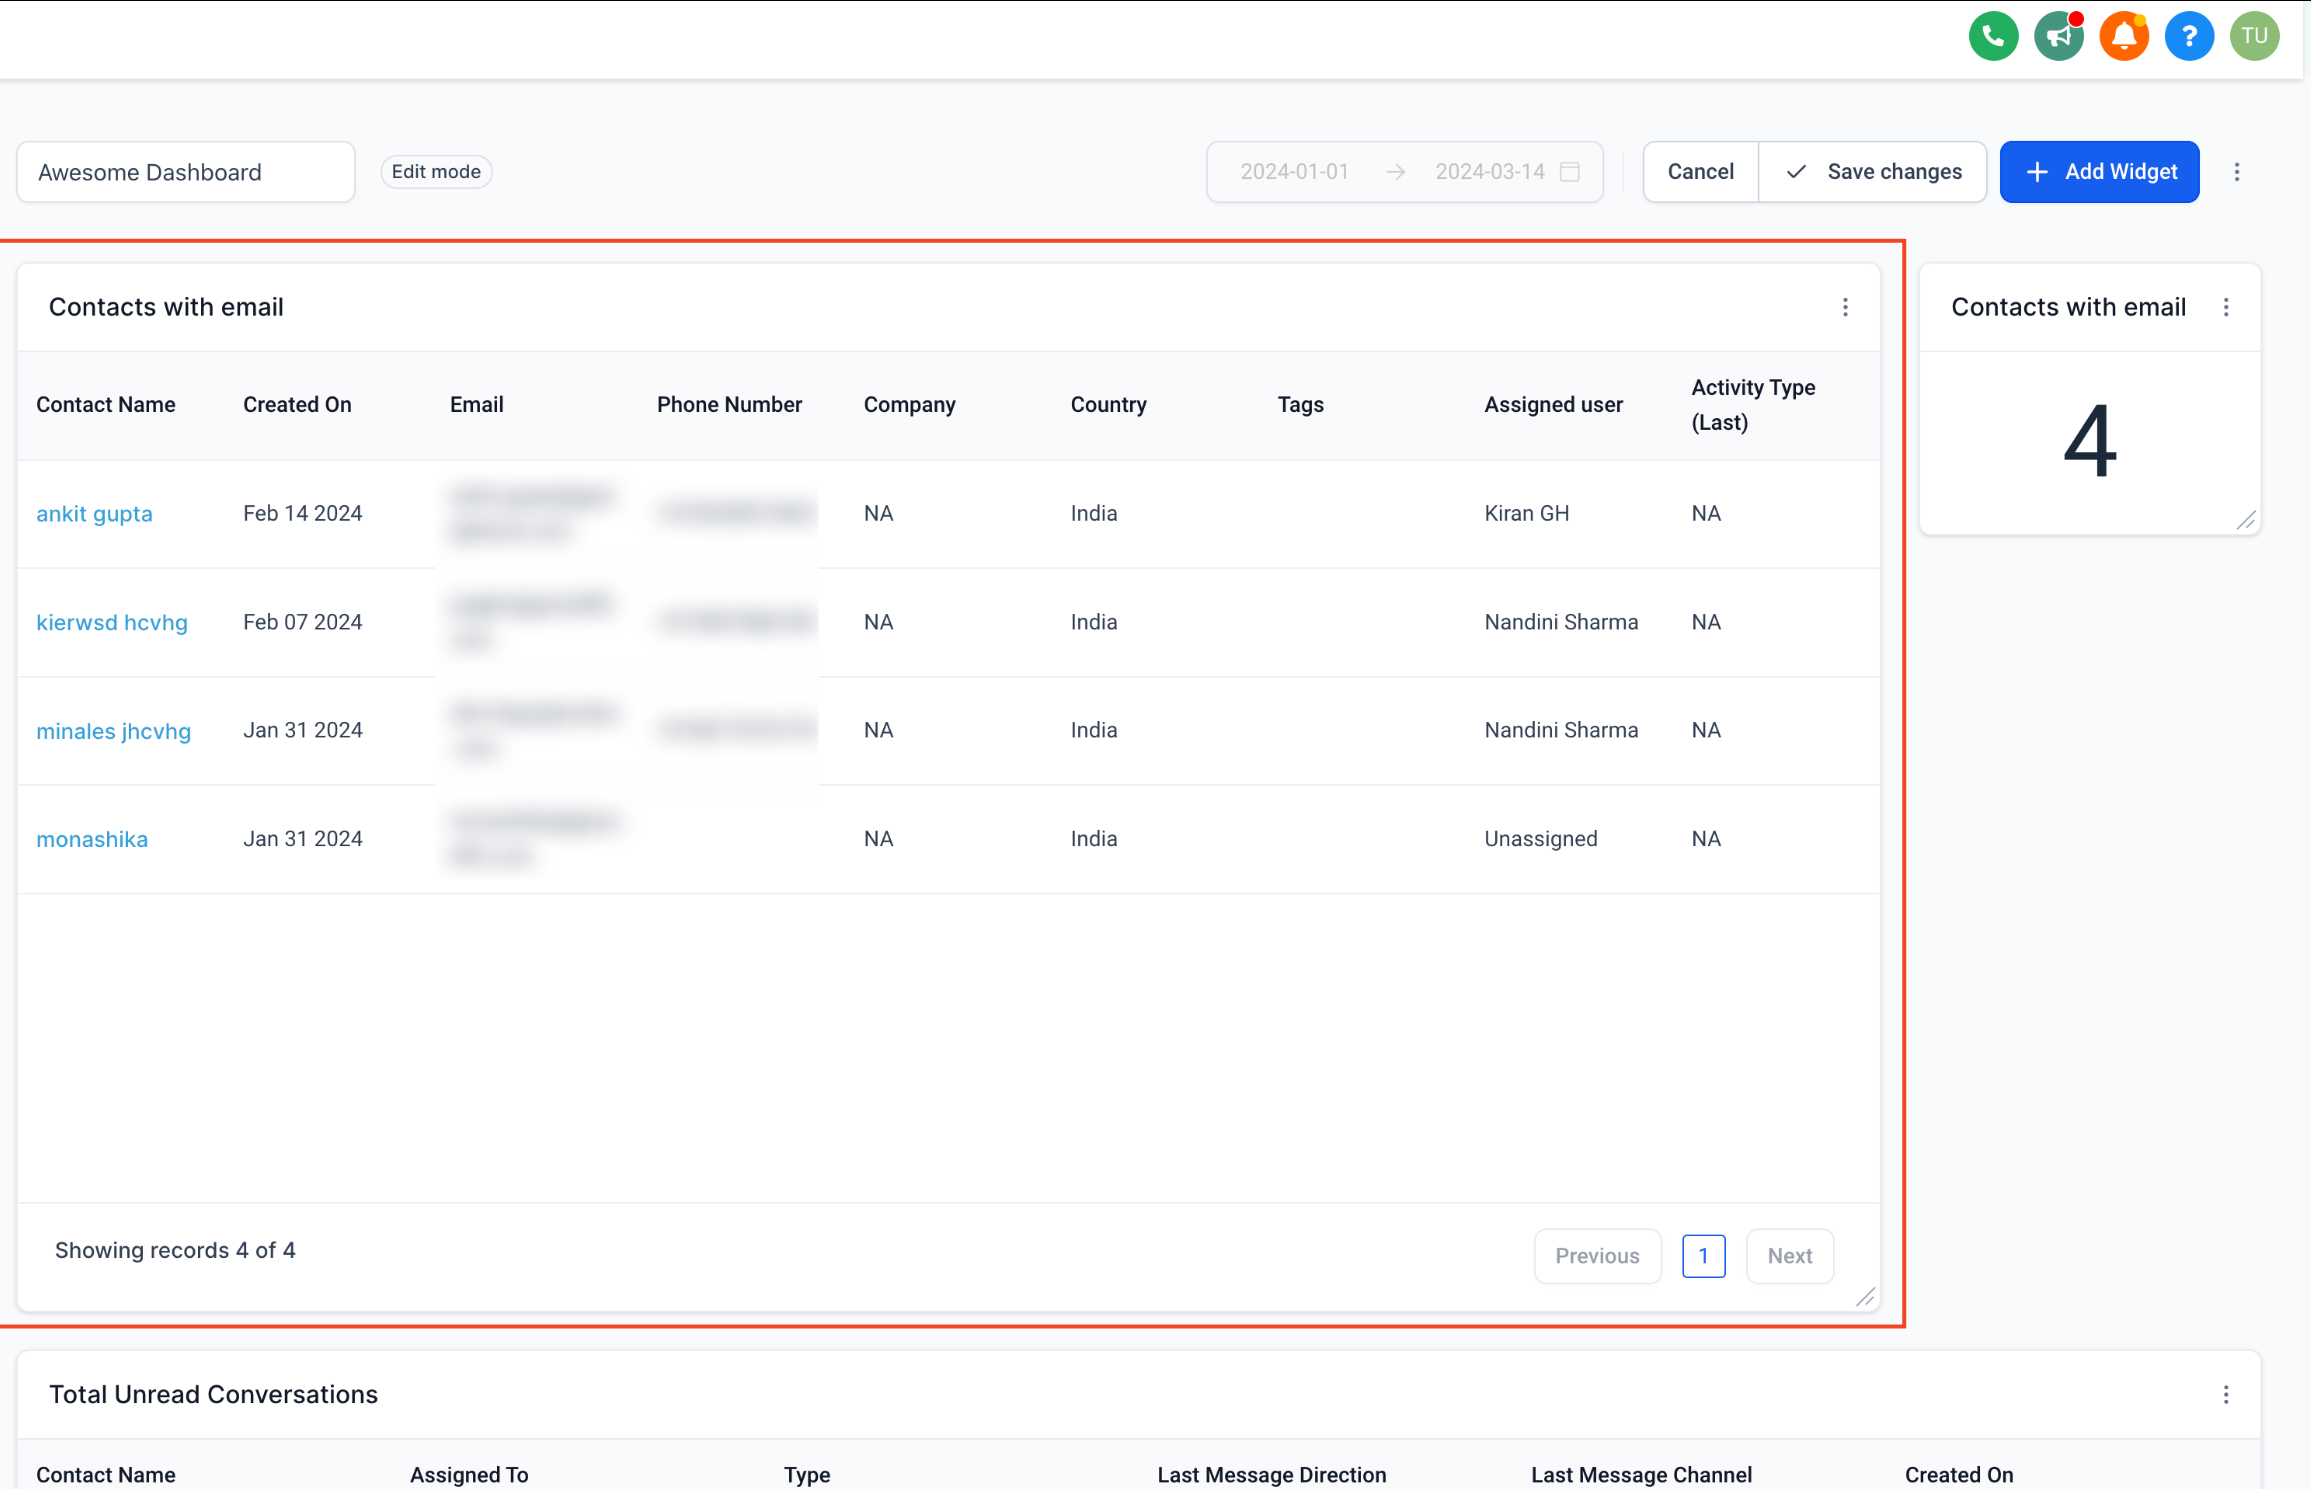
Check that all the information on the widget is correct.
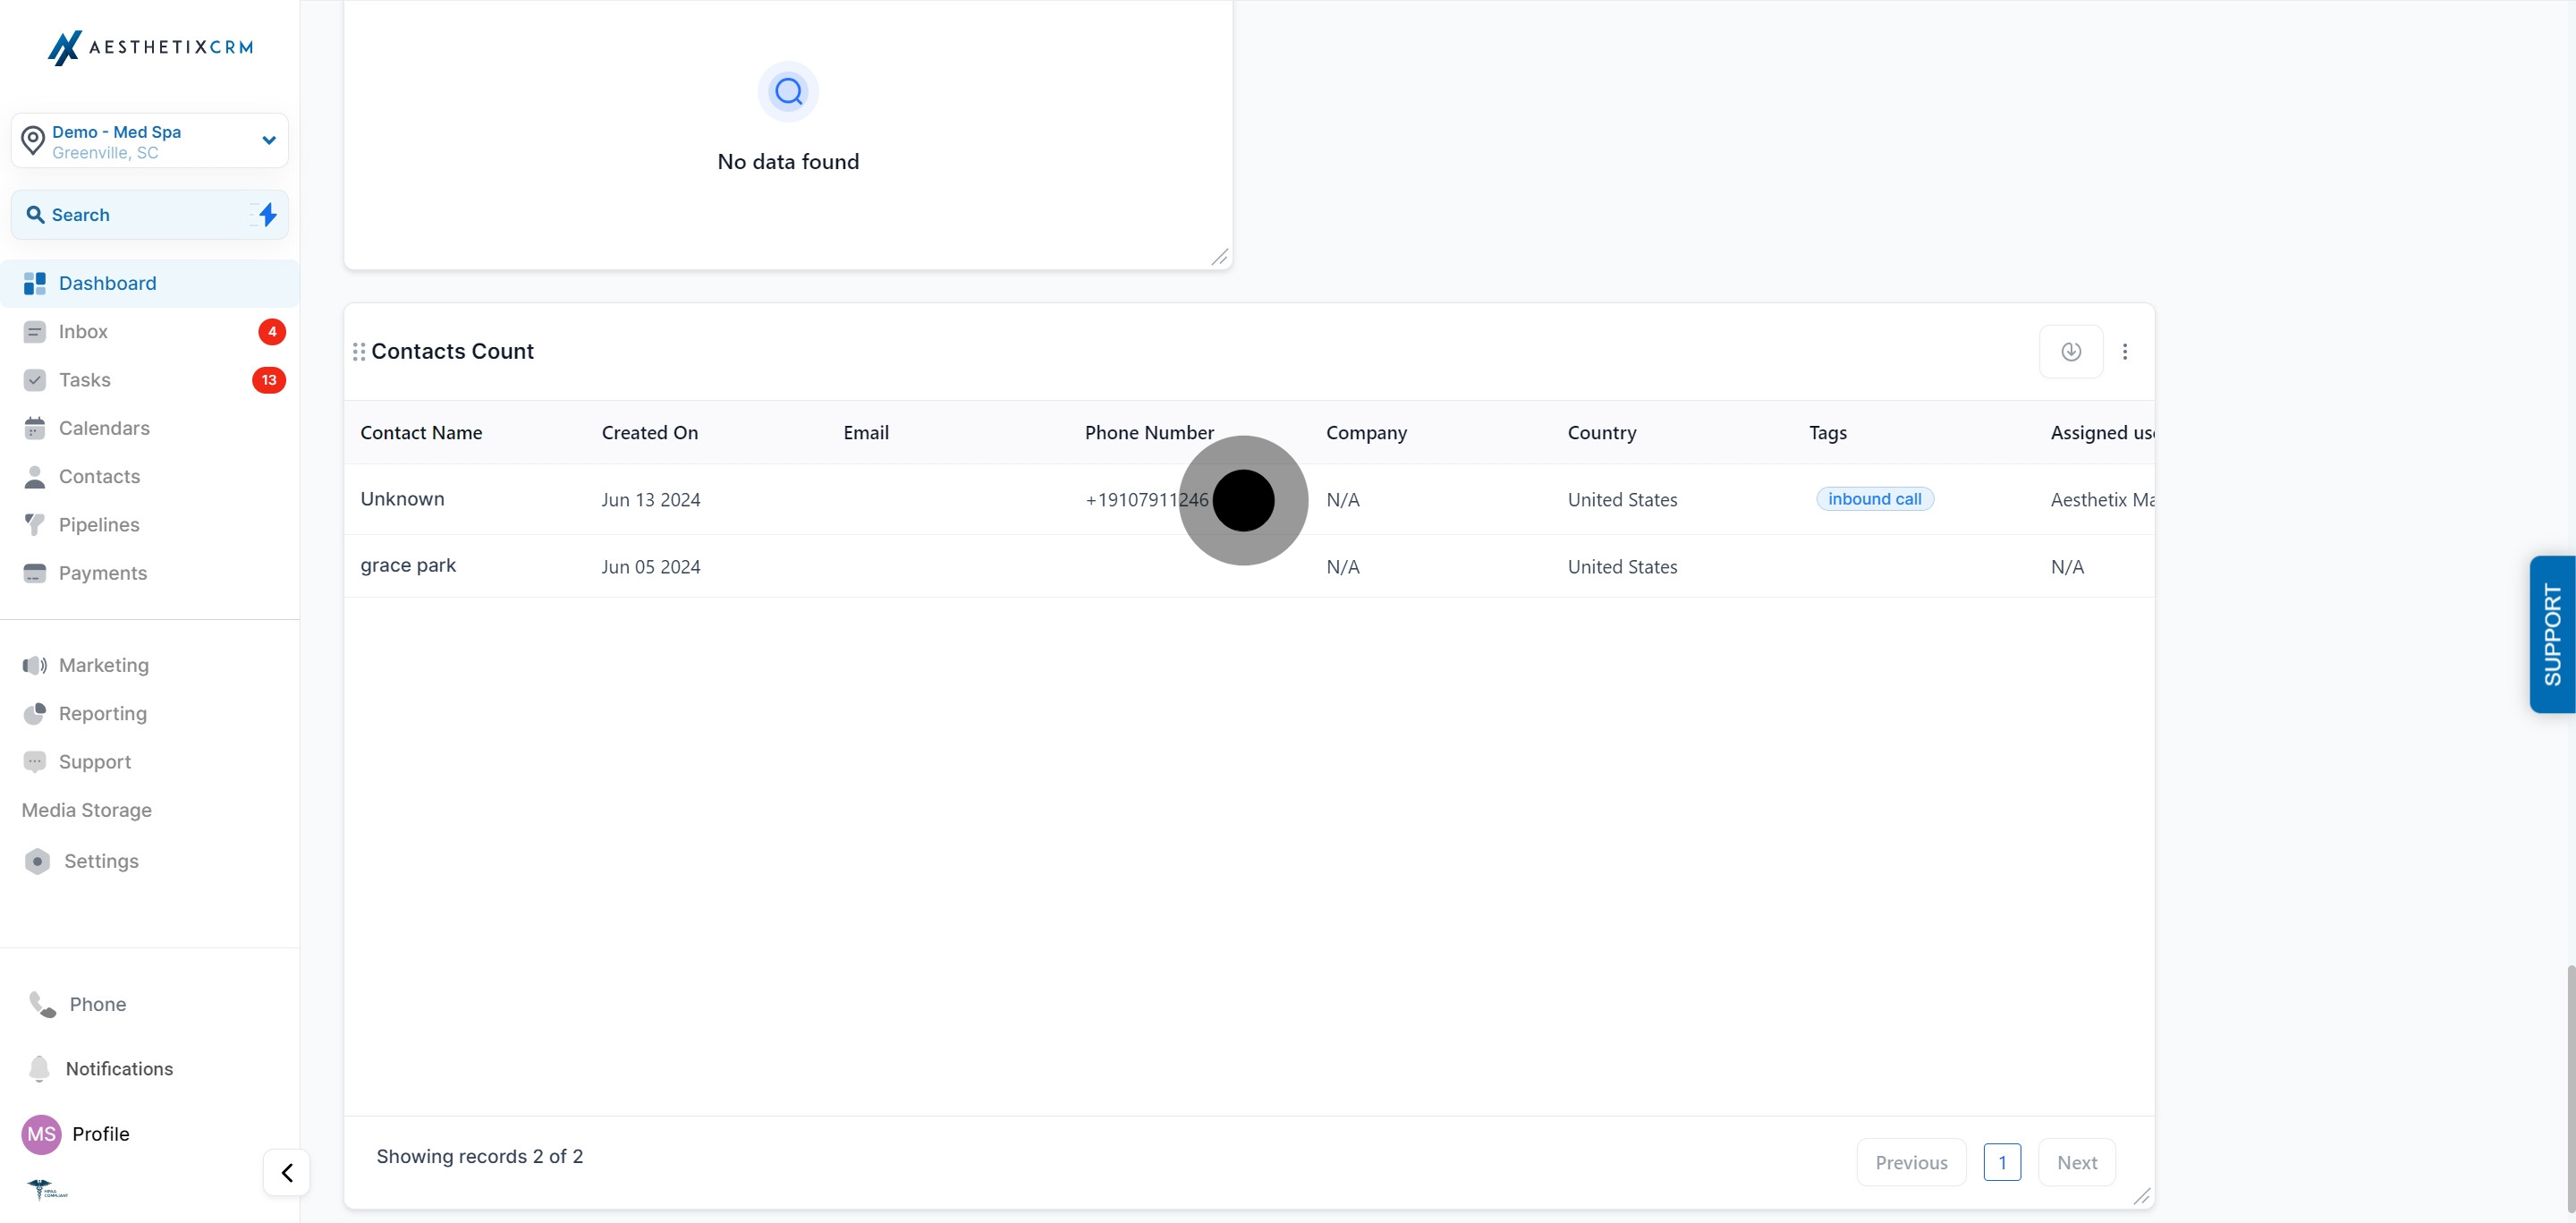
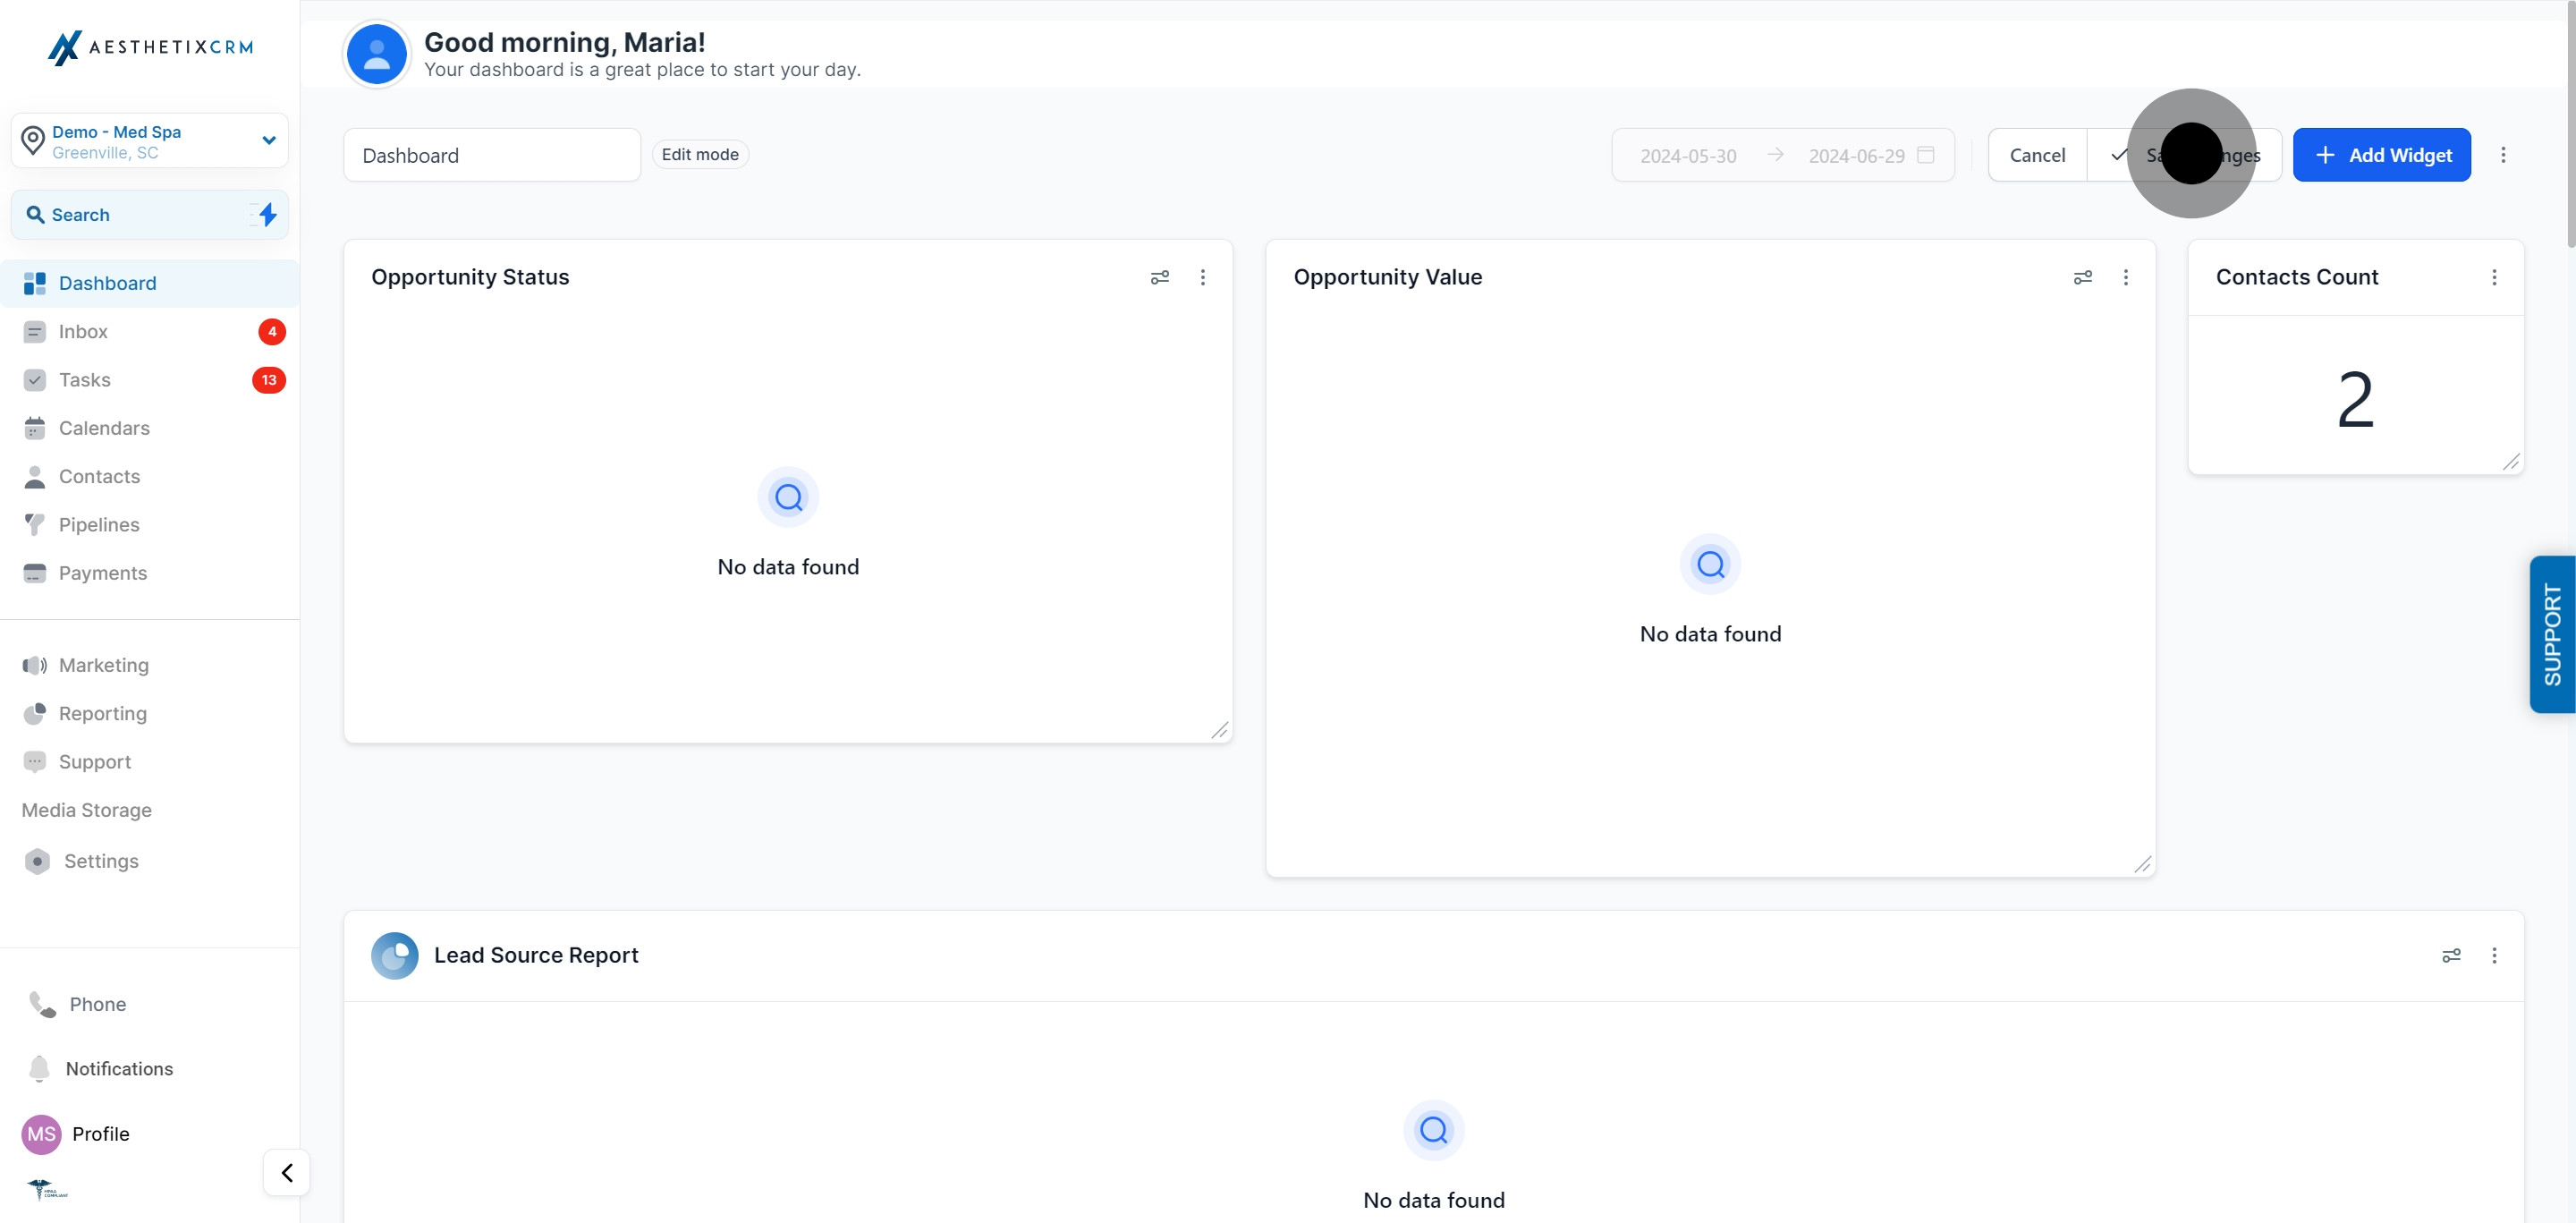
Click Save to add your widget to the Dashboard.
If something looks off after saving, reopen the widget's Advanced Settings and adjust the column selection or sort column, then save again.
Contacts and Opportunities table widgets also let you add your own custom fields as columns, not just the standard fields. This is useful when your practice tracks something specific, such as a treatment interest field or a referral source field, and you want that value visible directly in the table without opening each record.
Go to your Dashboard or Custom Report and click Edit to begin making changes.
Click Add Widget and choose either a Contacts or Opportunities table widget.
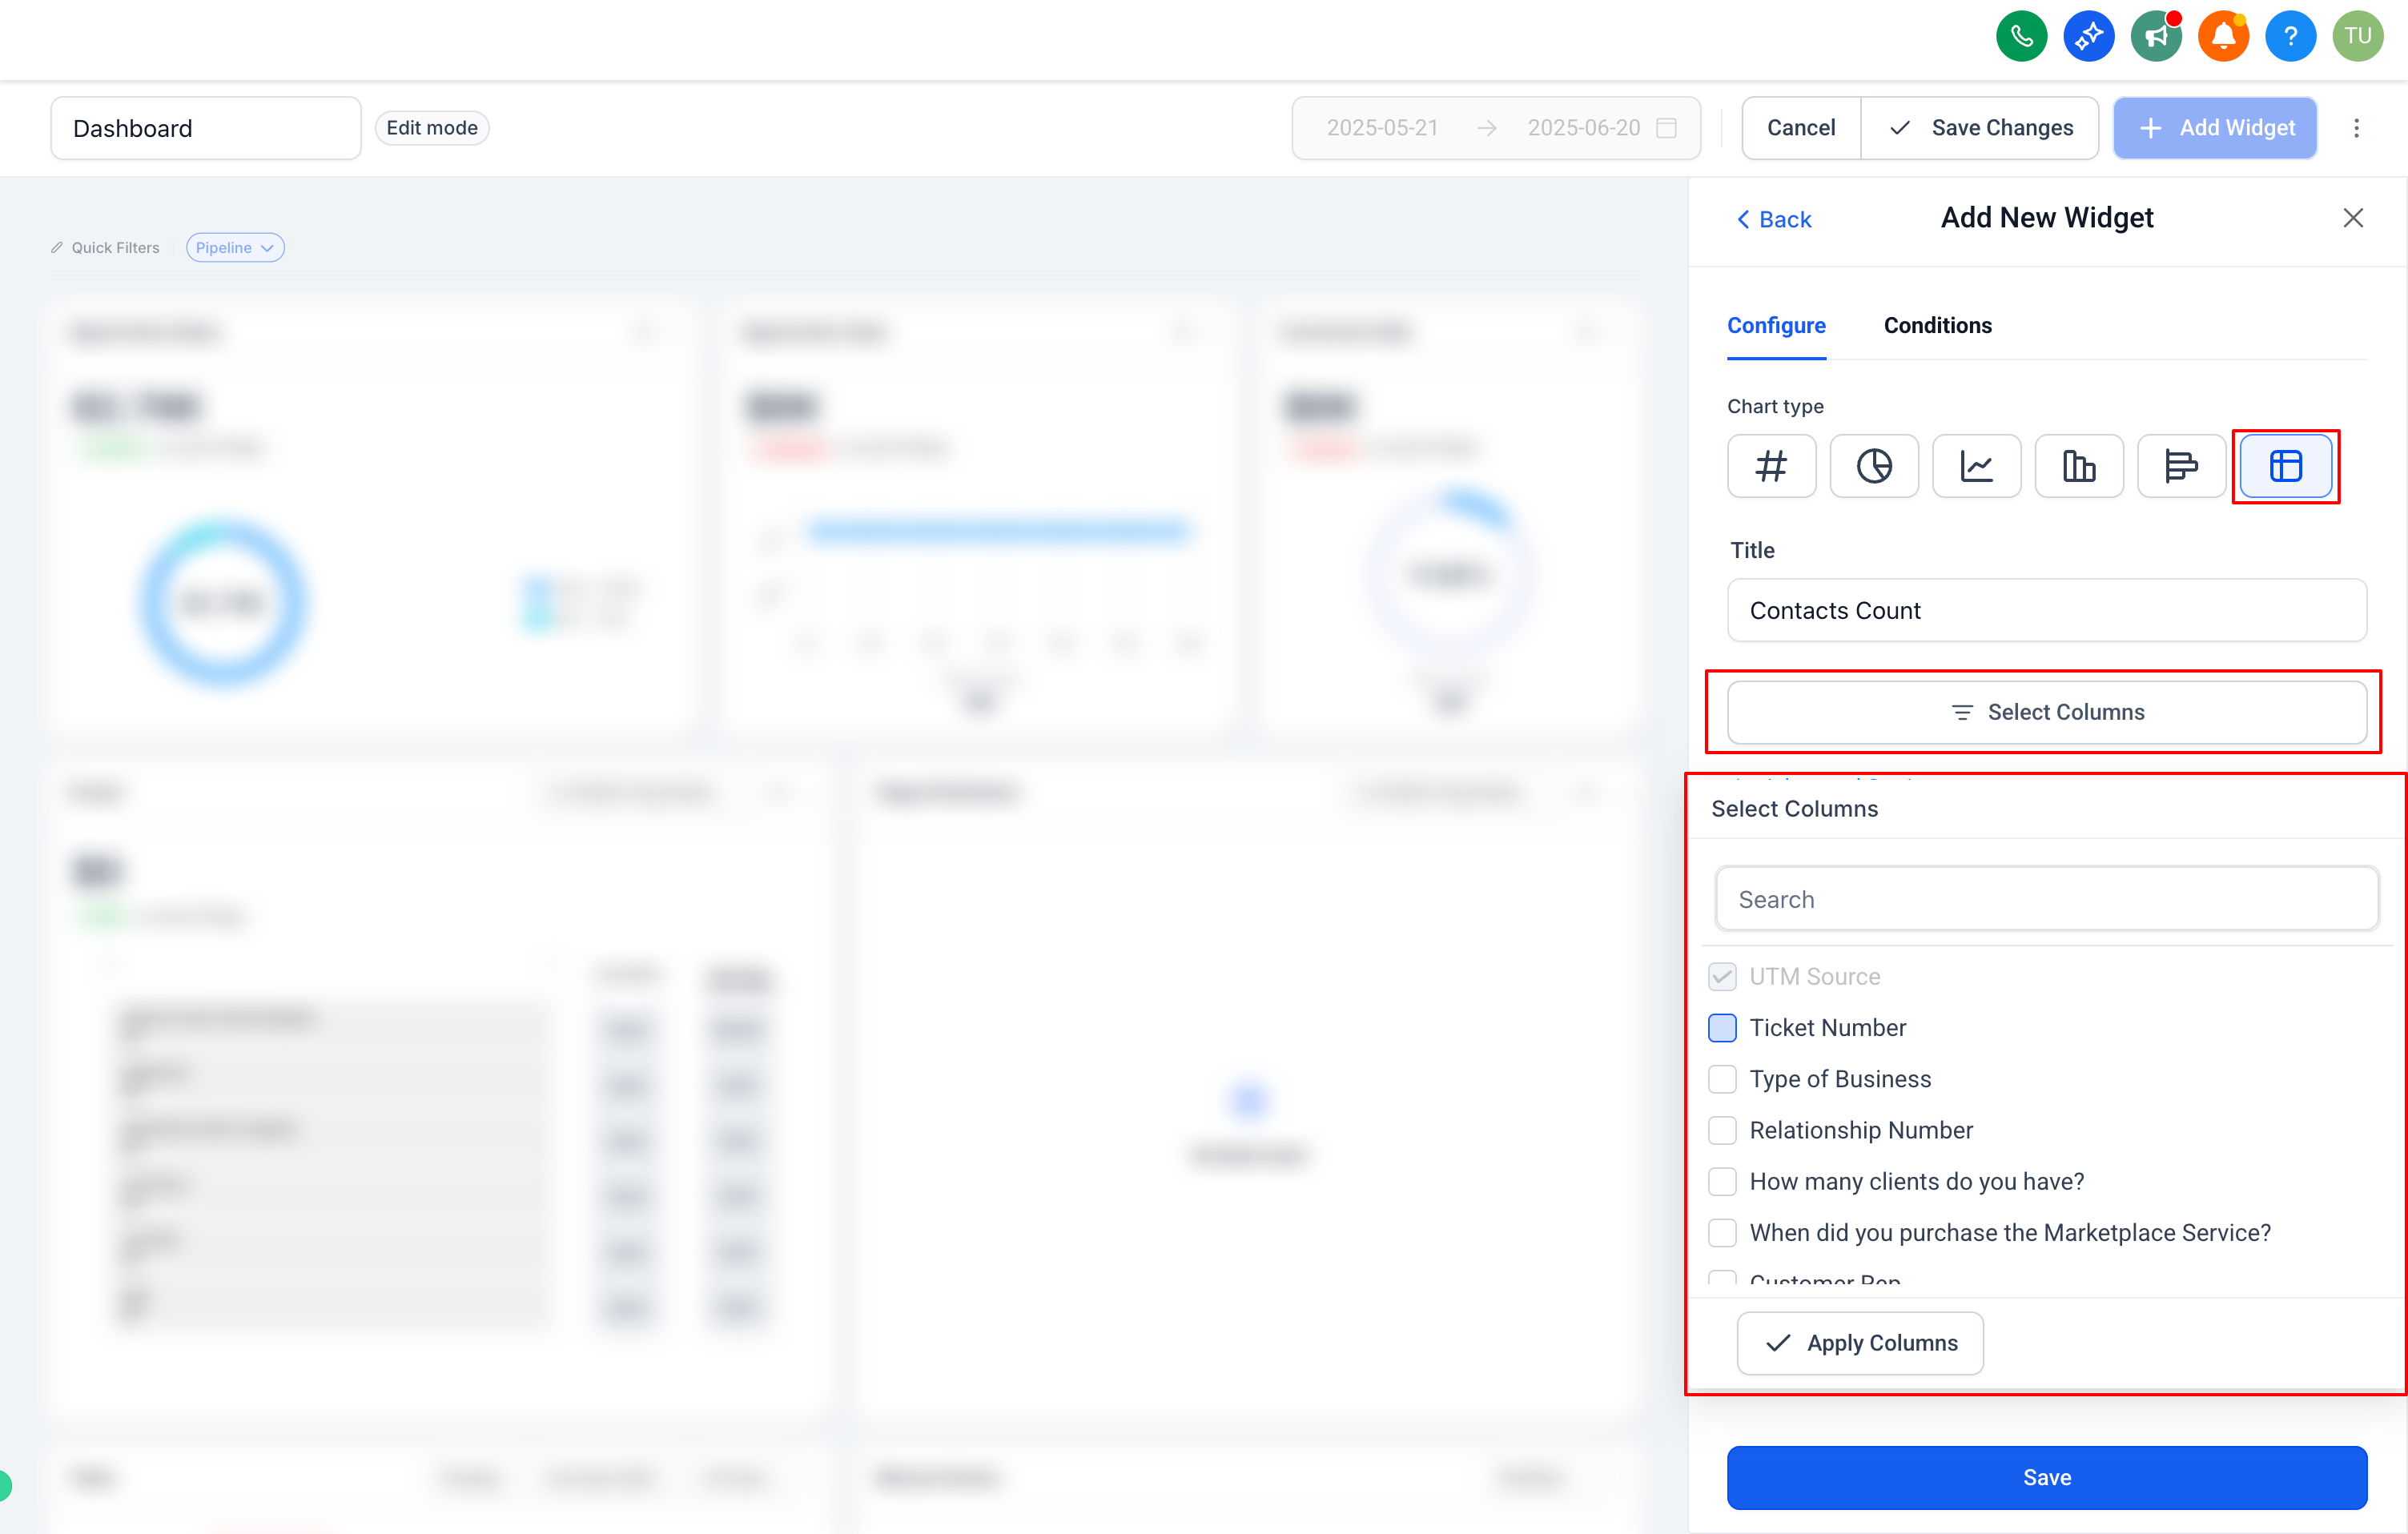
Open the column selector for the table widget. You'll now see all custom fields available on that record type, listed alongside the standard fields.
Check the custom fields you want to display.
Click Save to apply your changes. Your selected custom fields now appear as columns in the table.
The Birthdate field is also available as a selectable column specifically on Contacts widgets, which can help front-desk staff spot upcoming patient birthdays for outreach.
Adding fields to a widget only changes how the data is displayed. It does not change or move any underlying patient or contact data, and you only need permission to edit the Dashboard or Custom Report itself, no additional setup is required.
On Email widget table charts, a Source Action Name column helps you identify what triggered the email. If the email is associated with a workflow, Source Action Name displays the workflow step name, which improves traceability when you're reviewing dashboards and reports.
A common table chart for a med spa Dashboard is a leads-by-source table: each row is a lead, with columns for source, status, and assigned staff member. Front desk or marketing staff can scan it to see which channels are producing leads and which ones still need follow-up, without digging into individual contact records.
If you want to break lead performance down further by campaign or ad channel using UTM parameters, that level of detail belongs in Attribution reporting rather than a table widget. See the Attribution guide for tracking leads back to specific campaigns and channels.
Which record types can I build a table chart from? Table widgets are most commonly built from Contacts and Opportunities data, which is also where custom field columns are available.
Can I add my own custom fields as table columns? Yes. Open the column selector on a Contacts or Opportunities table widget and any custom fields on that record type are listed alongside the standard fields.
Is the Birthdate field available as a column? Yes, Birthdate is a selectable column on Contacts table widgets, which is handy for spotting upcoming patient birthdays.
Does adding or removing columns change my underlying data? No. Selecting columns only changes what's displayed in the widget. It has no effect on the actual contact or opportunity records.
Do I need special permissions to edit a table widget? You only need permission to edit the Dashboard (or Custom Report) the widget lives on. No additional setup is required.
Can I sort a table widget by a custom field? Sorting is set in the widget's Advanced Settings, where you choose which column controls the order. If your custom field is added as a column, it can typically be selected as the sort column as well.
Are table widgets available in Custom Reports too, or only the Dashboard? Table widgets with custom field columns work in both Dashboards and Custom Reports, so you can reuse the same setup in either place.
Where do I see which campaign or ad brought in a lead? That level of detail (UTM parameters, campaign attribution) is covered in the Attribution guide, not in table chart columns.
Can a table widget show email activity? Yes. On Email widget table charts, a Source Action Name column can help identify what triggered the email. If the email is tied to a workflow, this column shows the workflow step name for easier traceability.
