Dashboard widgets are the small, interactive charts and tables that make up your practice's KPI boards, things like new leads, booked consults, revenue, pipeline value, conversion rates, and channel attribution. Customizing a widget lets you rename it, choose what data it tracks, pick how that data is displayed, and filter it down to exactly the segment you care about. This guide covers both adding/customizing a widget from scratch and editing a widget that's already on your dashboard.
Interactive walkthrough
Interactive walkthrough
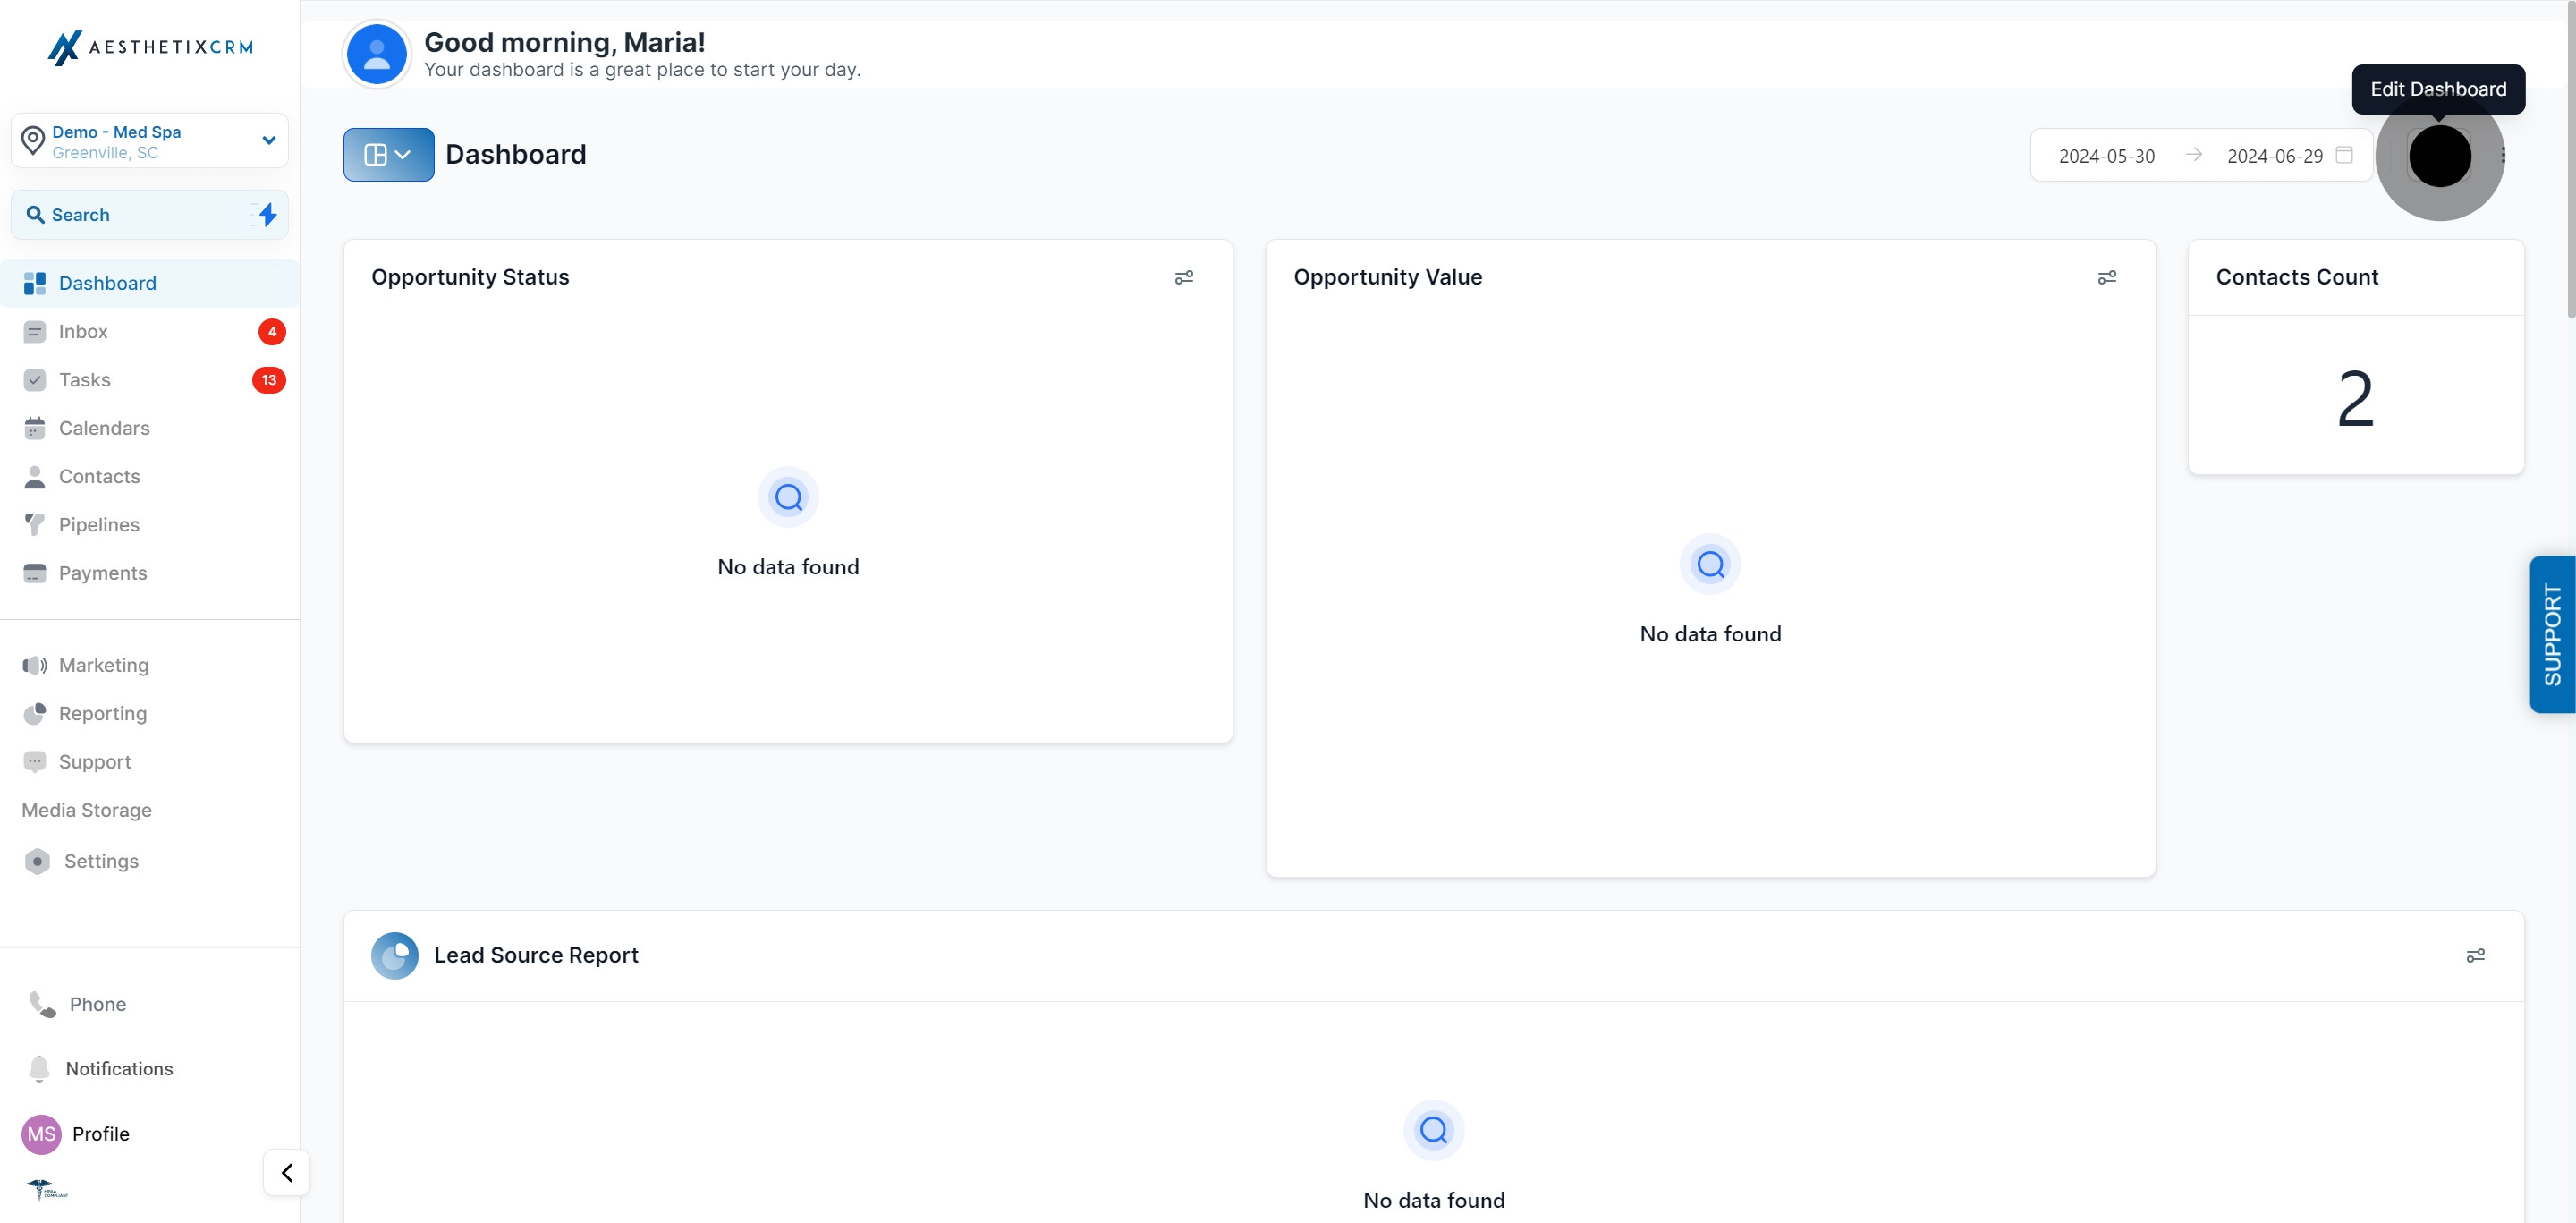
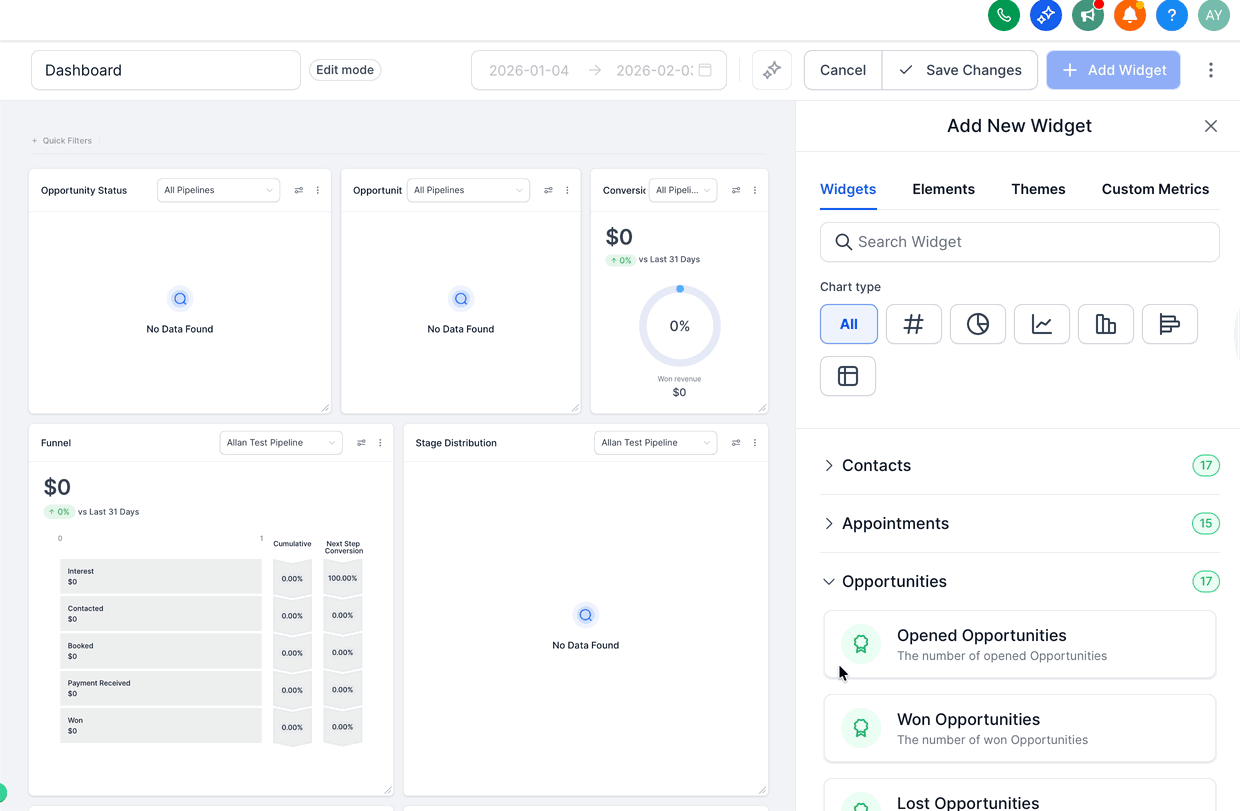
From your Dashboard, click Edit Dashboard to enter edit mode.
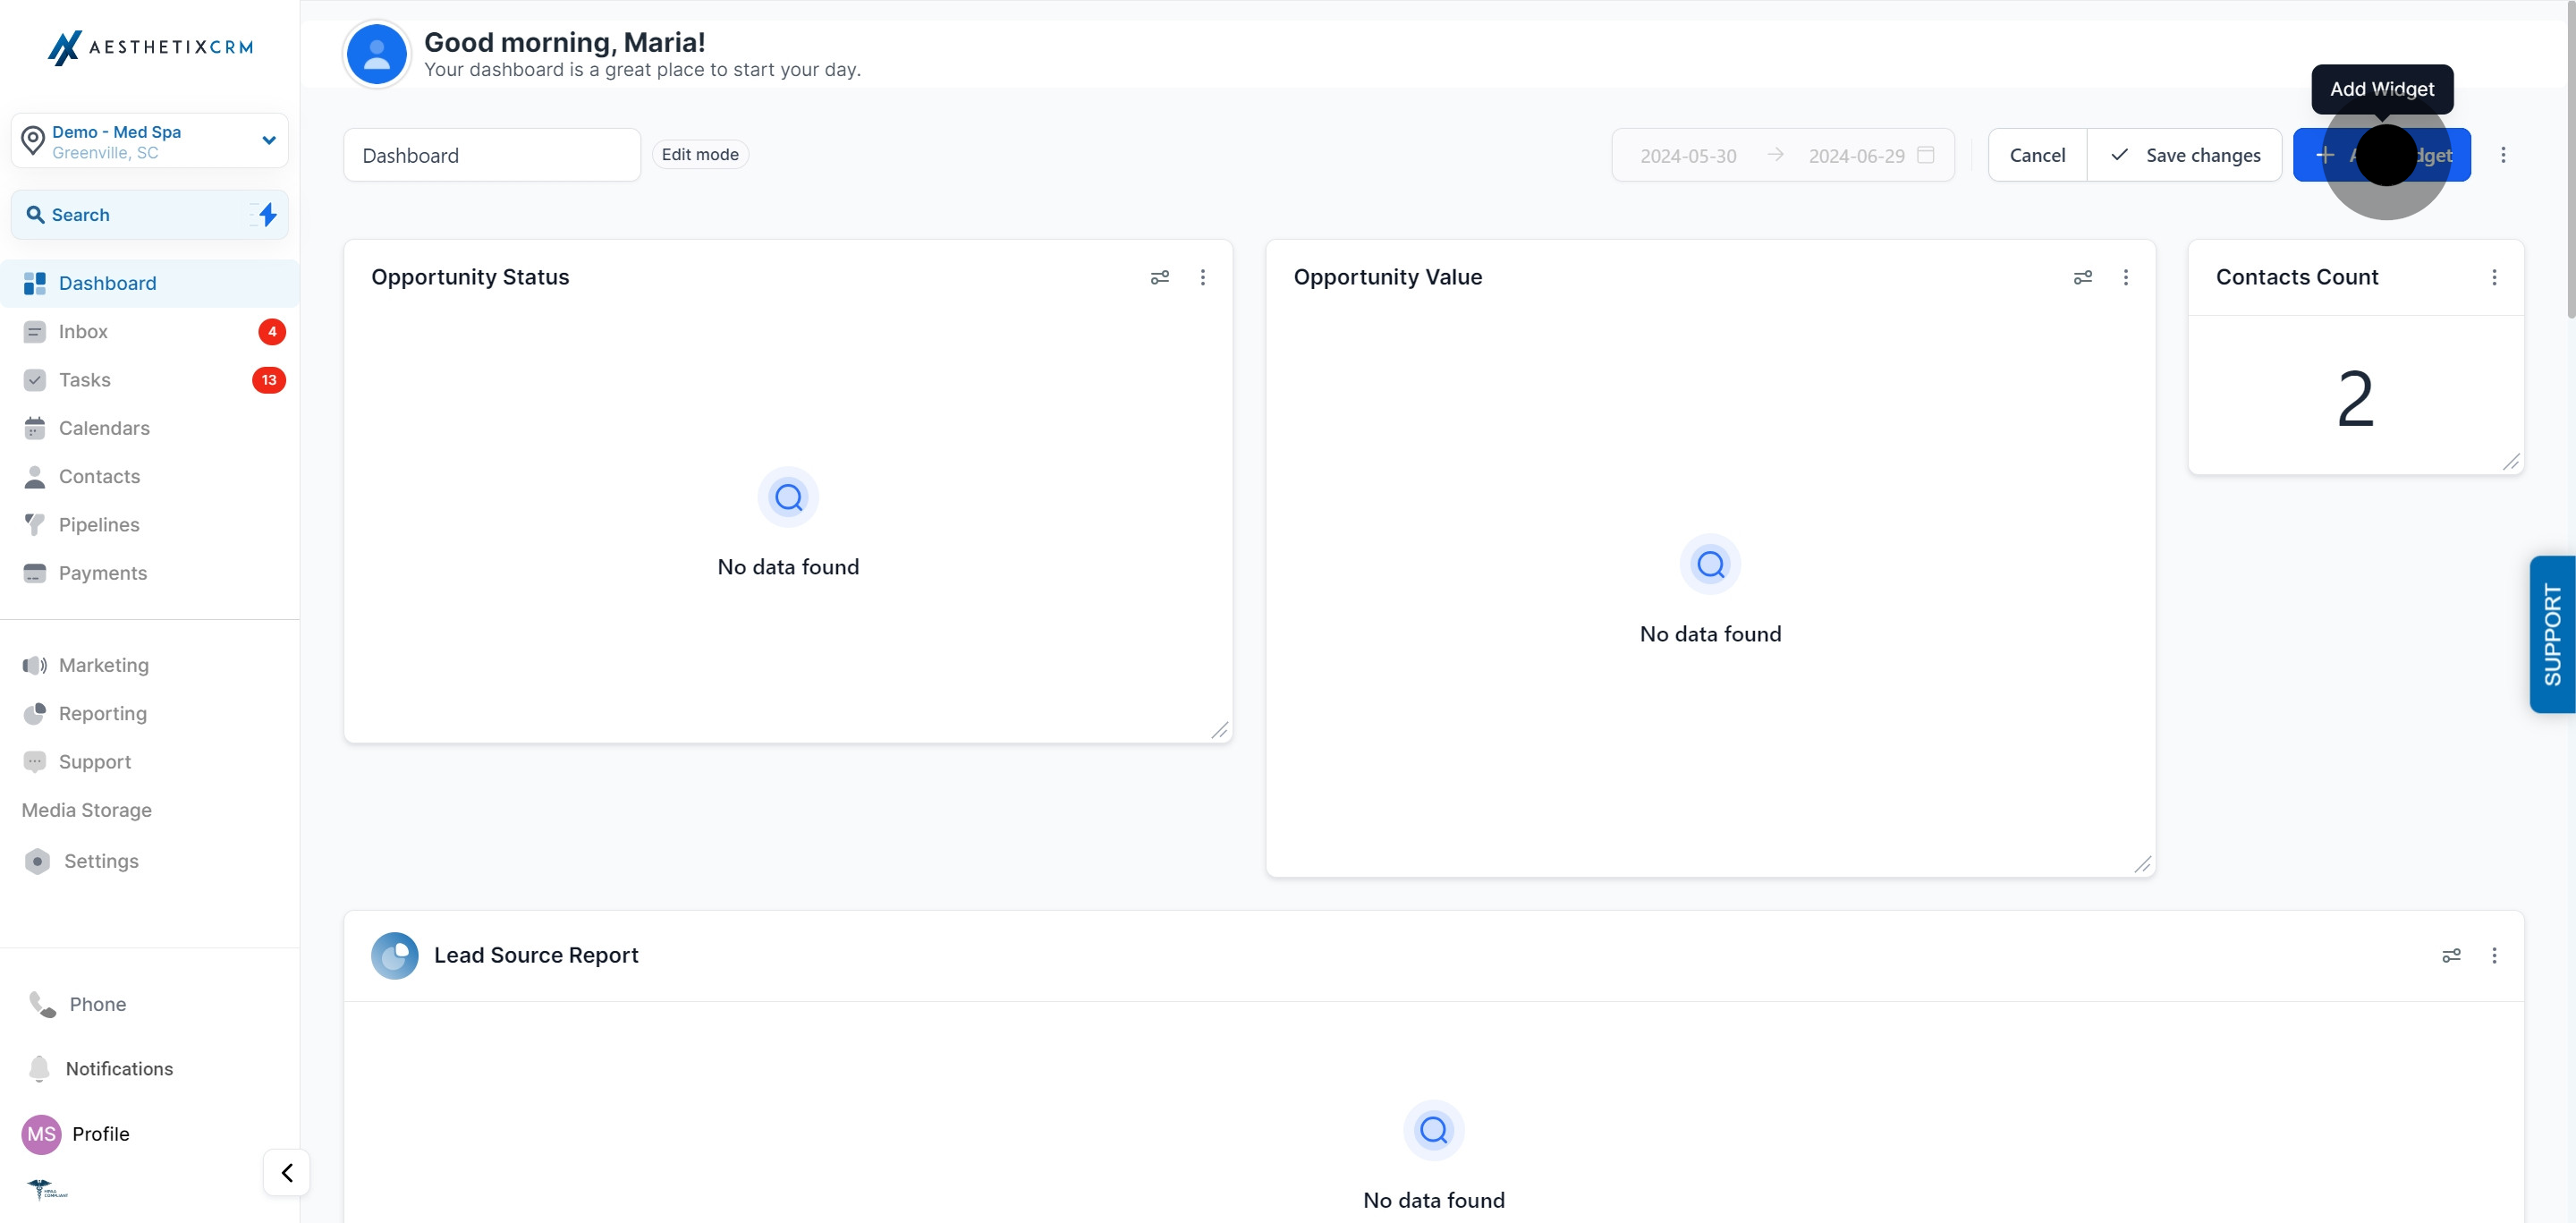
Click Add Widget.
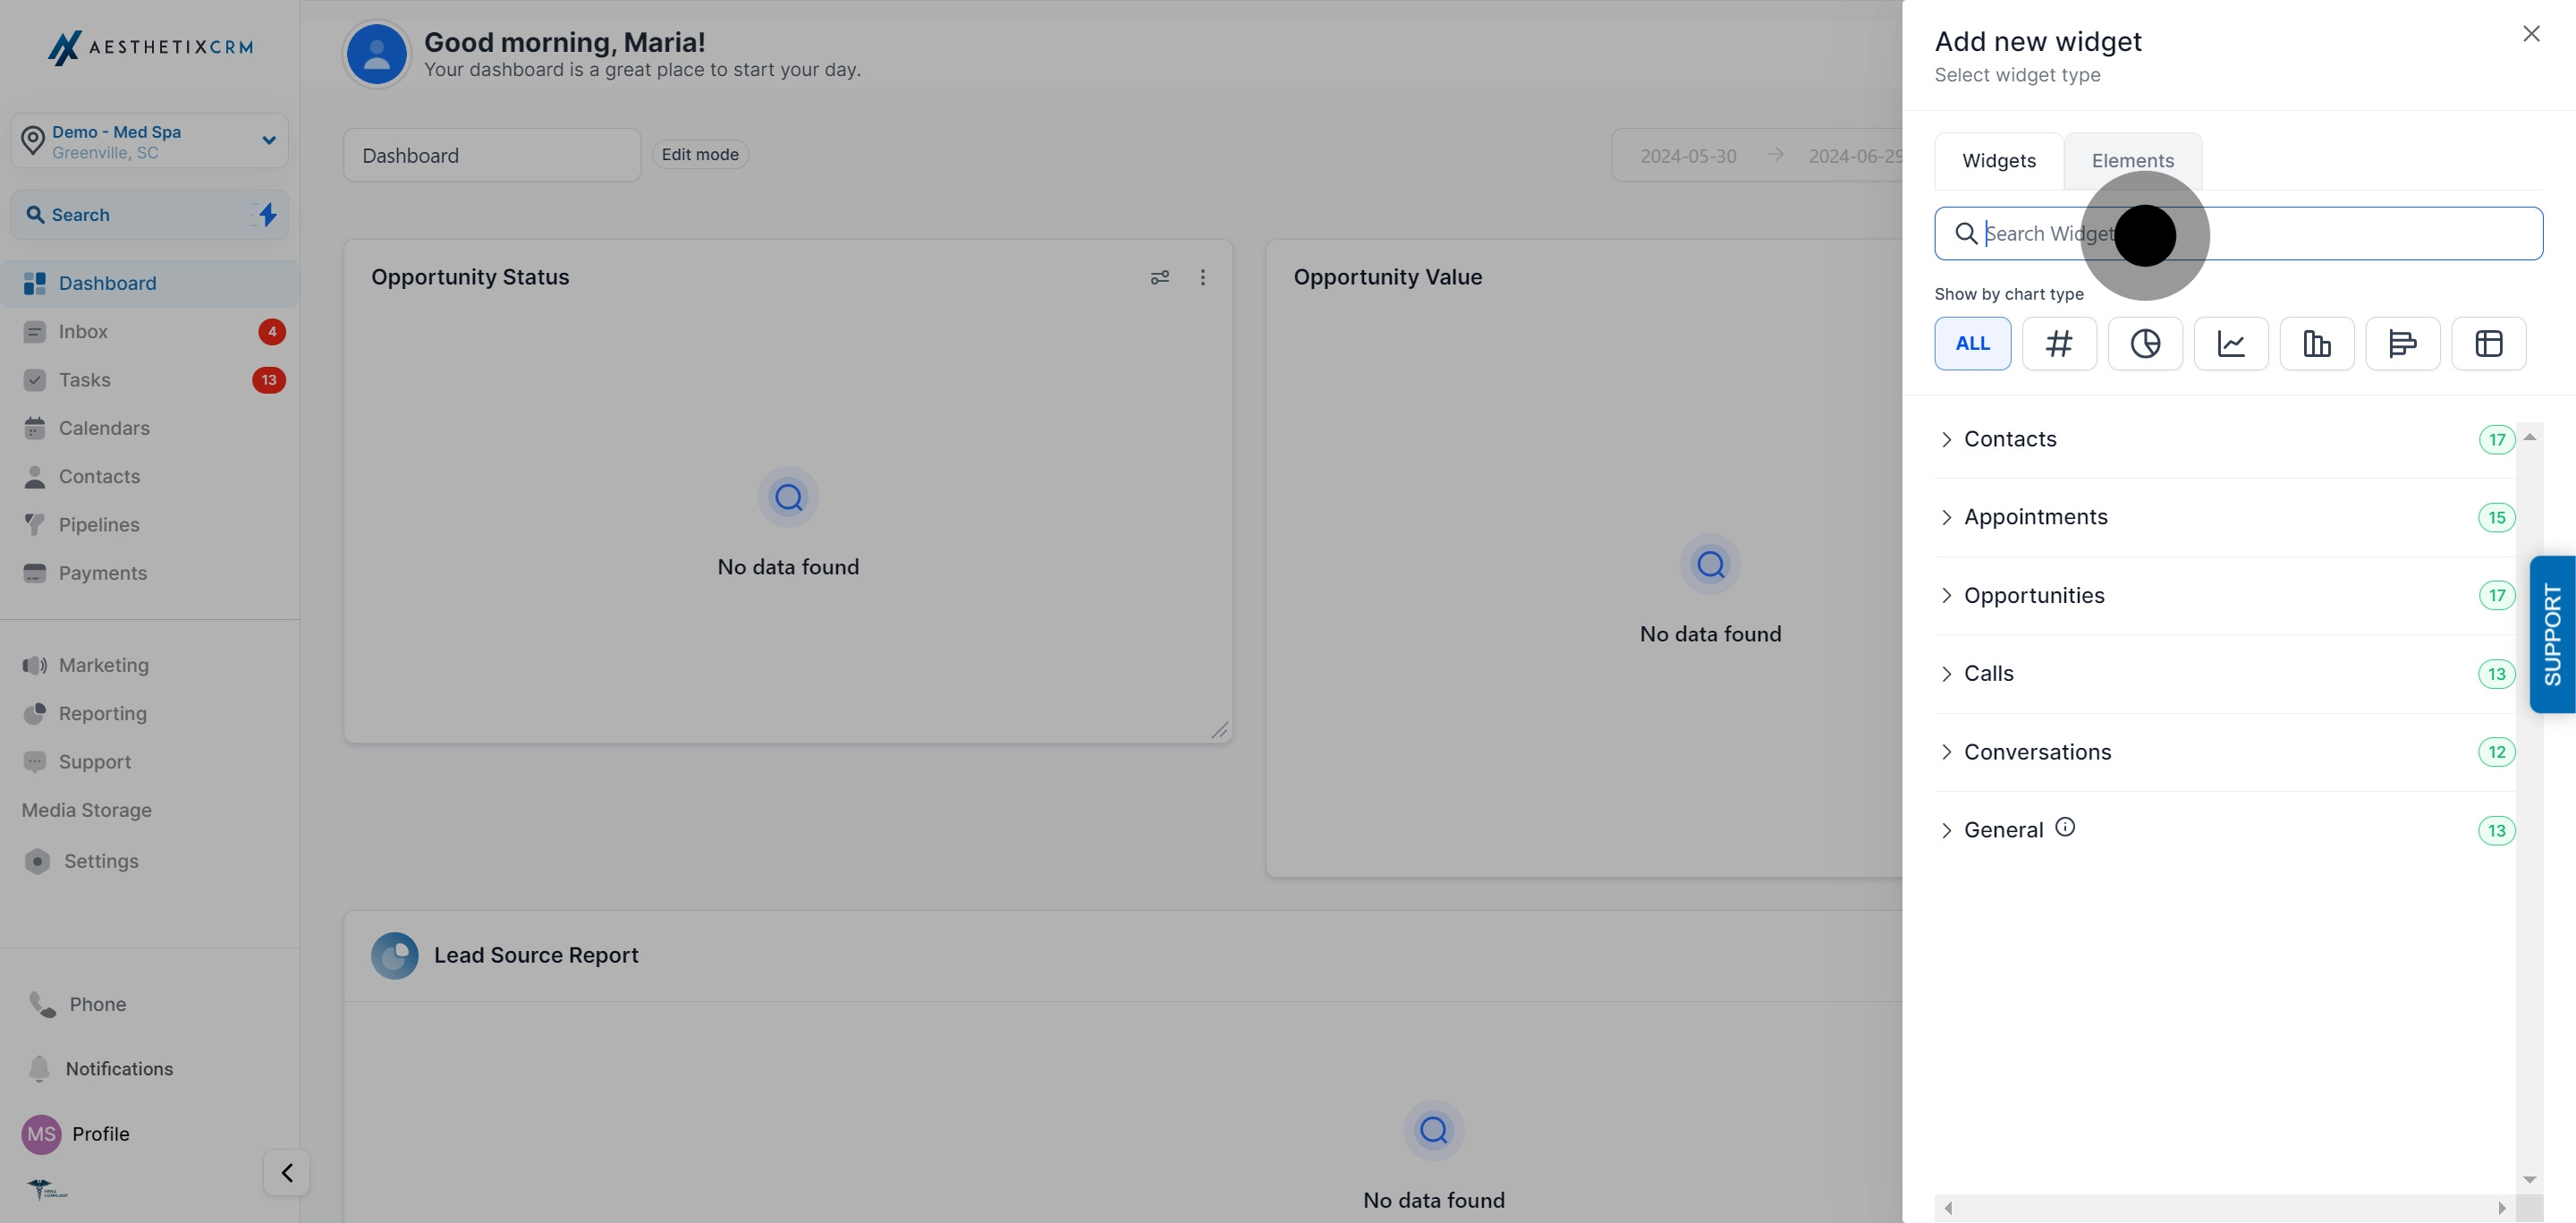
Choose the widget you want to add from the list.
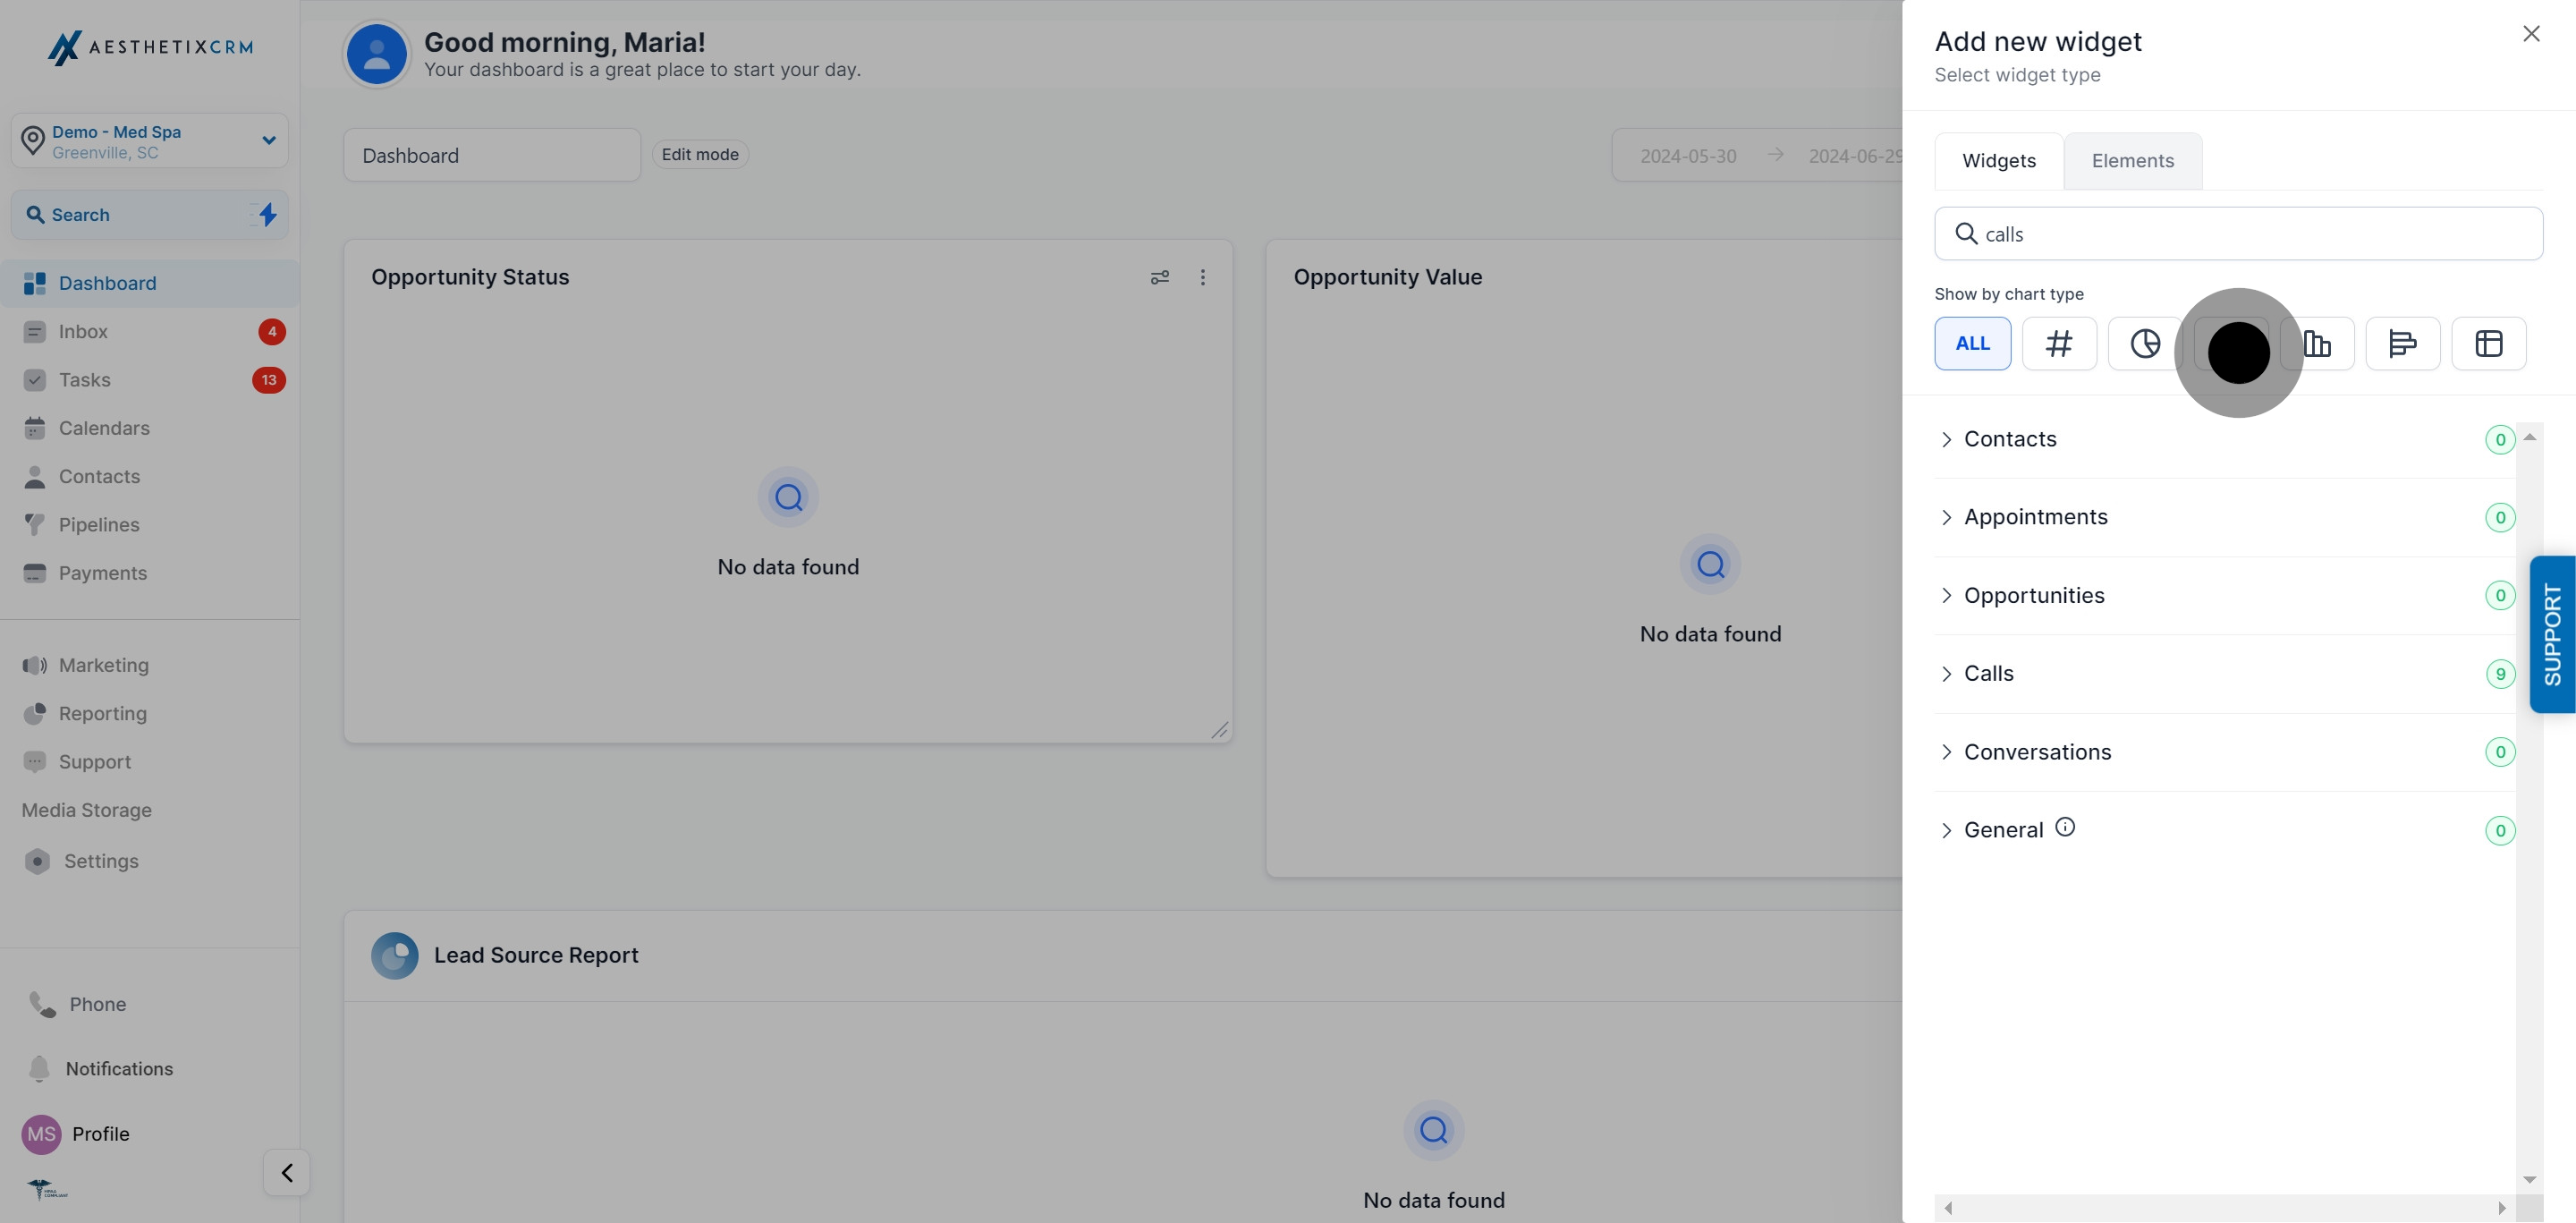
Change the chart type by clicking on the chart icon and selecting the visualization that best fits your data (bar, line, pie, and so on).
Configure the widget's settings (title, metrics, date range, and more; see the reference table below for what each field controls).
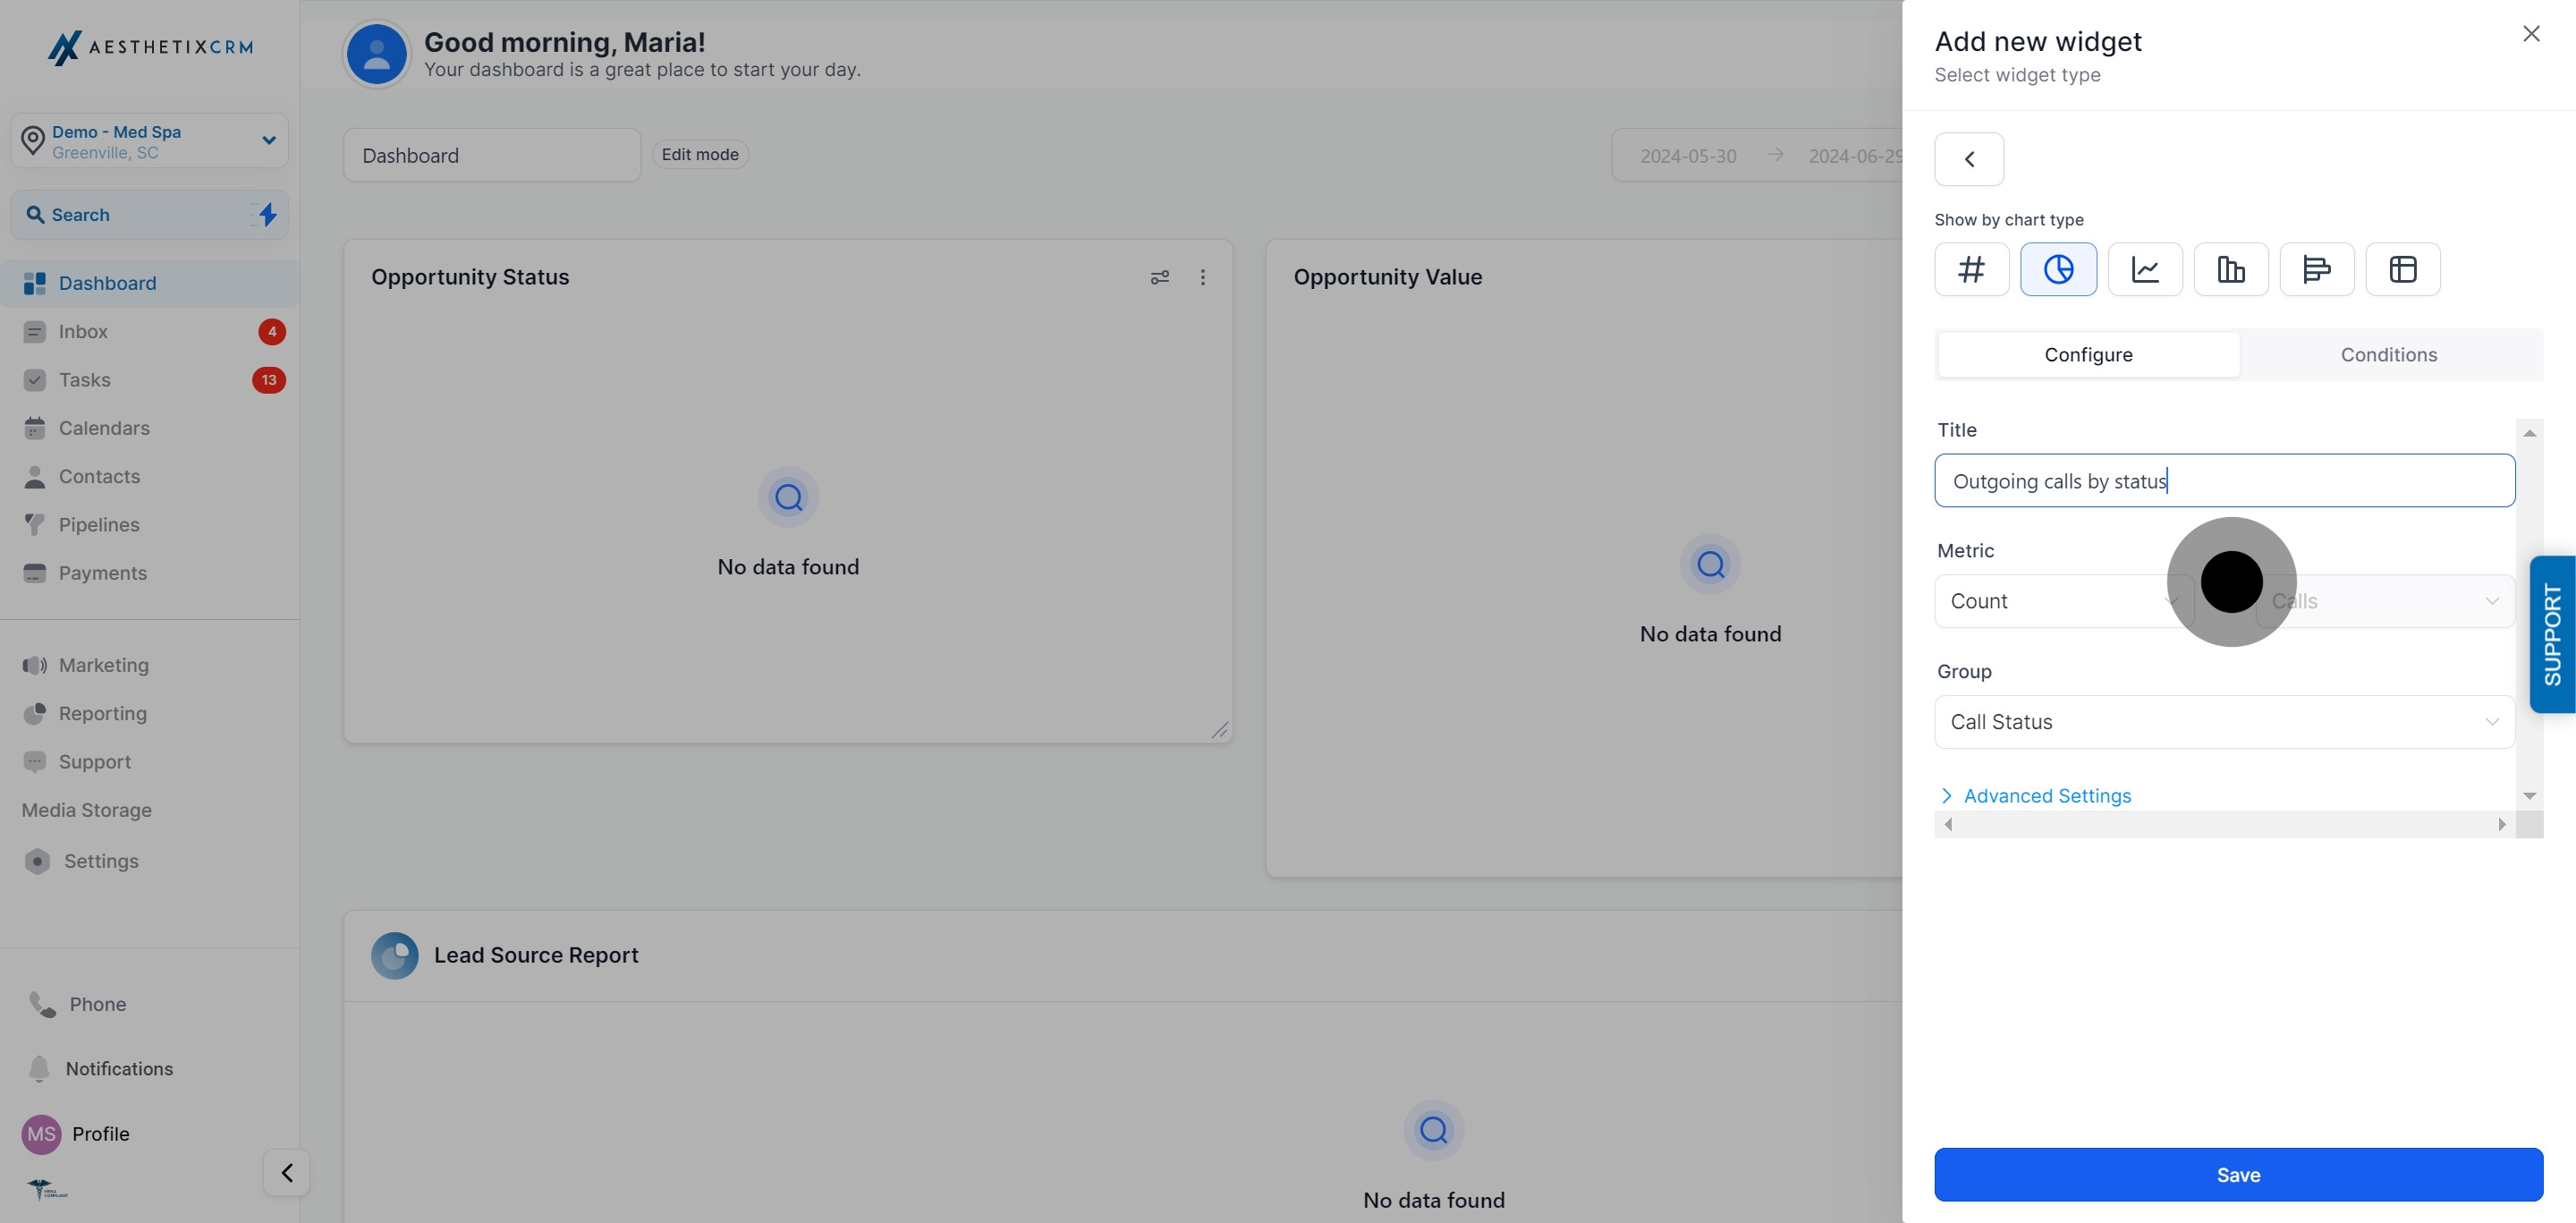
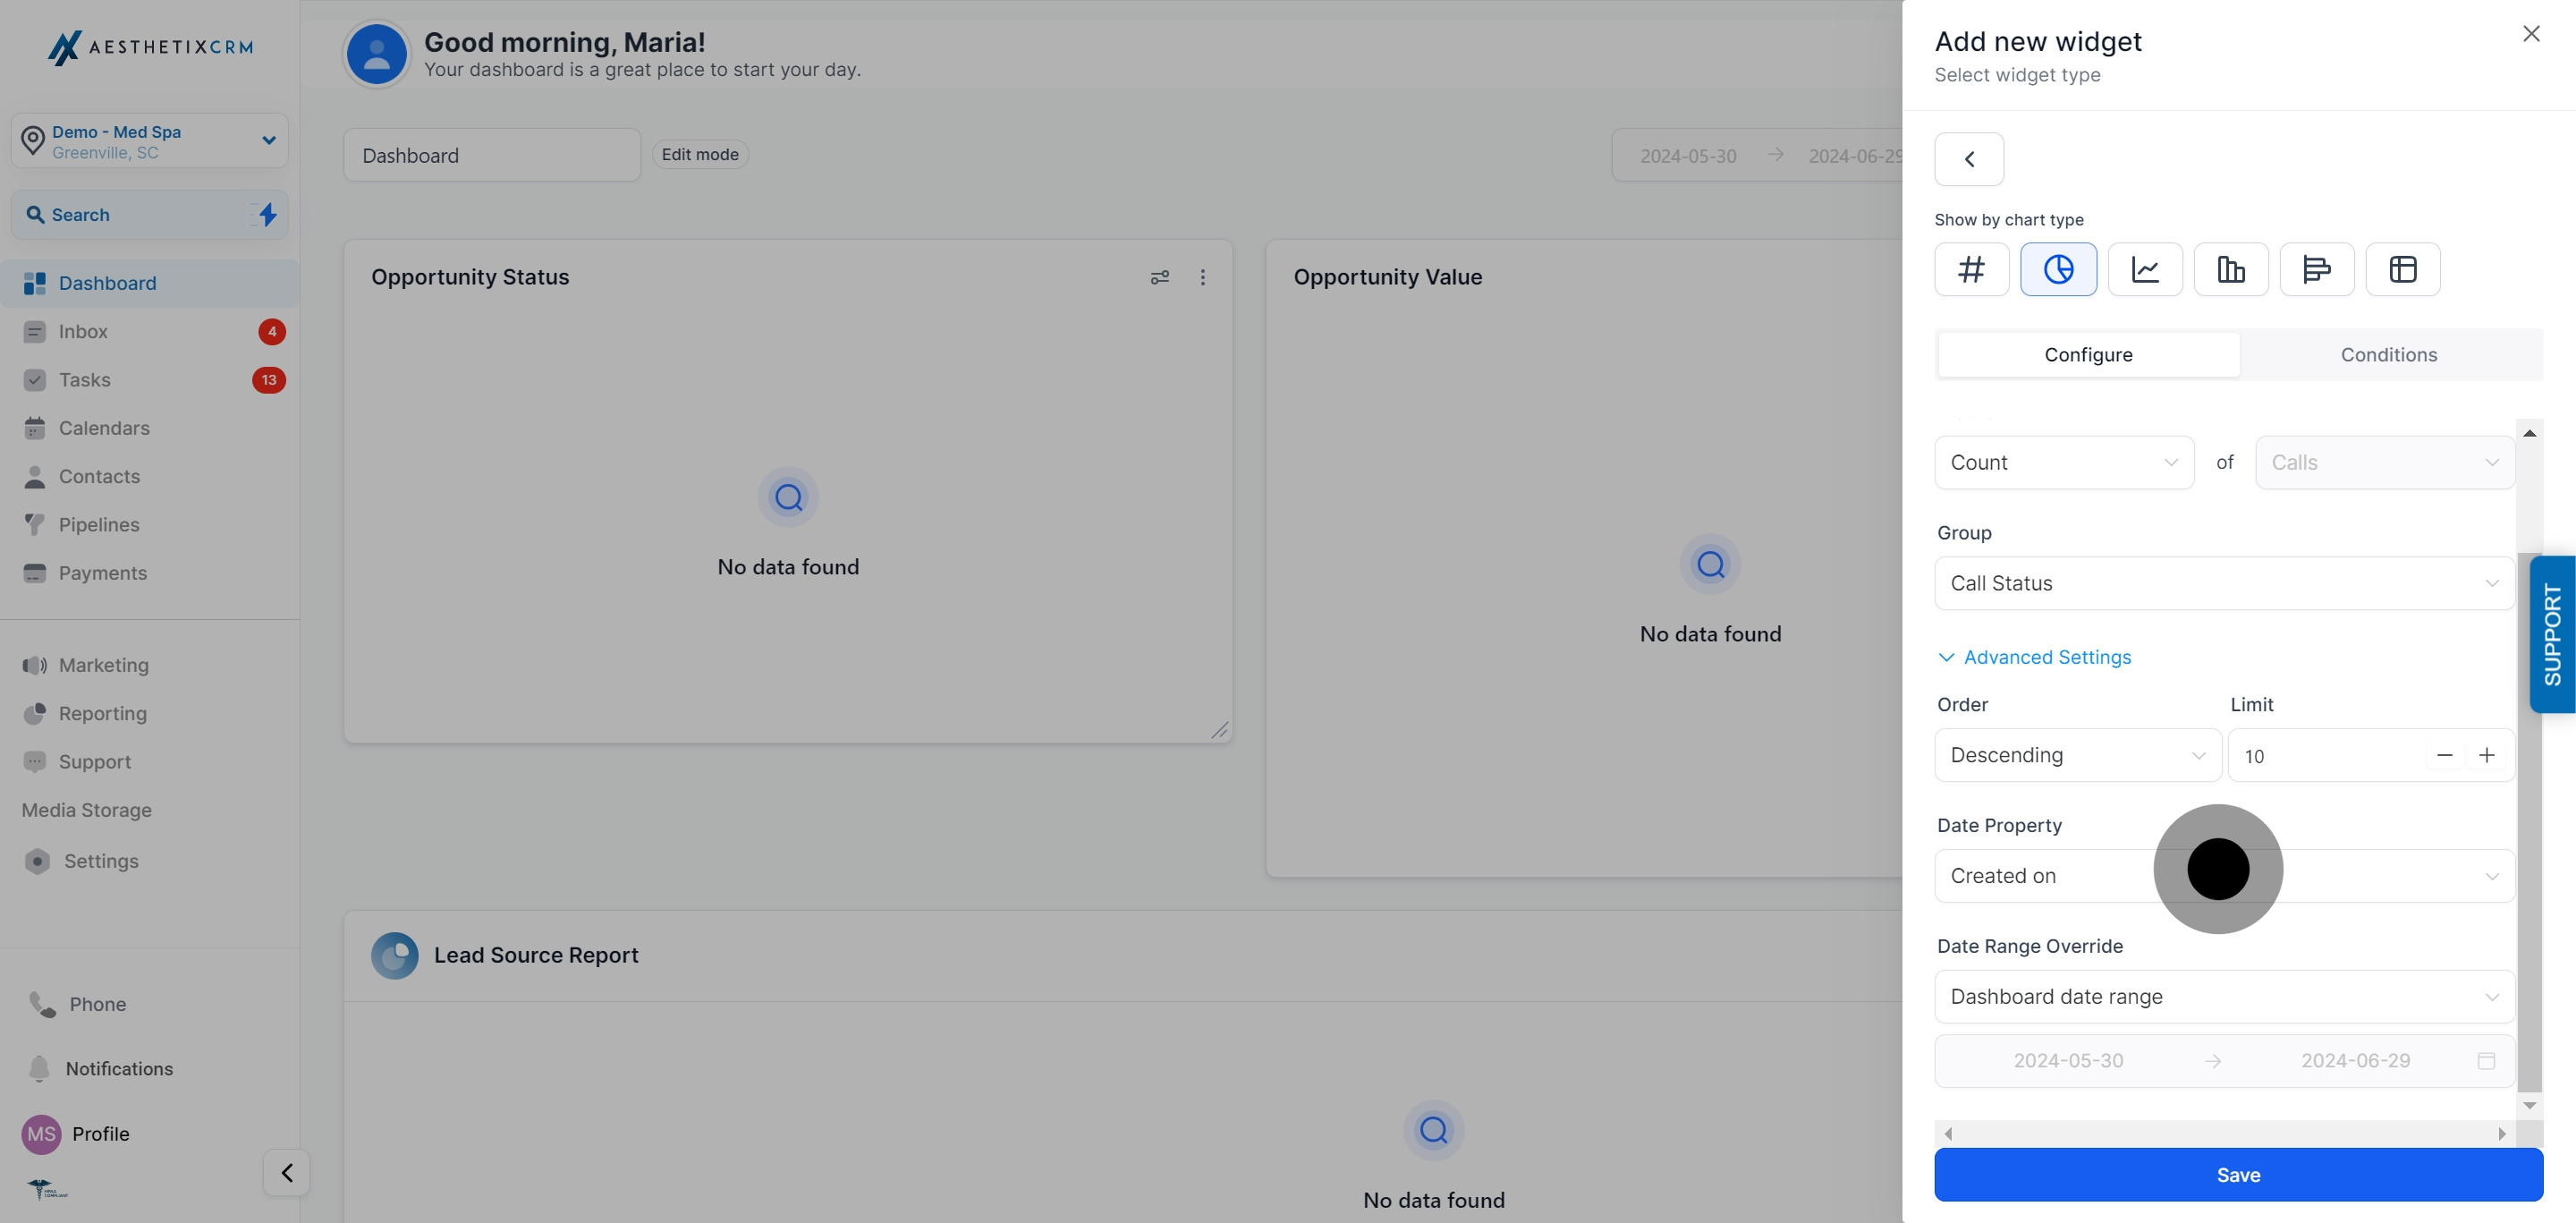
Open Advanced Settings if you want extra personalization. These are optional and aren't required to create a widget.
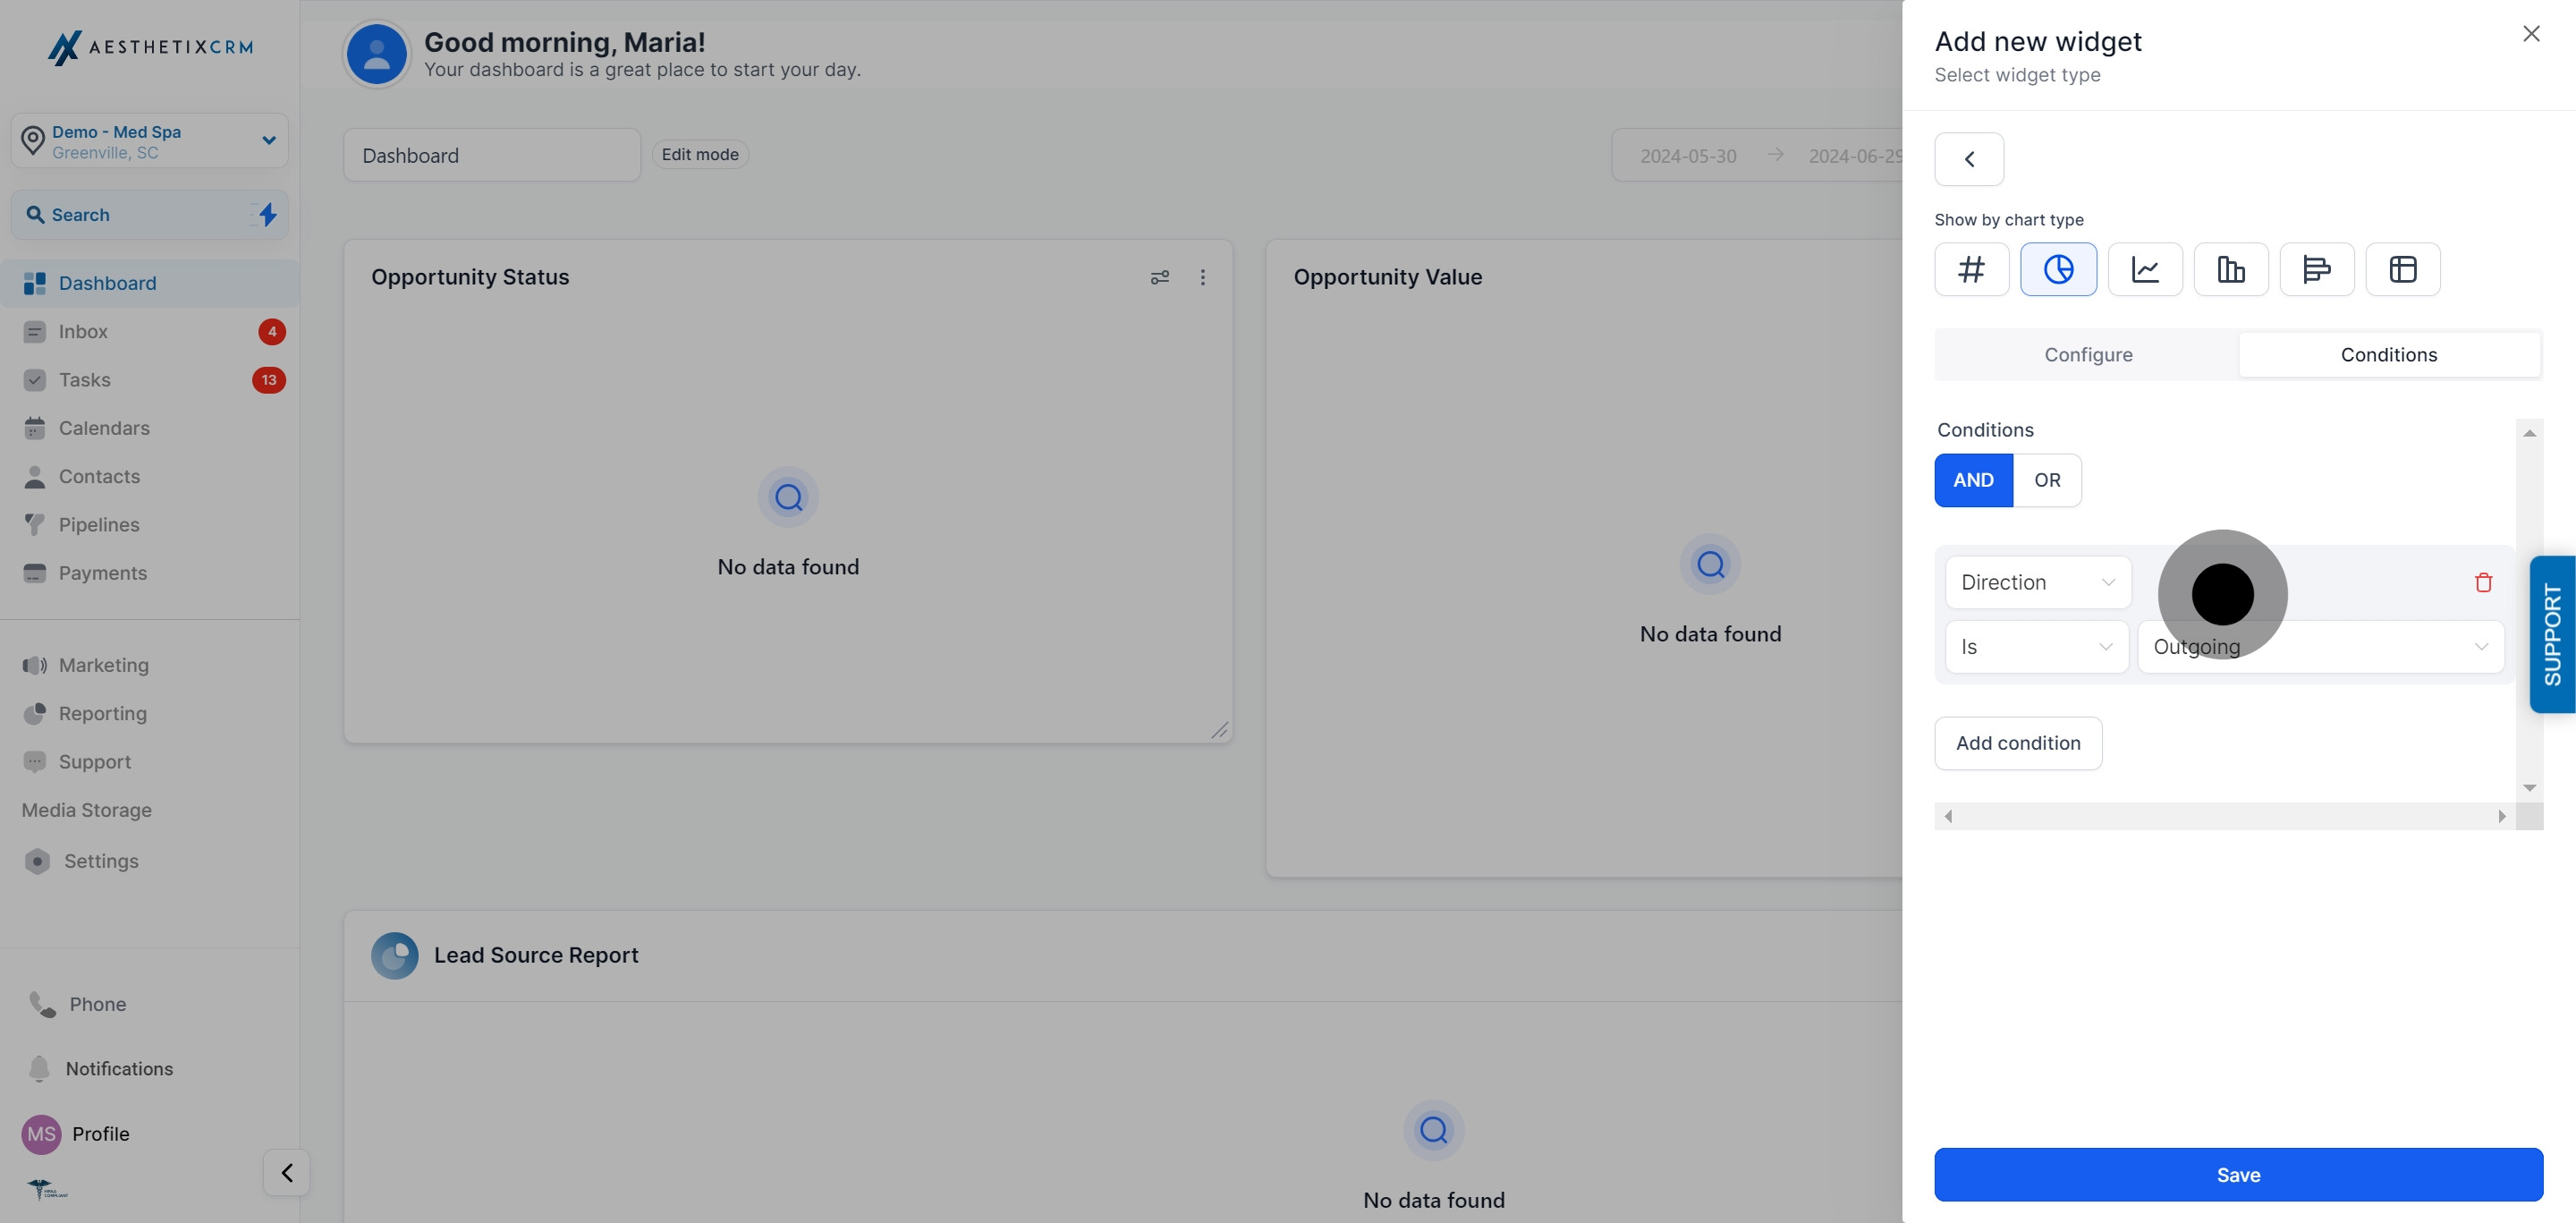
Add conditions (filters) to narrow the widget down to the exact data you want to see.

If no data matches a filter you've added, Aesthetix CRM won't let you save the widget. Either delete that filter from the condition or change it so it matches real data.
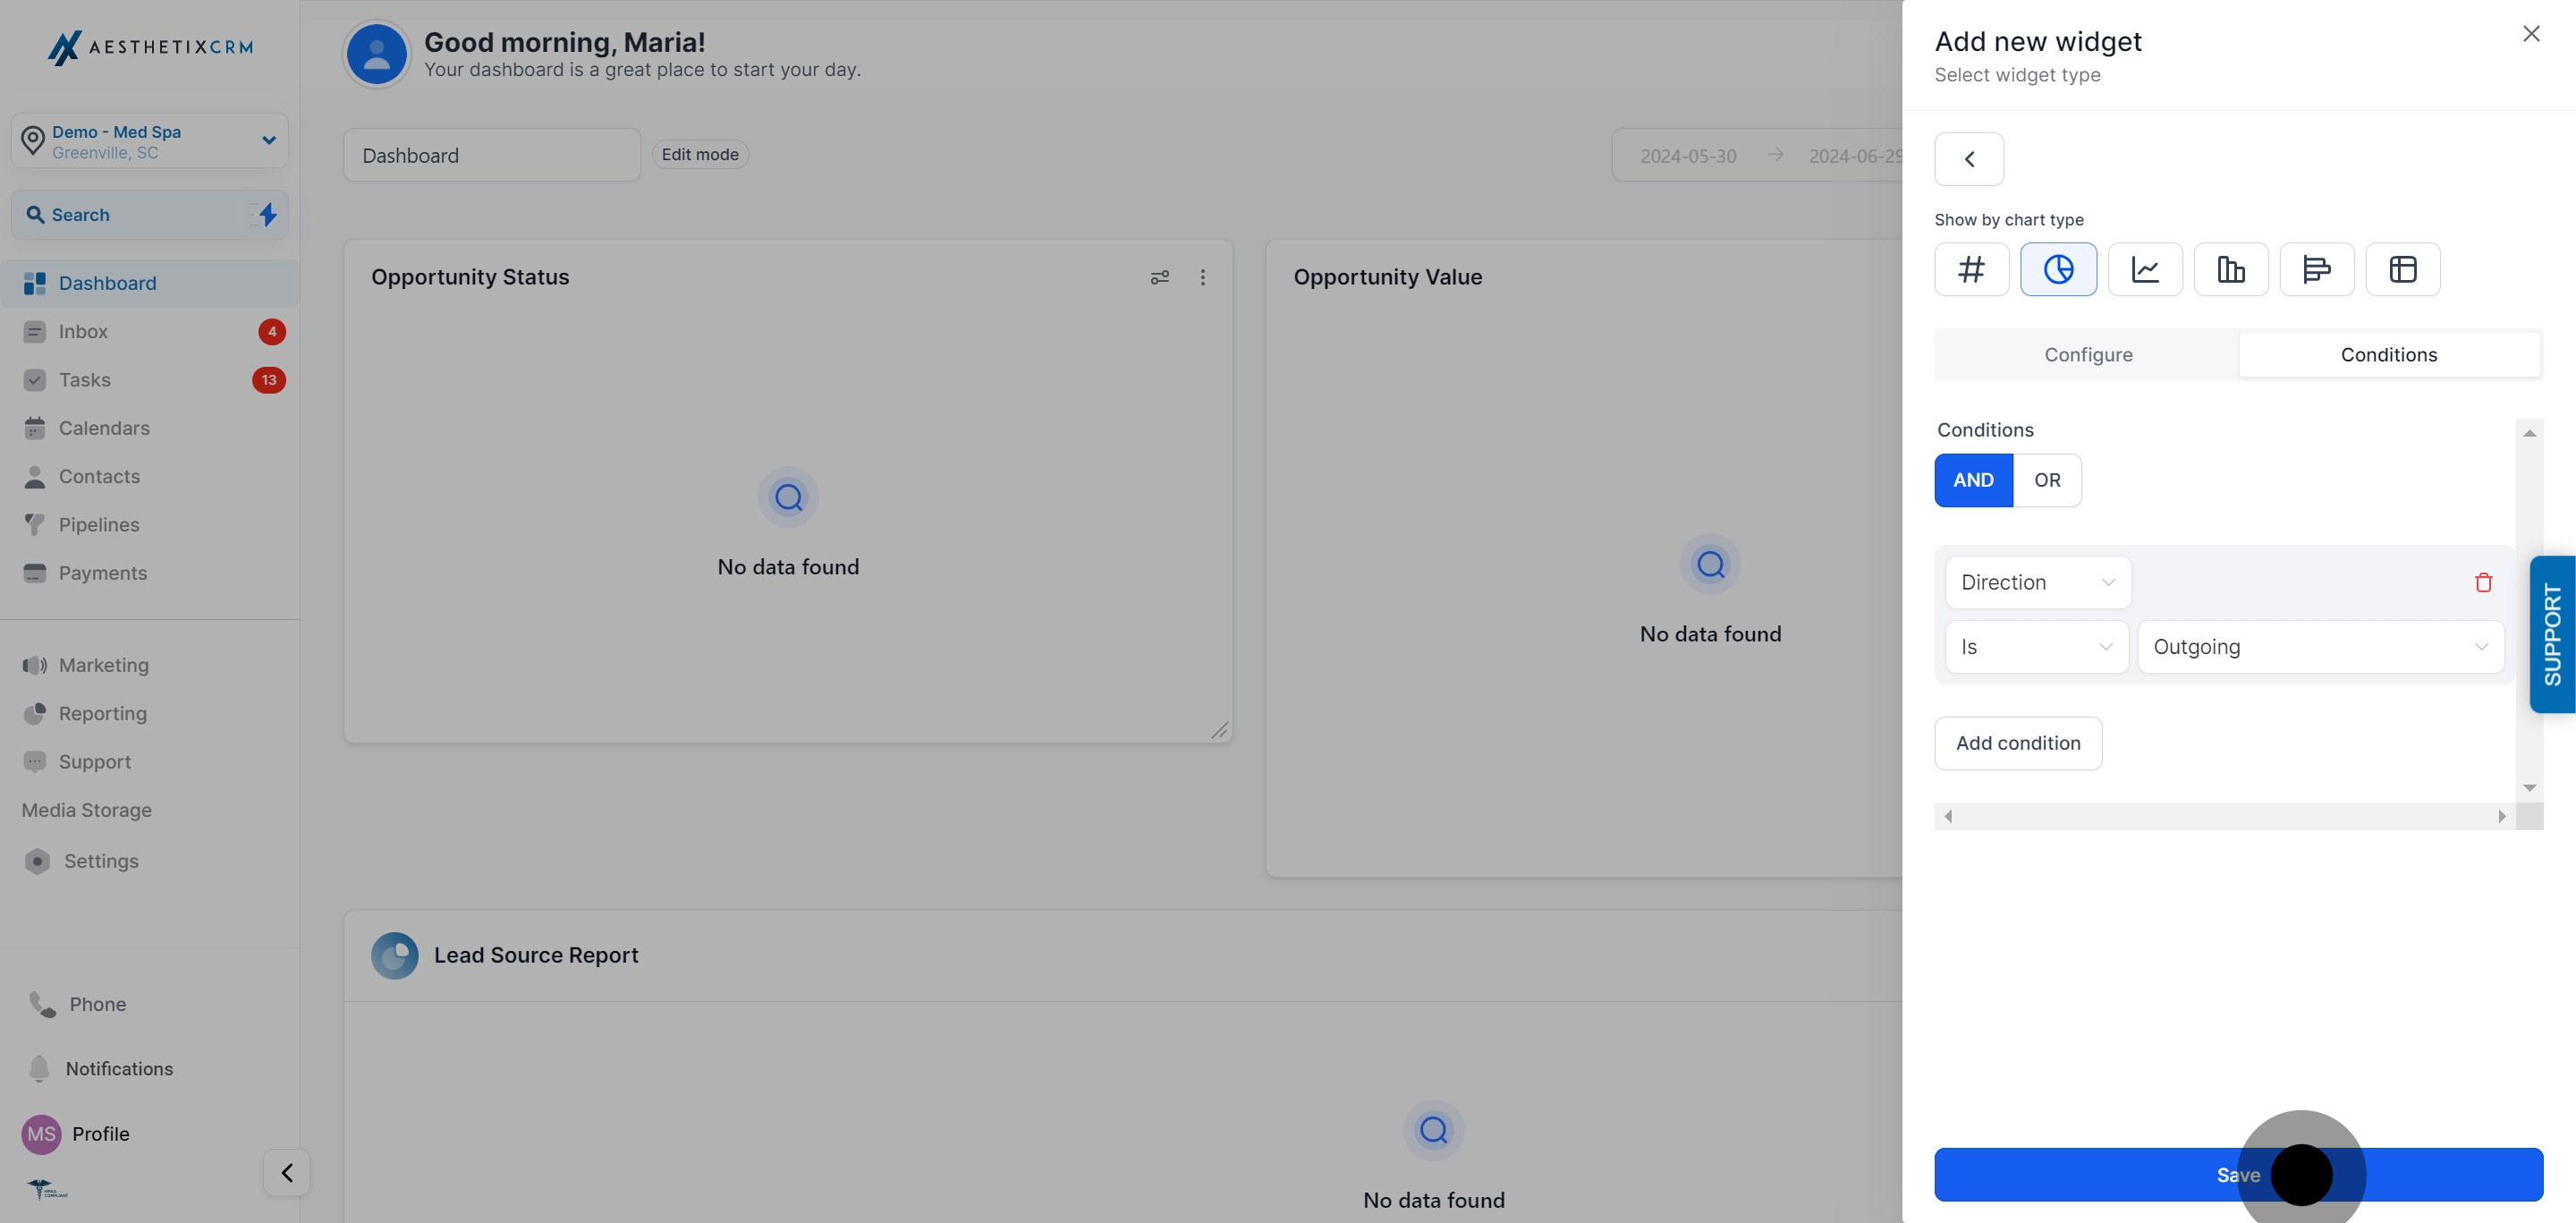
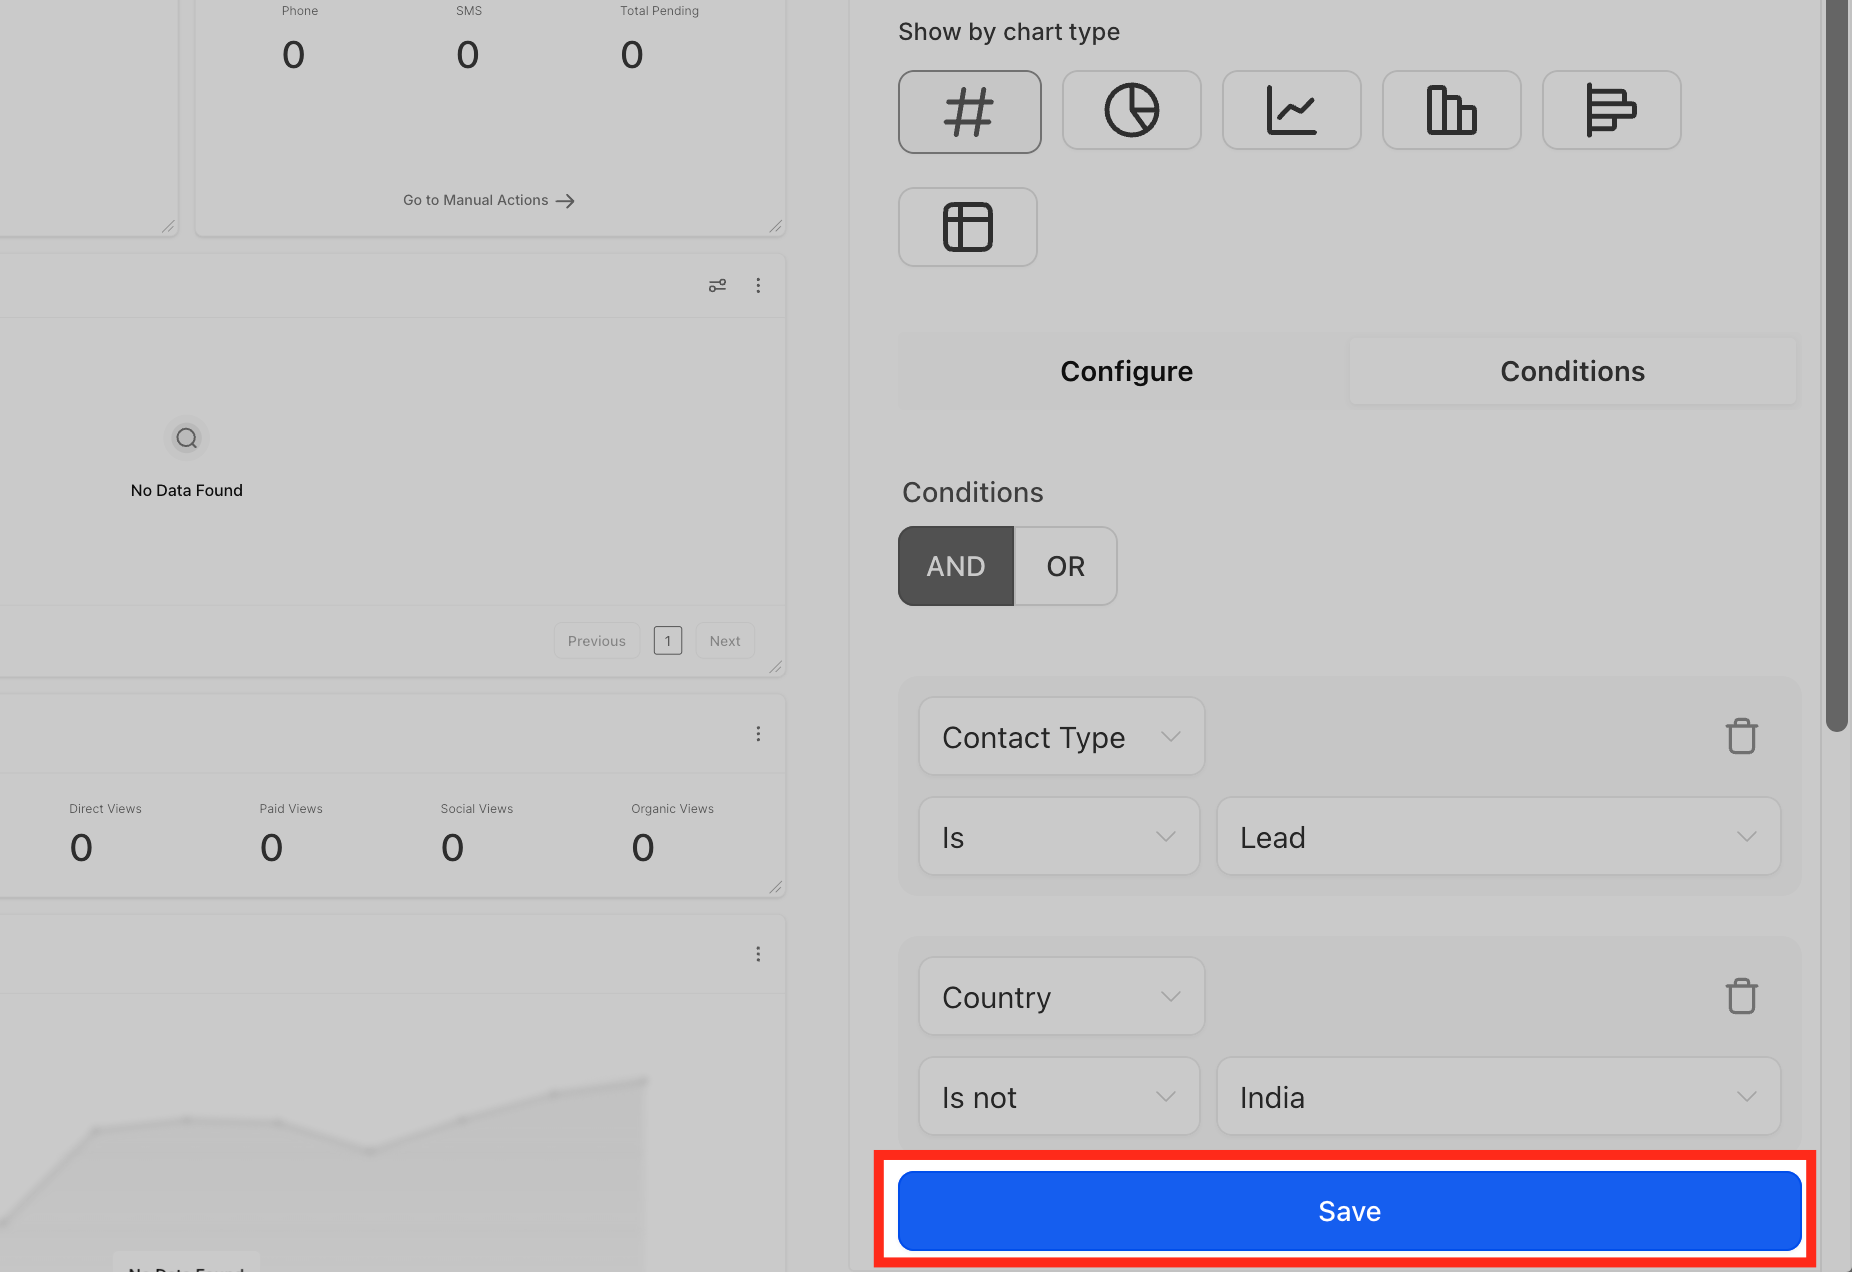
Click Save to save the widget's settings.
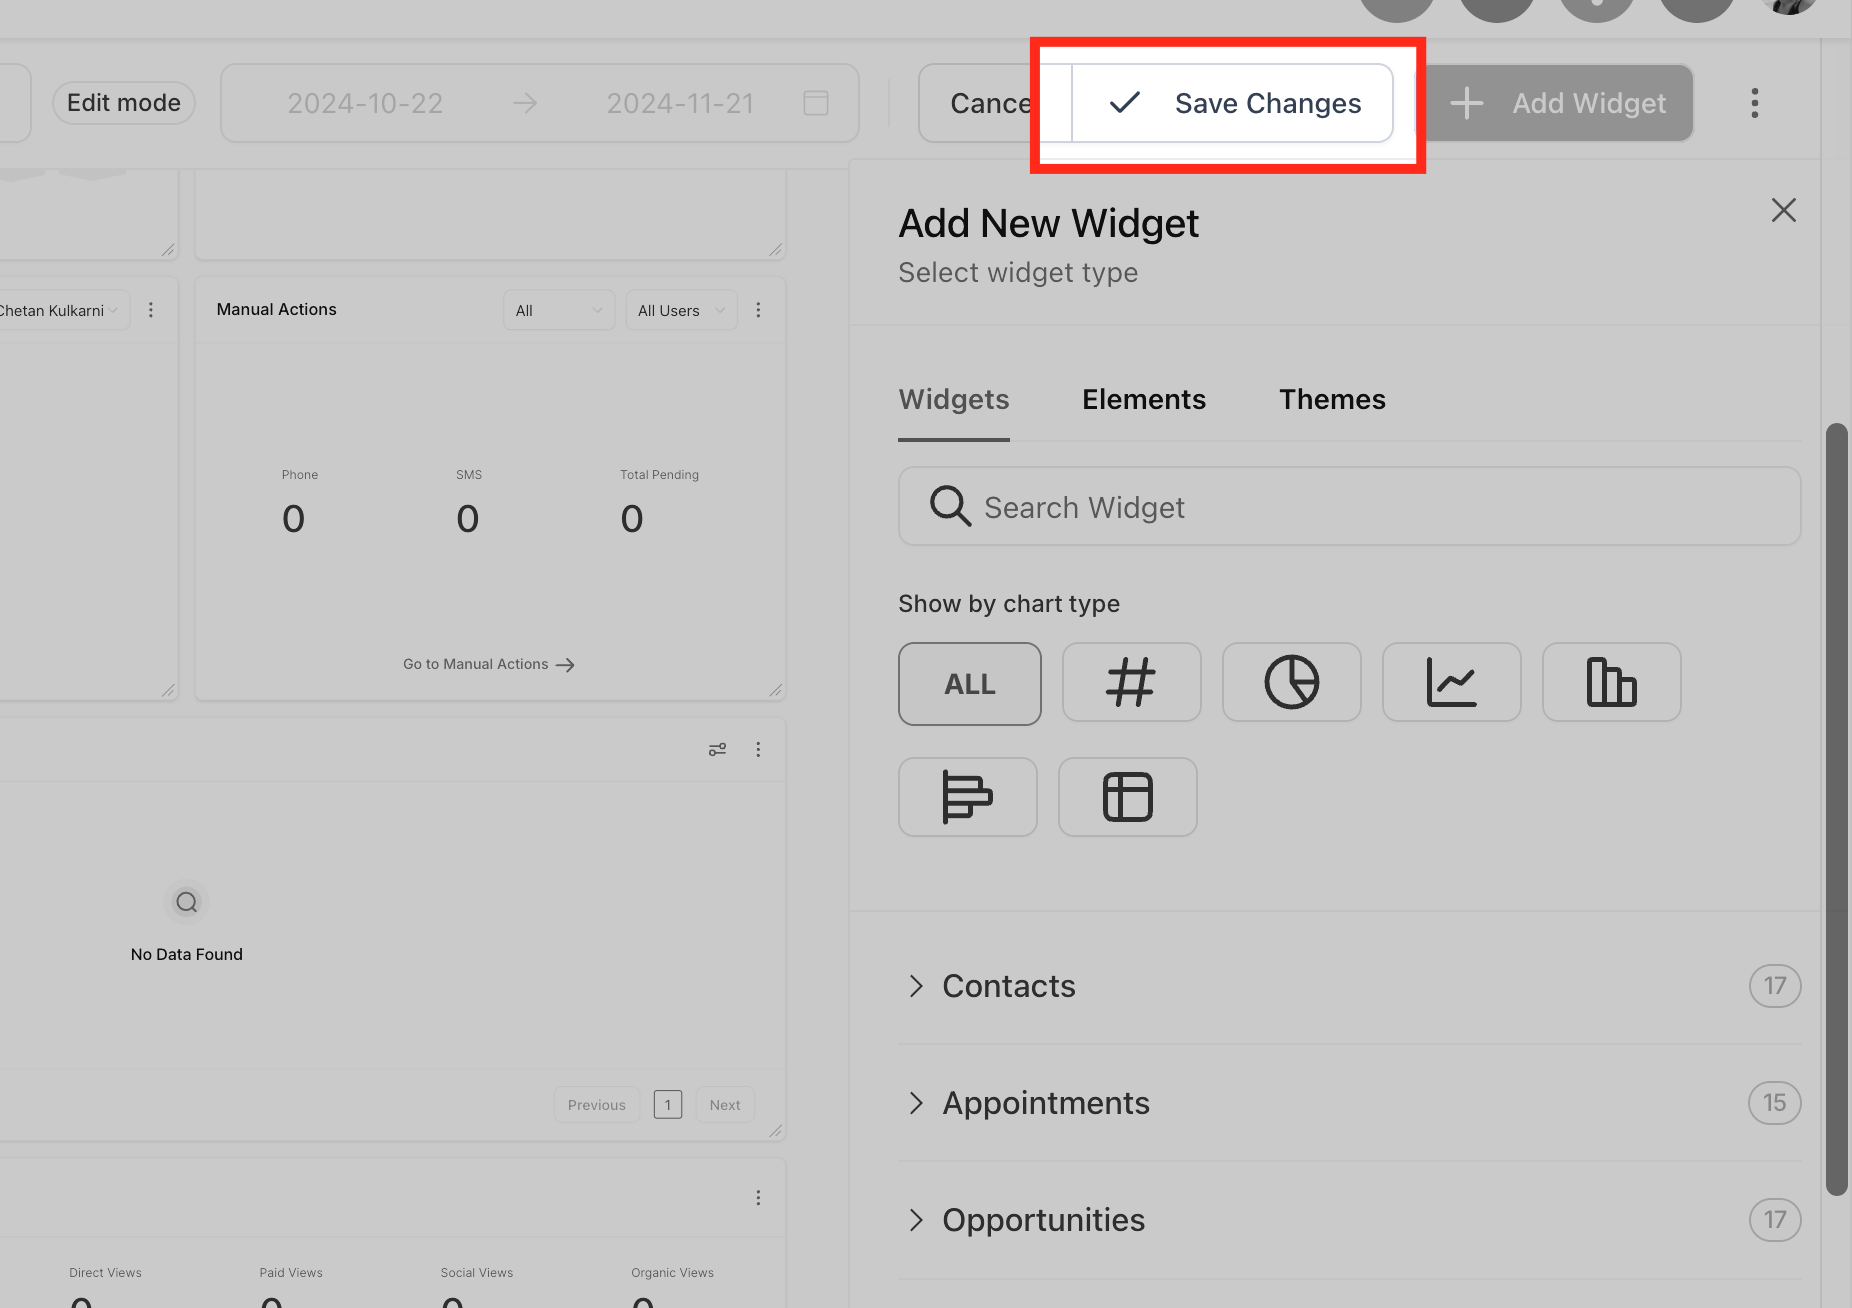
The widget now appears on your dashboard. Drag to reposition it or resize it as needed, then click Save Changes once you're happy with its size and placement on the dashboard.
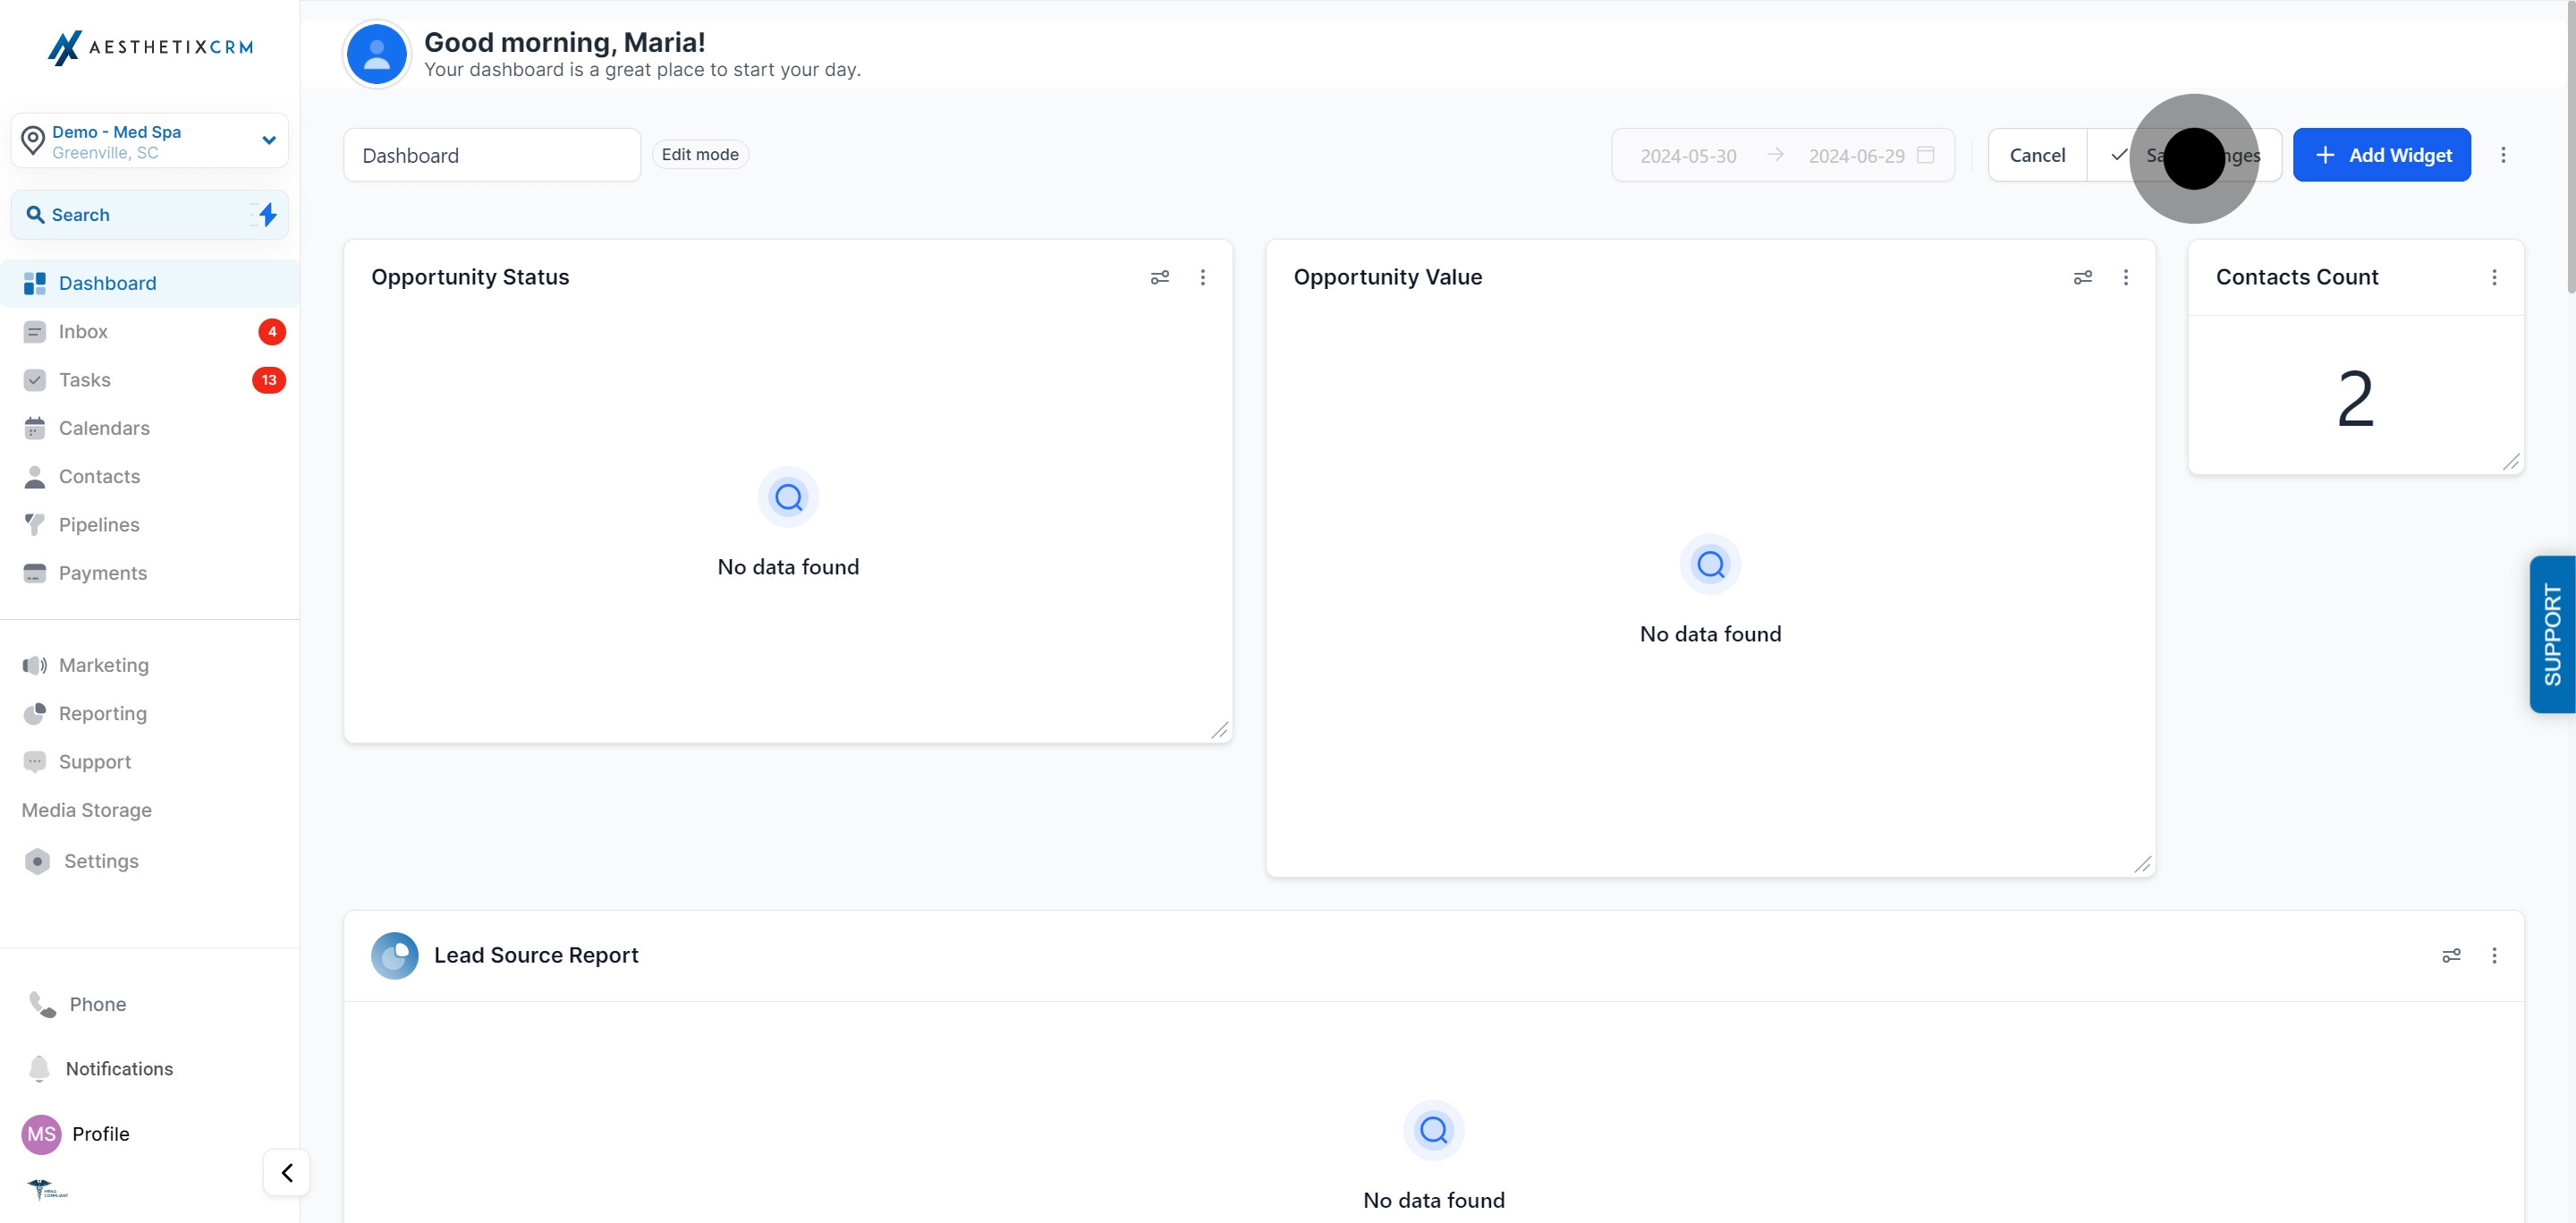
Already have a widget on your dashboard and just need to adjust it? Editing is a shorter path than building a new one:
From your Dashboard, click into the dashboard you want to edit.
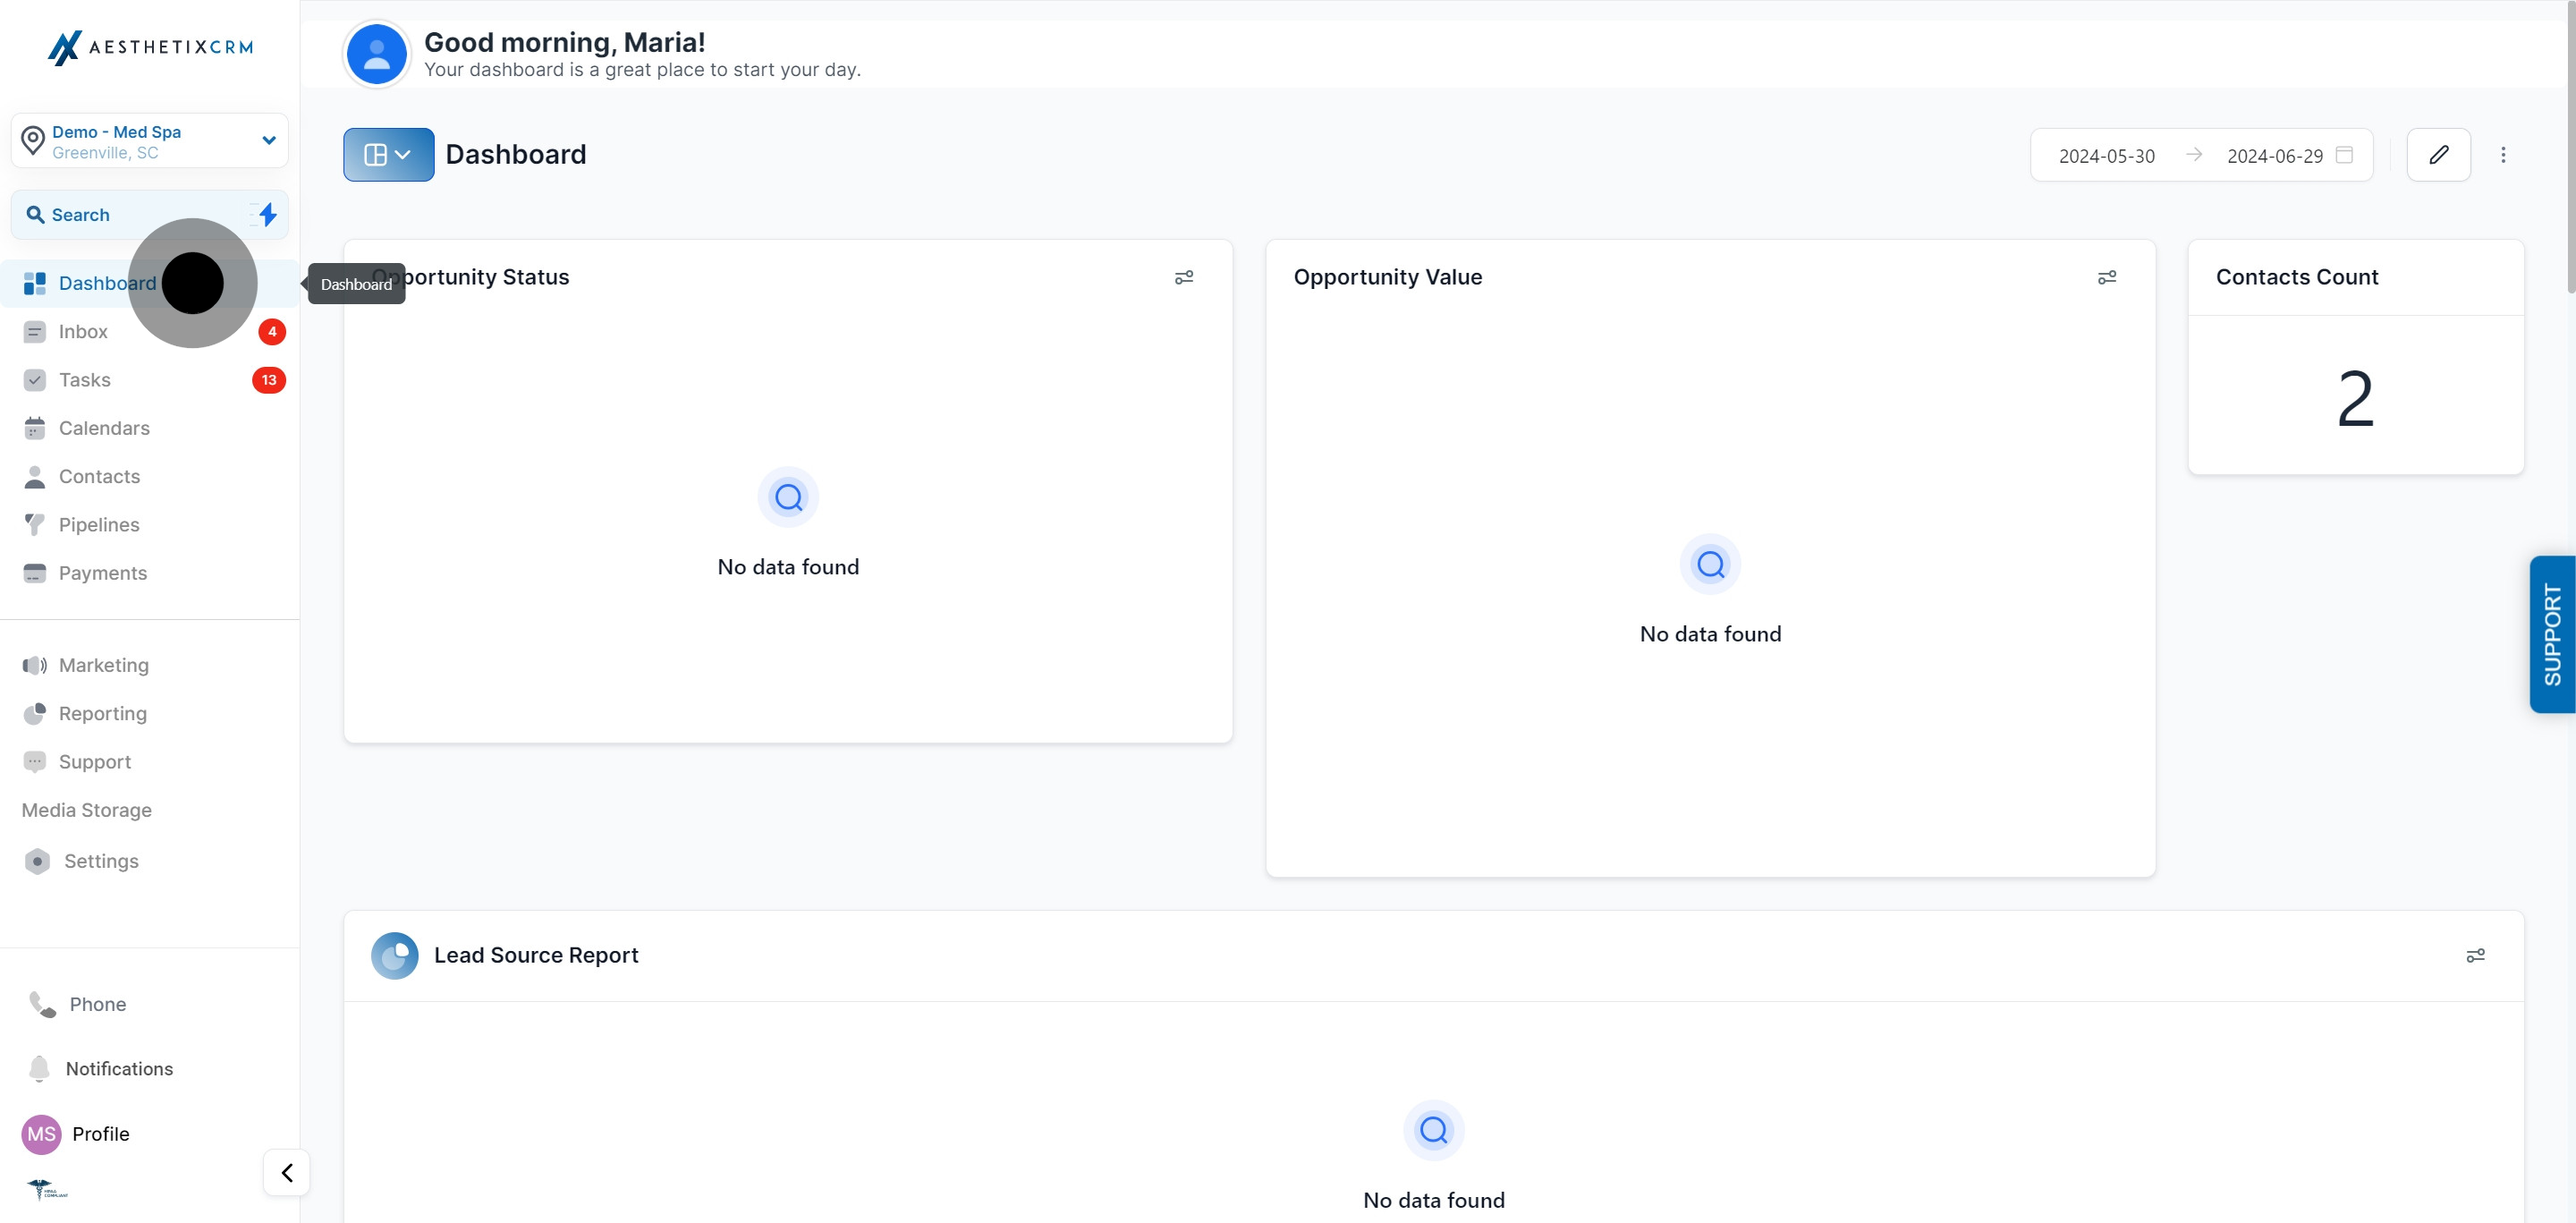
Click Edit Dashboard.
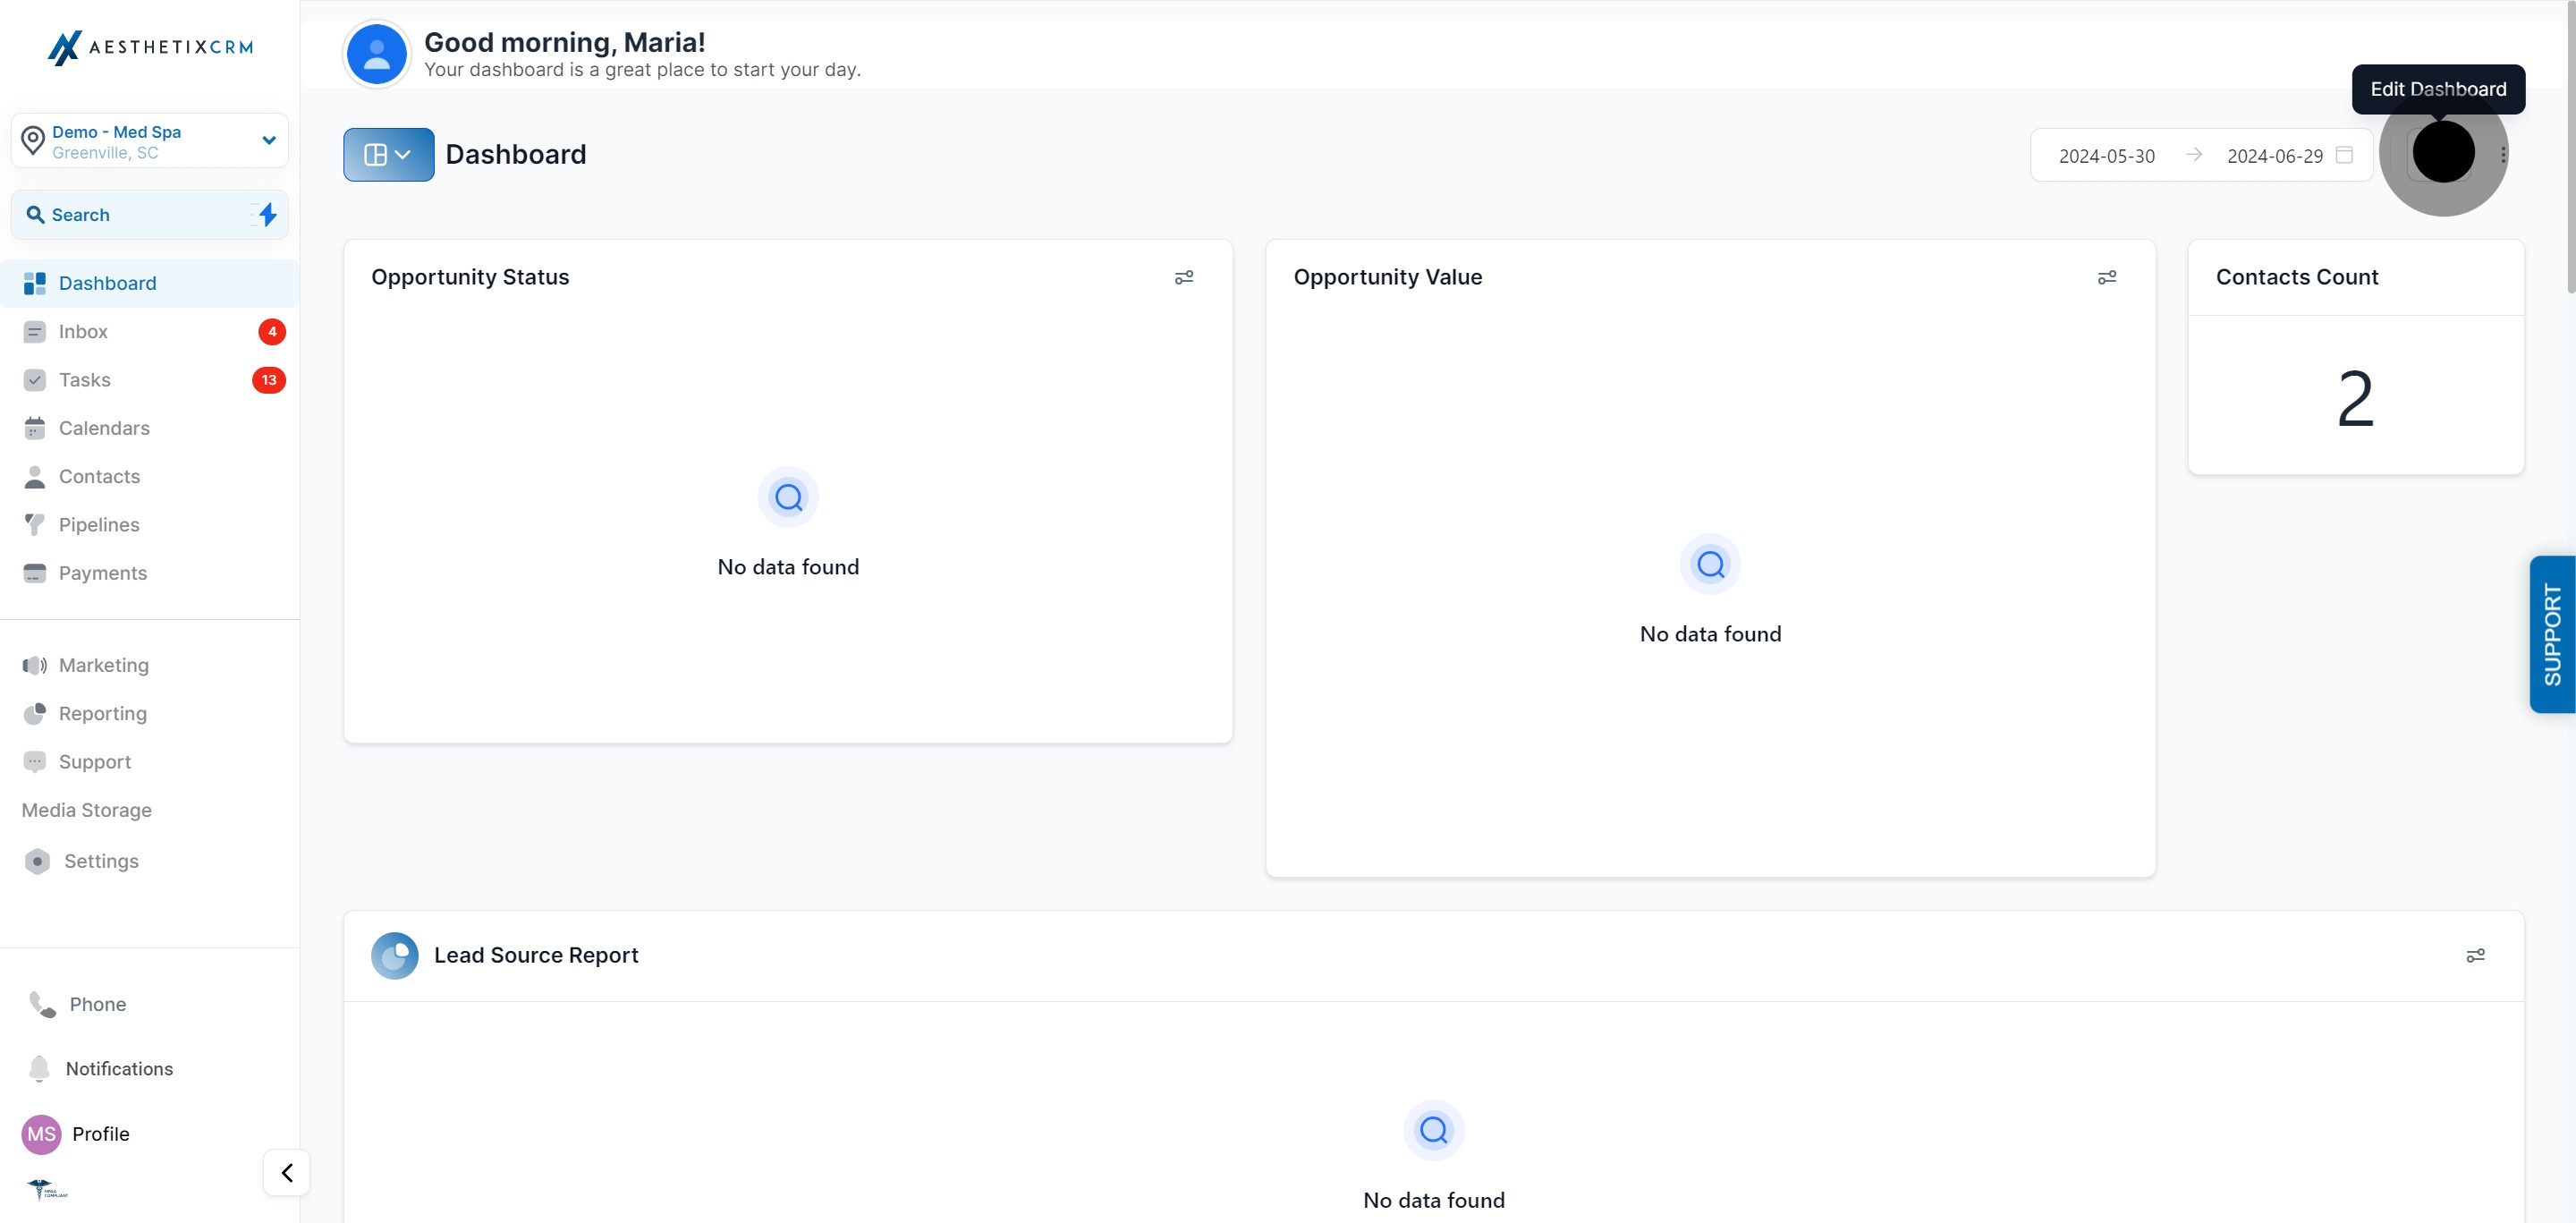
Find the widget you want to edit and click the three-dot menu in its top-right corner.
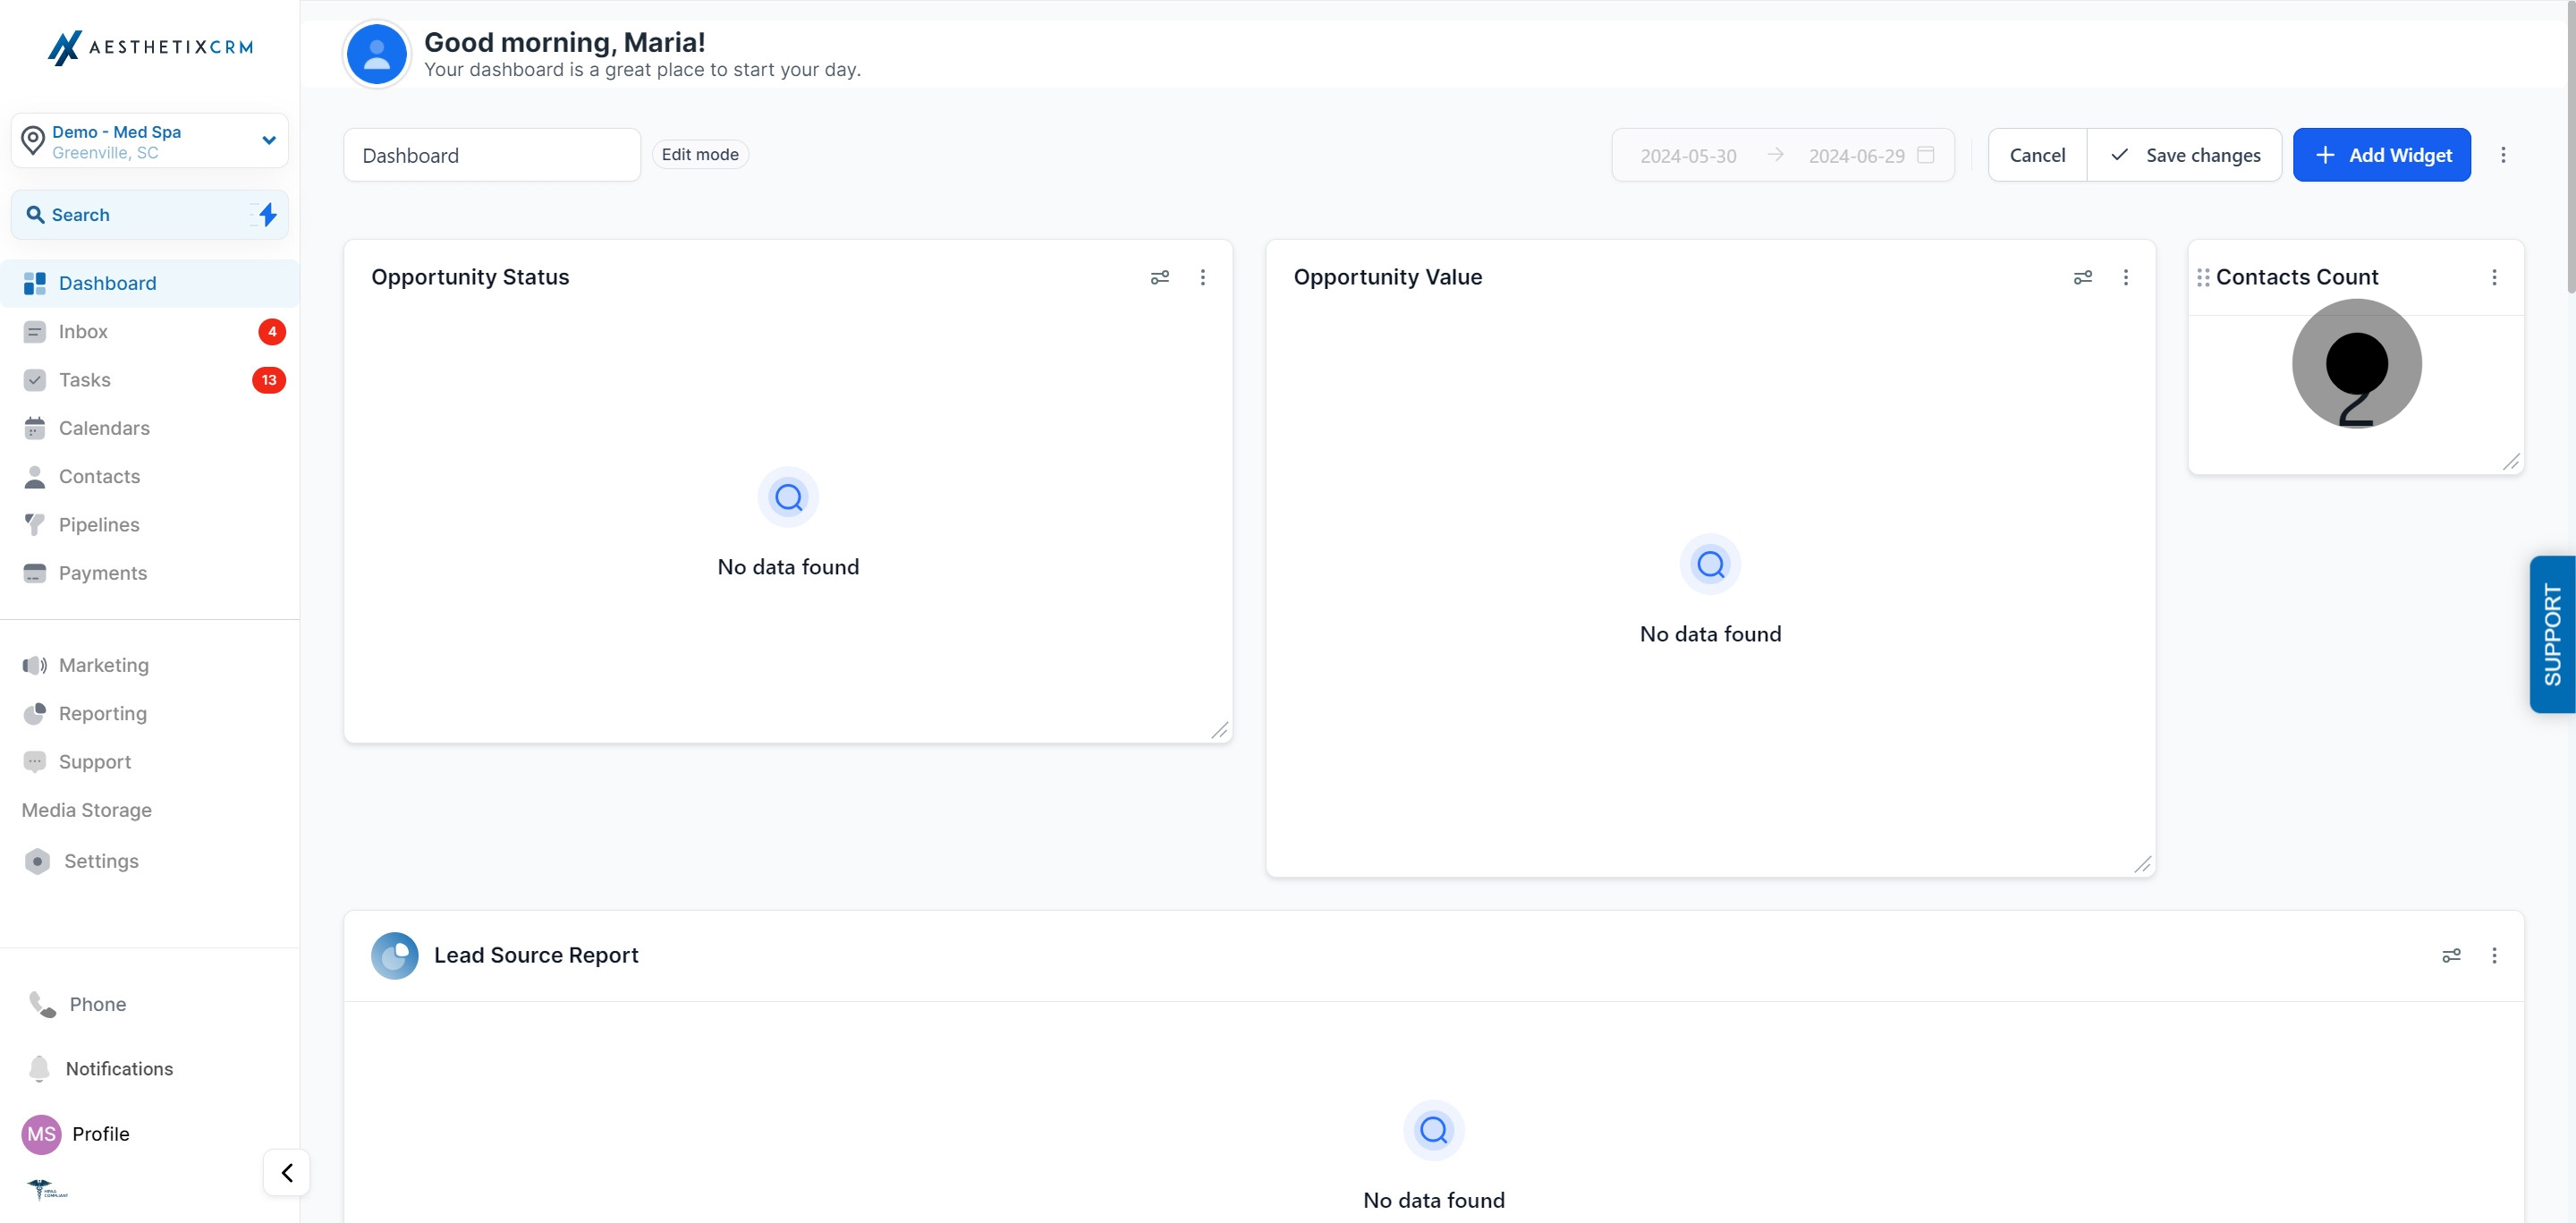
Select Edit from the dropdown menu. An editing panel opens on the right-hand side.
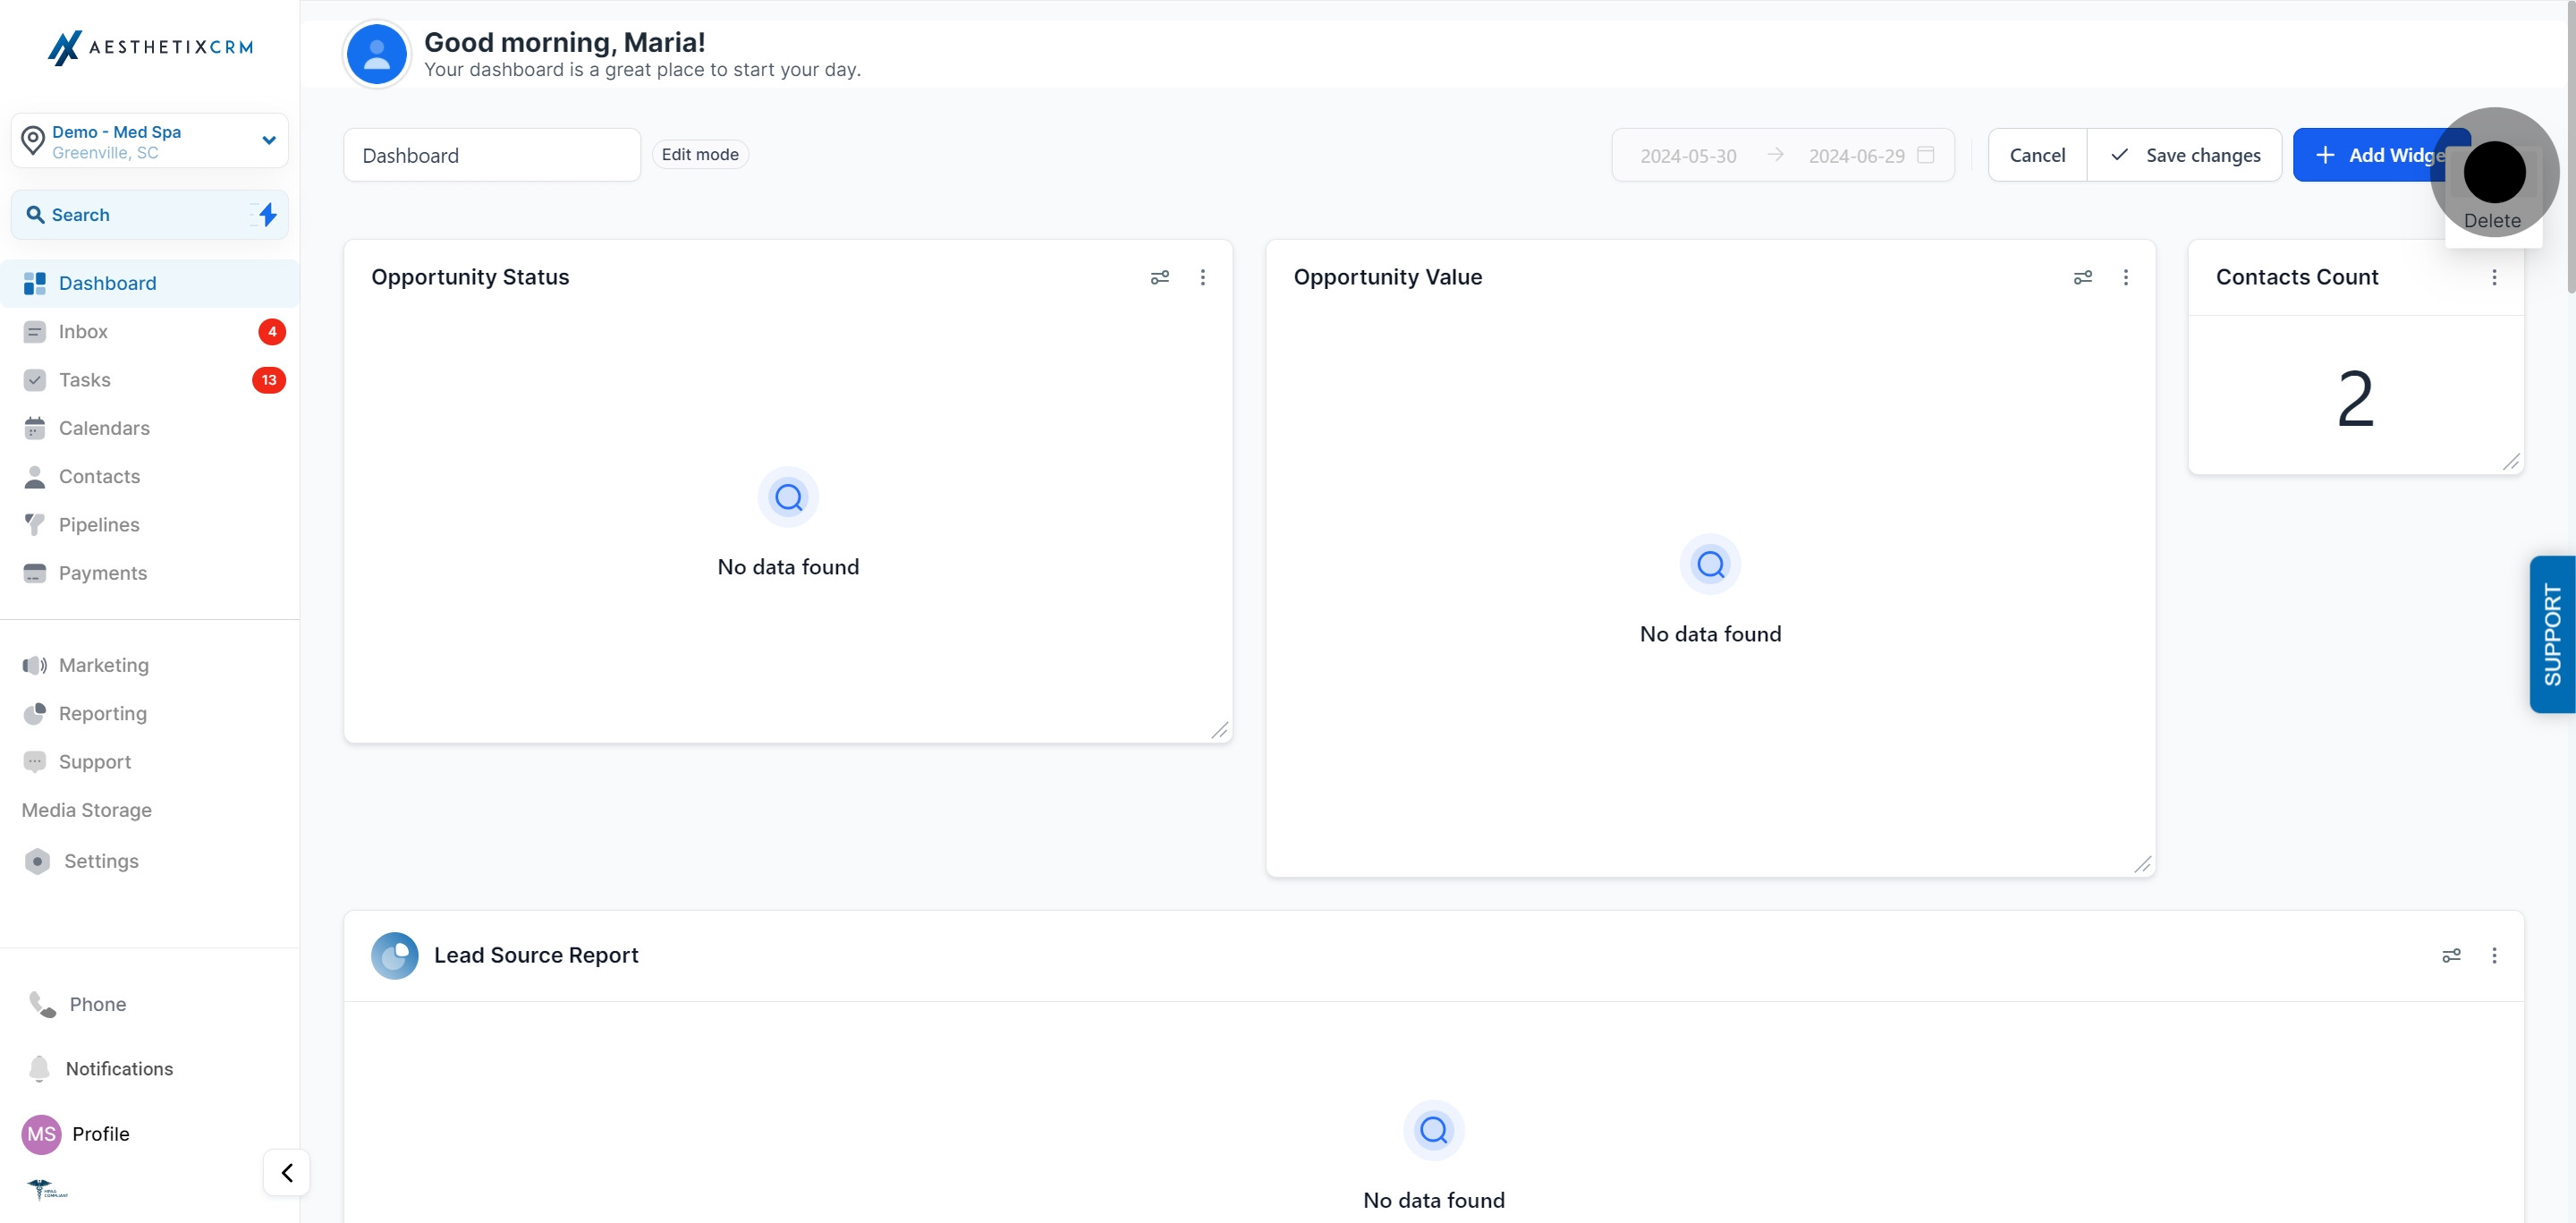
Apply your customizations in the editing panel (title, metrics, filters, chart type, and so on).
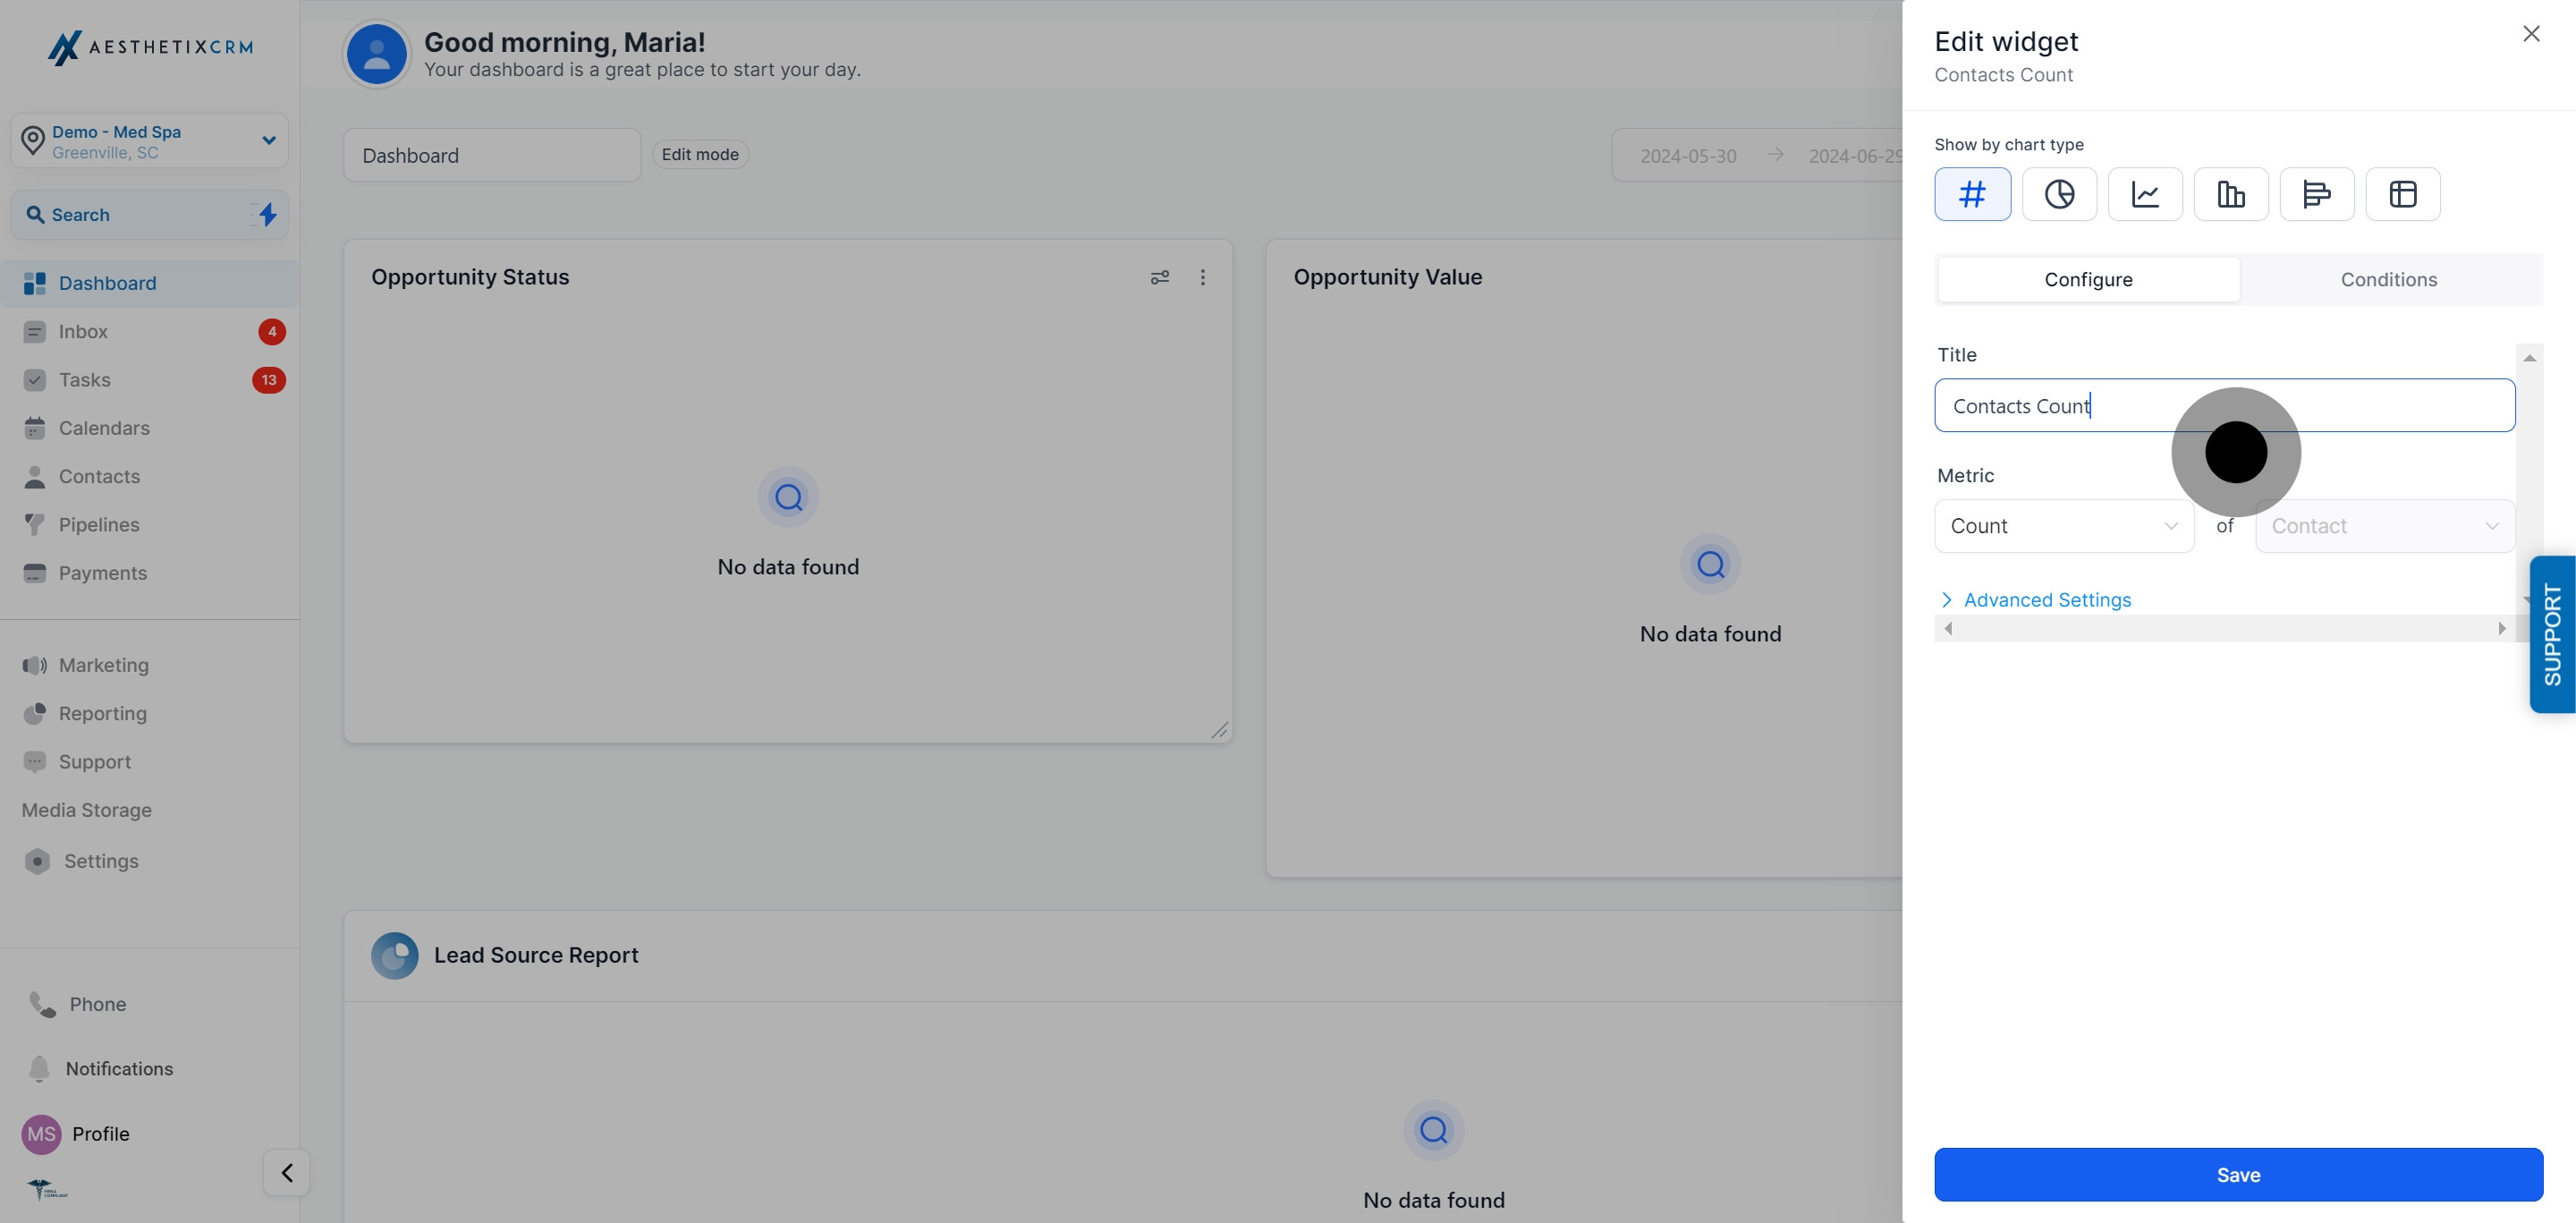
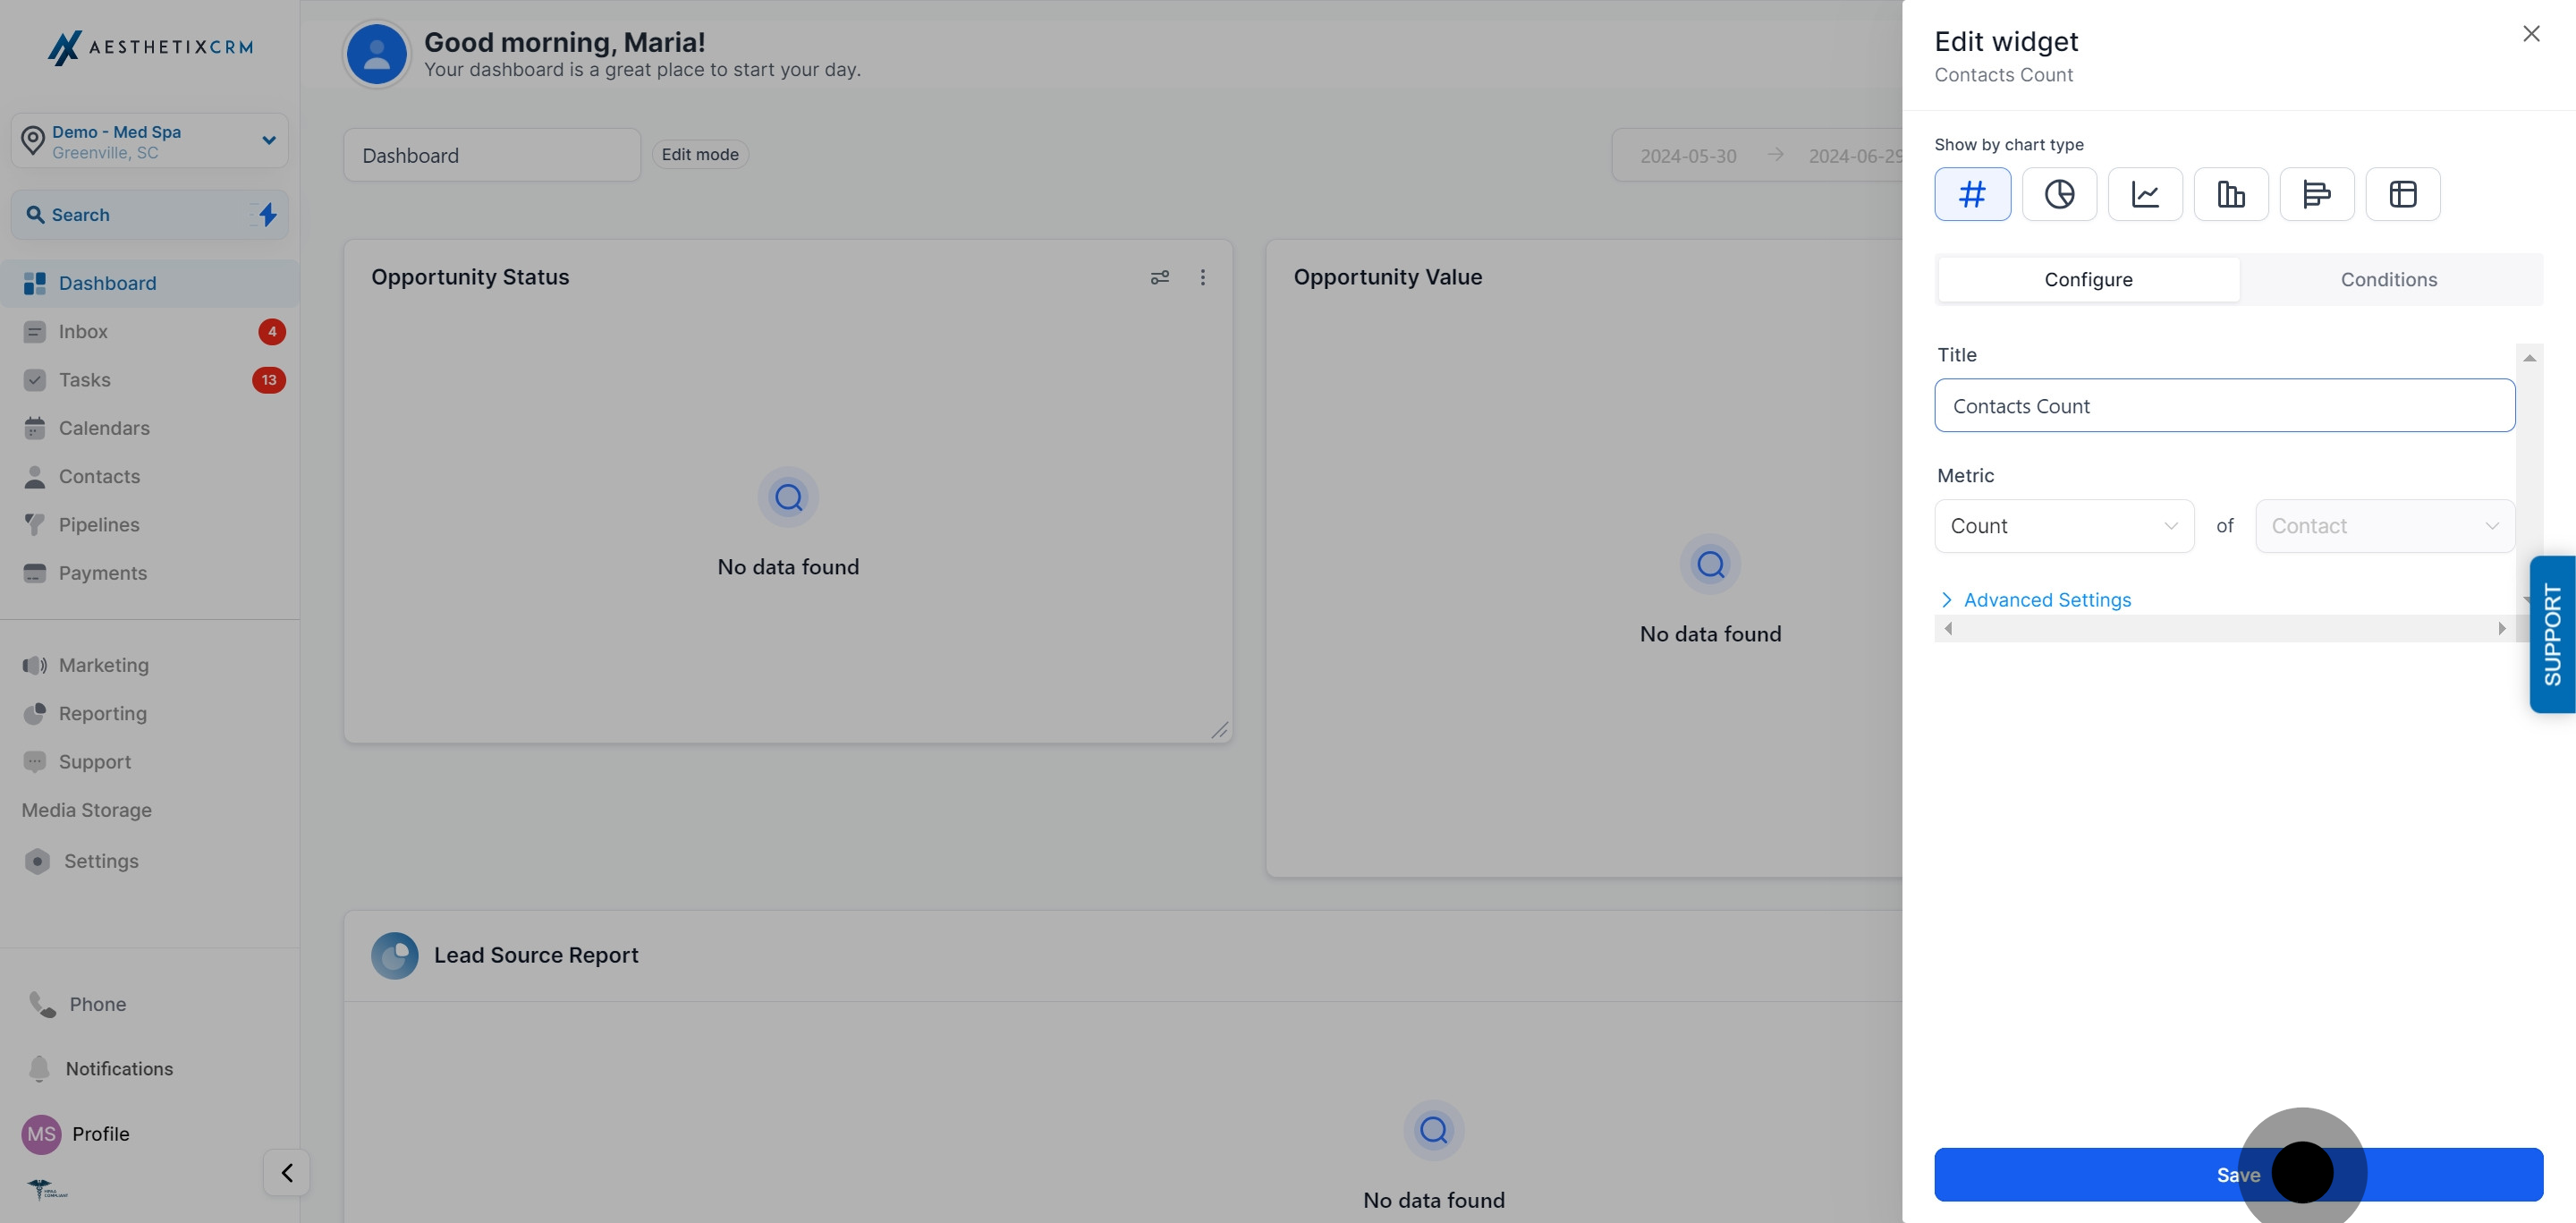
Click Save to save the widget's changes.
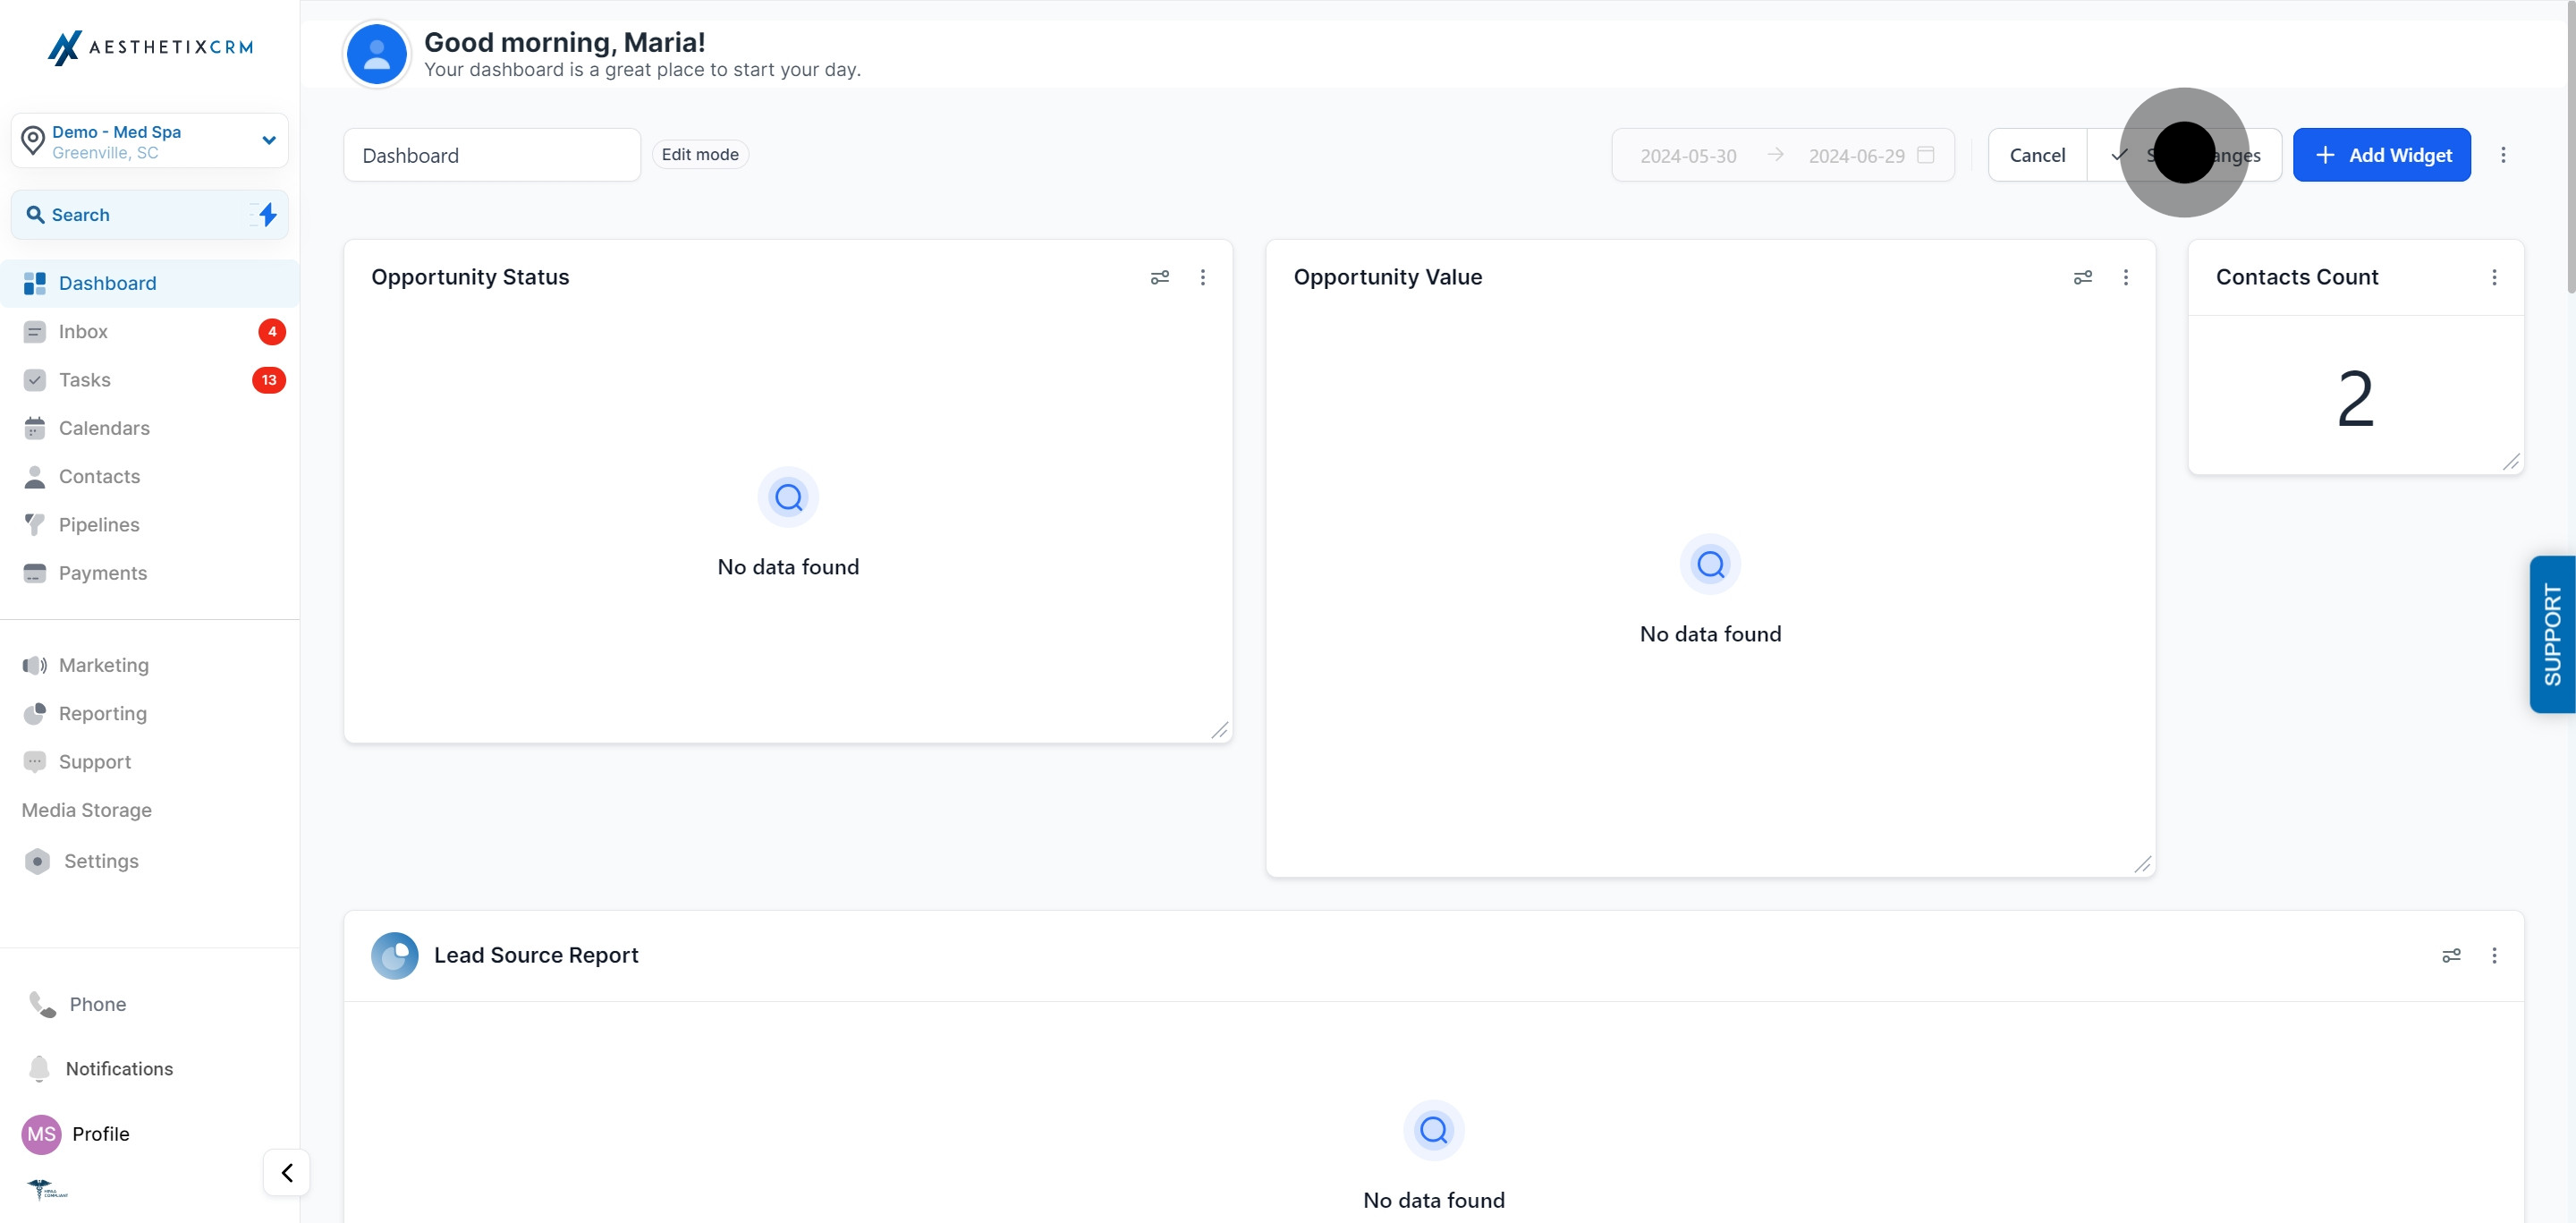
Click Save Changes to finalize the update on your dashboard layout.
Note: A handful of general/default widgets can't be edited or removed. If a widget's three-dot menu doesn't offer an Edit option, that's why.
It helps to keep these two levels straight:
Widget-level Save (inside the widget's own configuration or editing panel) commits changes to that one widget: its title, metric, filters, chart type, and so on.
Save Changes (on the dashboard itself, after you exit the widget panel) commits the widget's position, size, and its place among the other widgets on that dashboard.
You need both. Saving a widget's settings without also clicking Save Changes on the dashboard can leave your layout looking unfinished, and moving/resizing a widget without saving the dashboard means your layout change won't stick.
Once you're in a widget's settings (whether adding a new one or editing an existing one), the Configure tab exposes these fields:
Field | What it does |
|---|---|
Title | Rename the widget so its purpose is clear at a glance. |
Metrics | Choose which data points the widget tracks. Line, Bar, and Horizontal Bar charts support multiple metrics at once. |
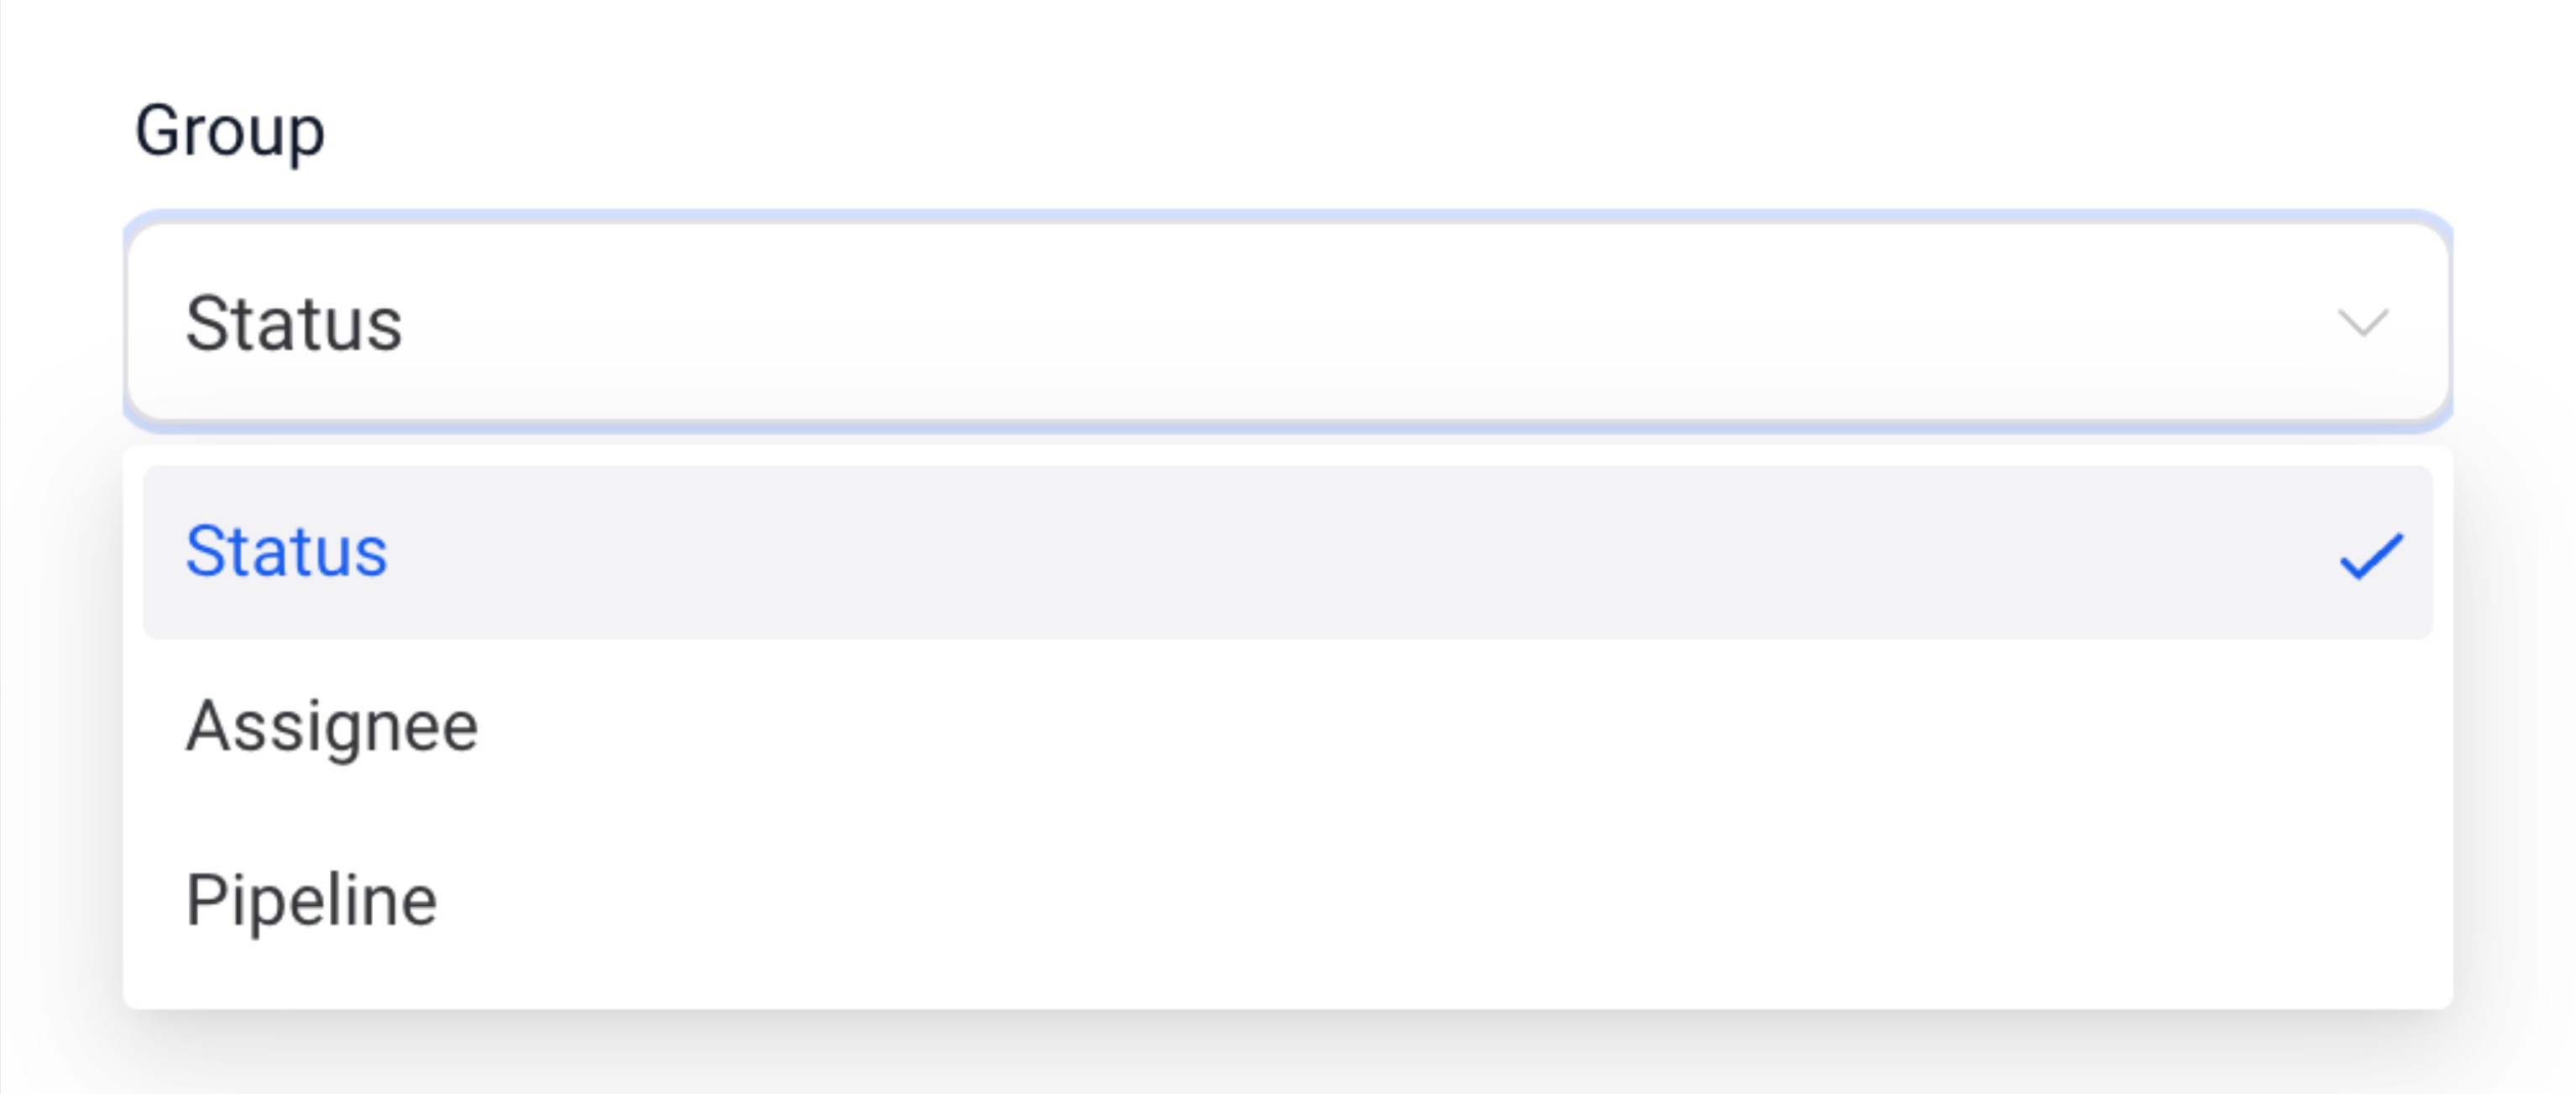
Group | Set grouping options for charts that need them, like Donut charts. |
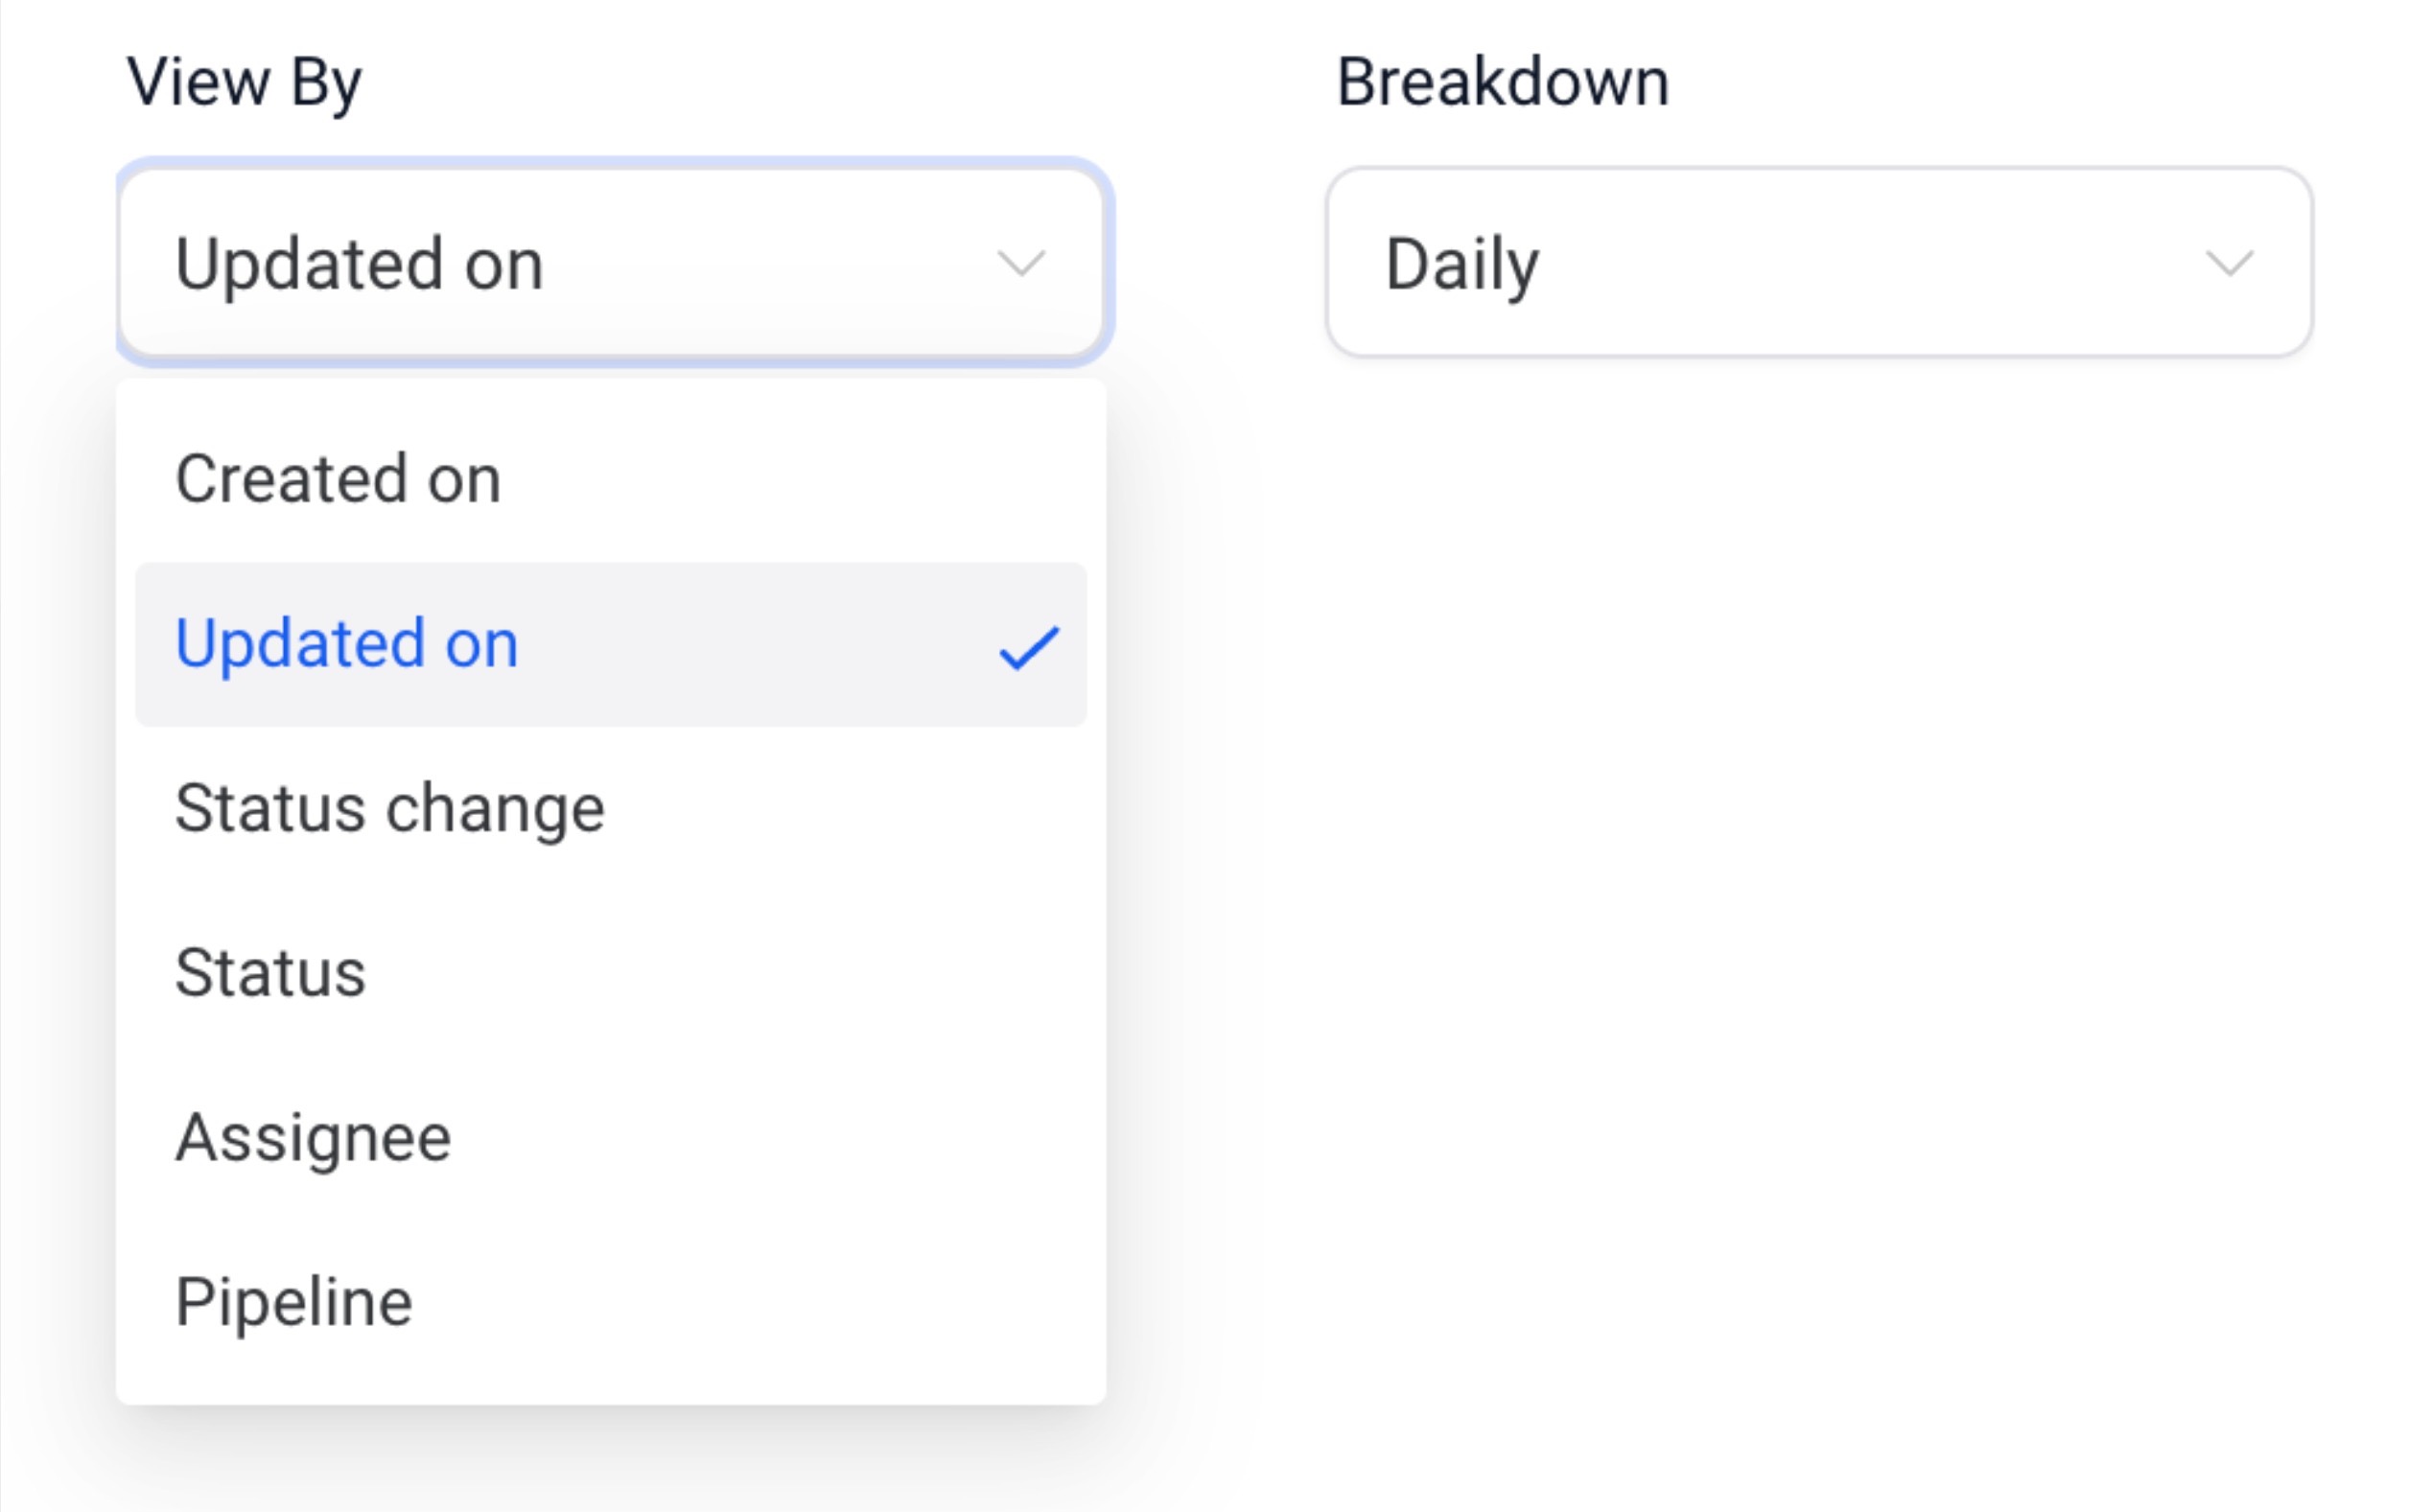
View By | Pick the secondary dimension for visualizations such as line or bar charts. |
Breakdown | Adjust how frequently the data is broken down (daily, weekly, monthly, and so on). |
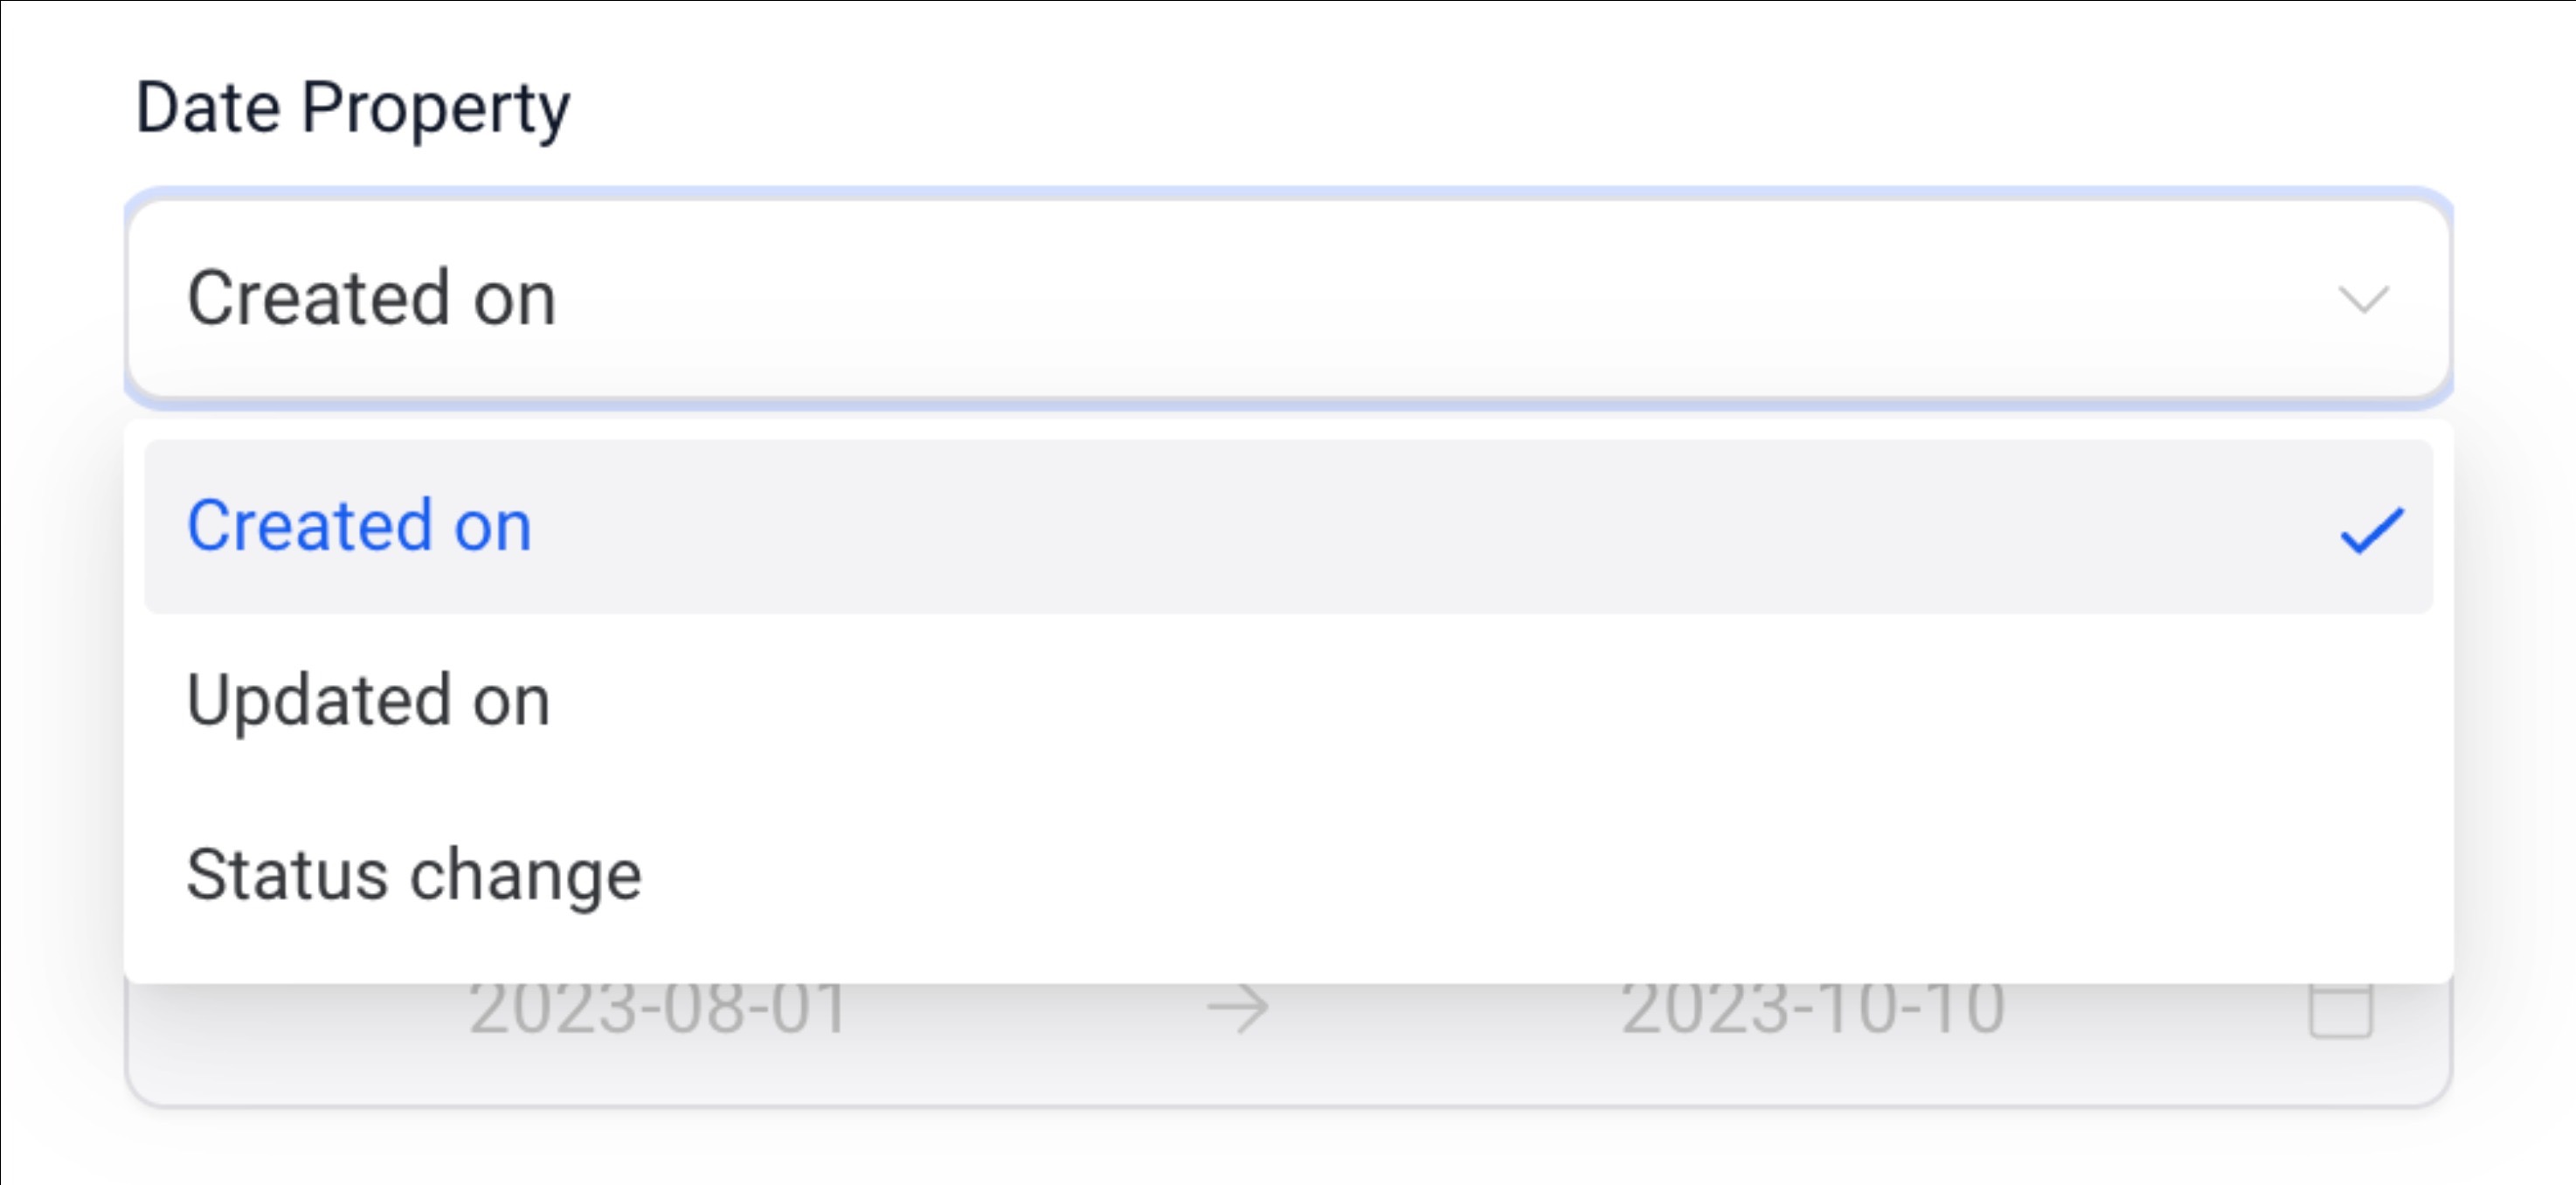
Date Property | Choose which date field the widget uses to fetch results (for example, Created Date vs. Updated Date). |
Date Range Override | Override the dashboard's global date range for this one widget, so it can show a different period than the rest of the board. |
Order | Sort results ascending or descending. |
Limit | Cap the maximum number of results shown. |
Comparison Date Property | Add a comparison percentage against a prior period for context. |
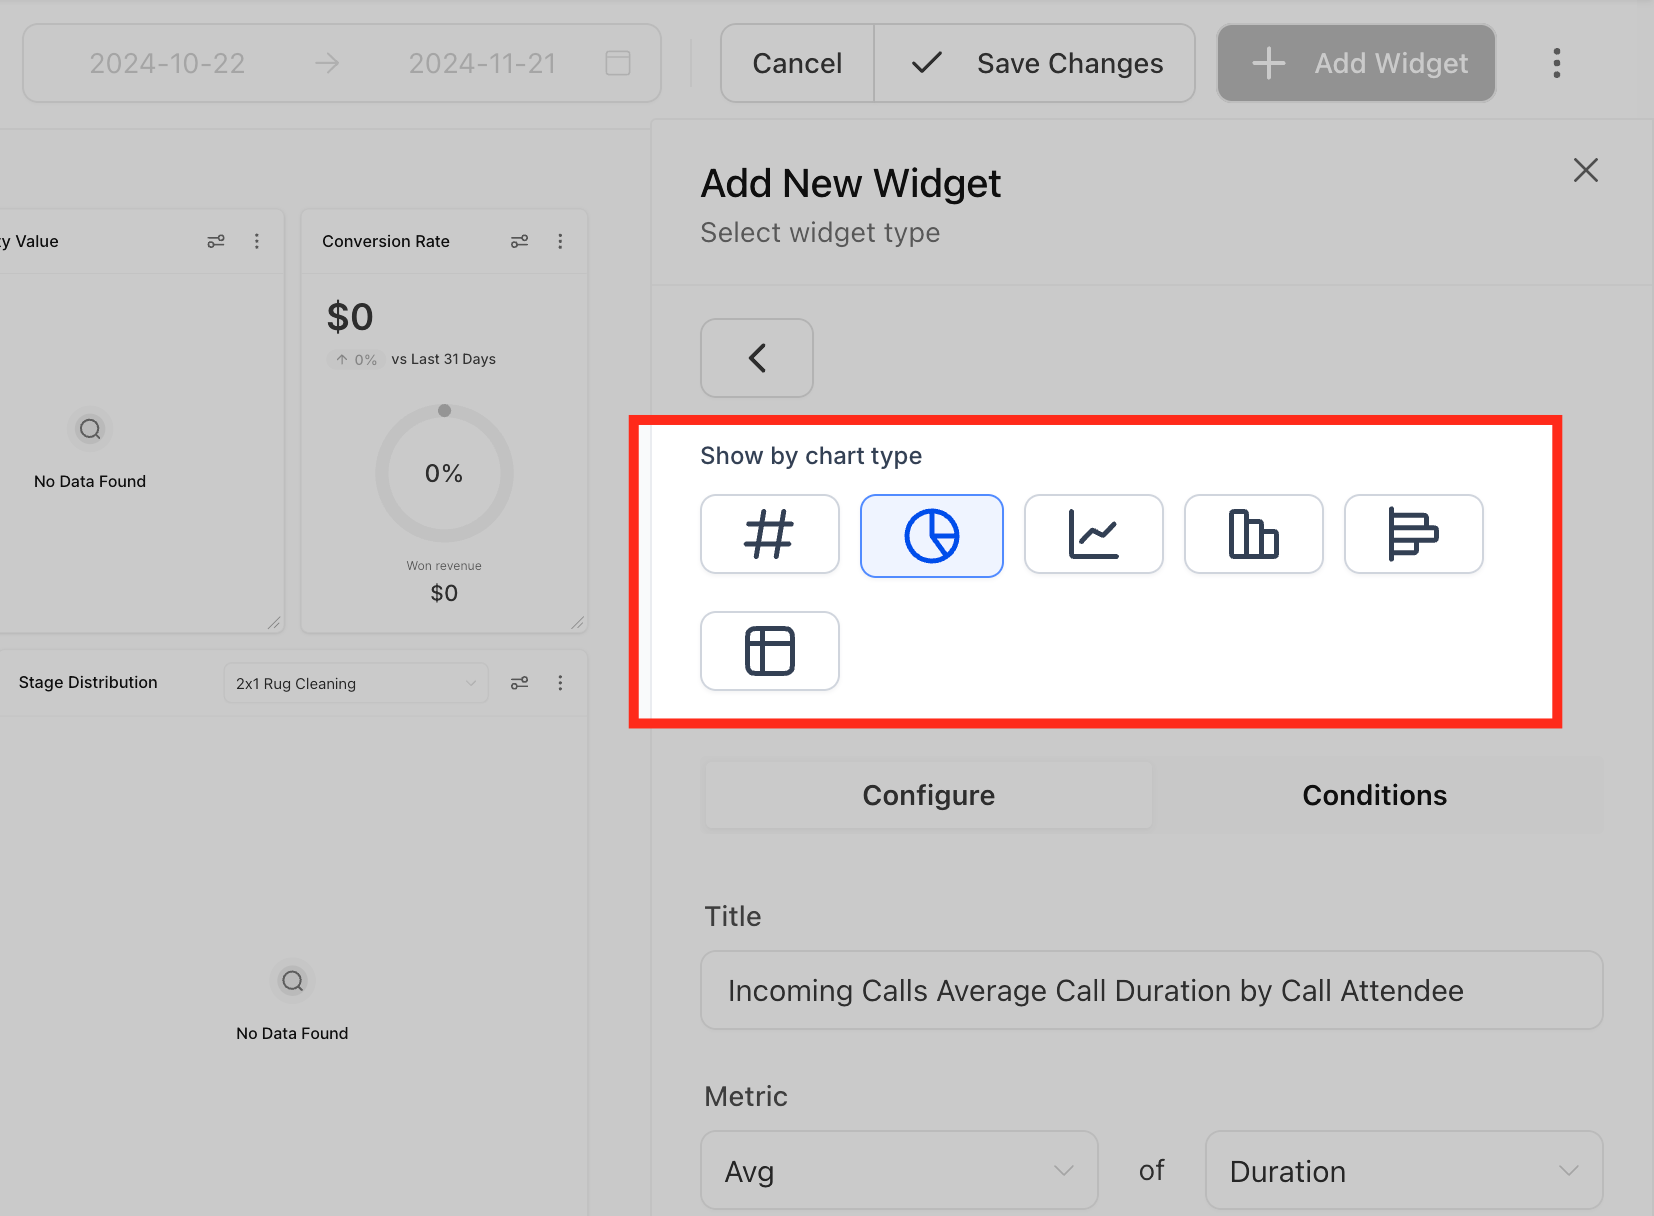
Renaming a widget:

Setting metrics (multiple metrics can be added for Line, Bar, and Horizontal Bar charts):

Group:
View By:
Date Property:
Date Range Override:
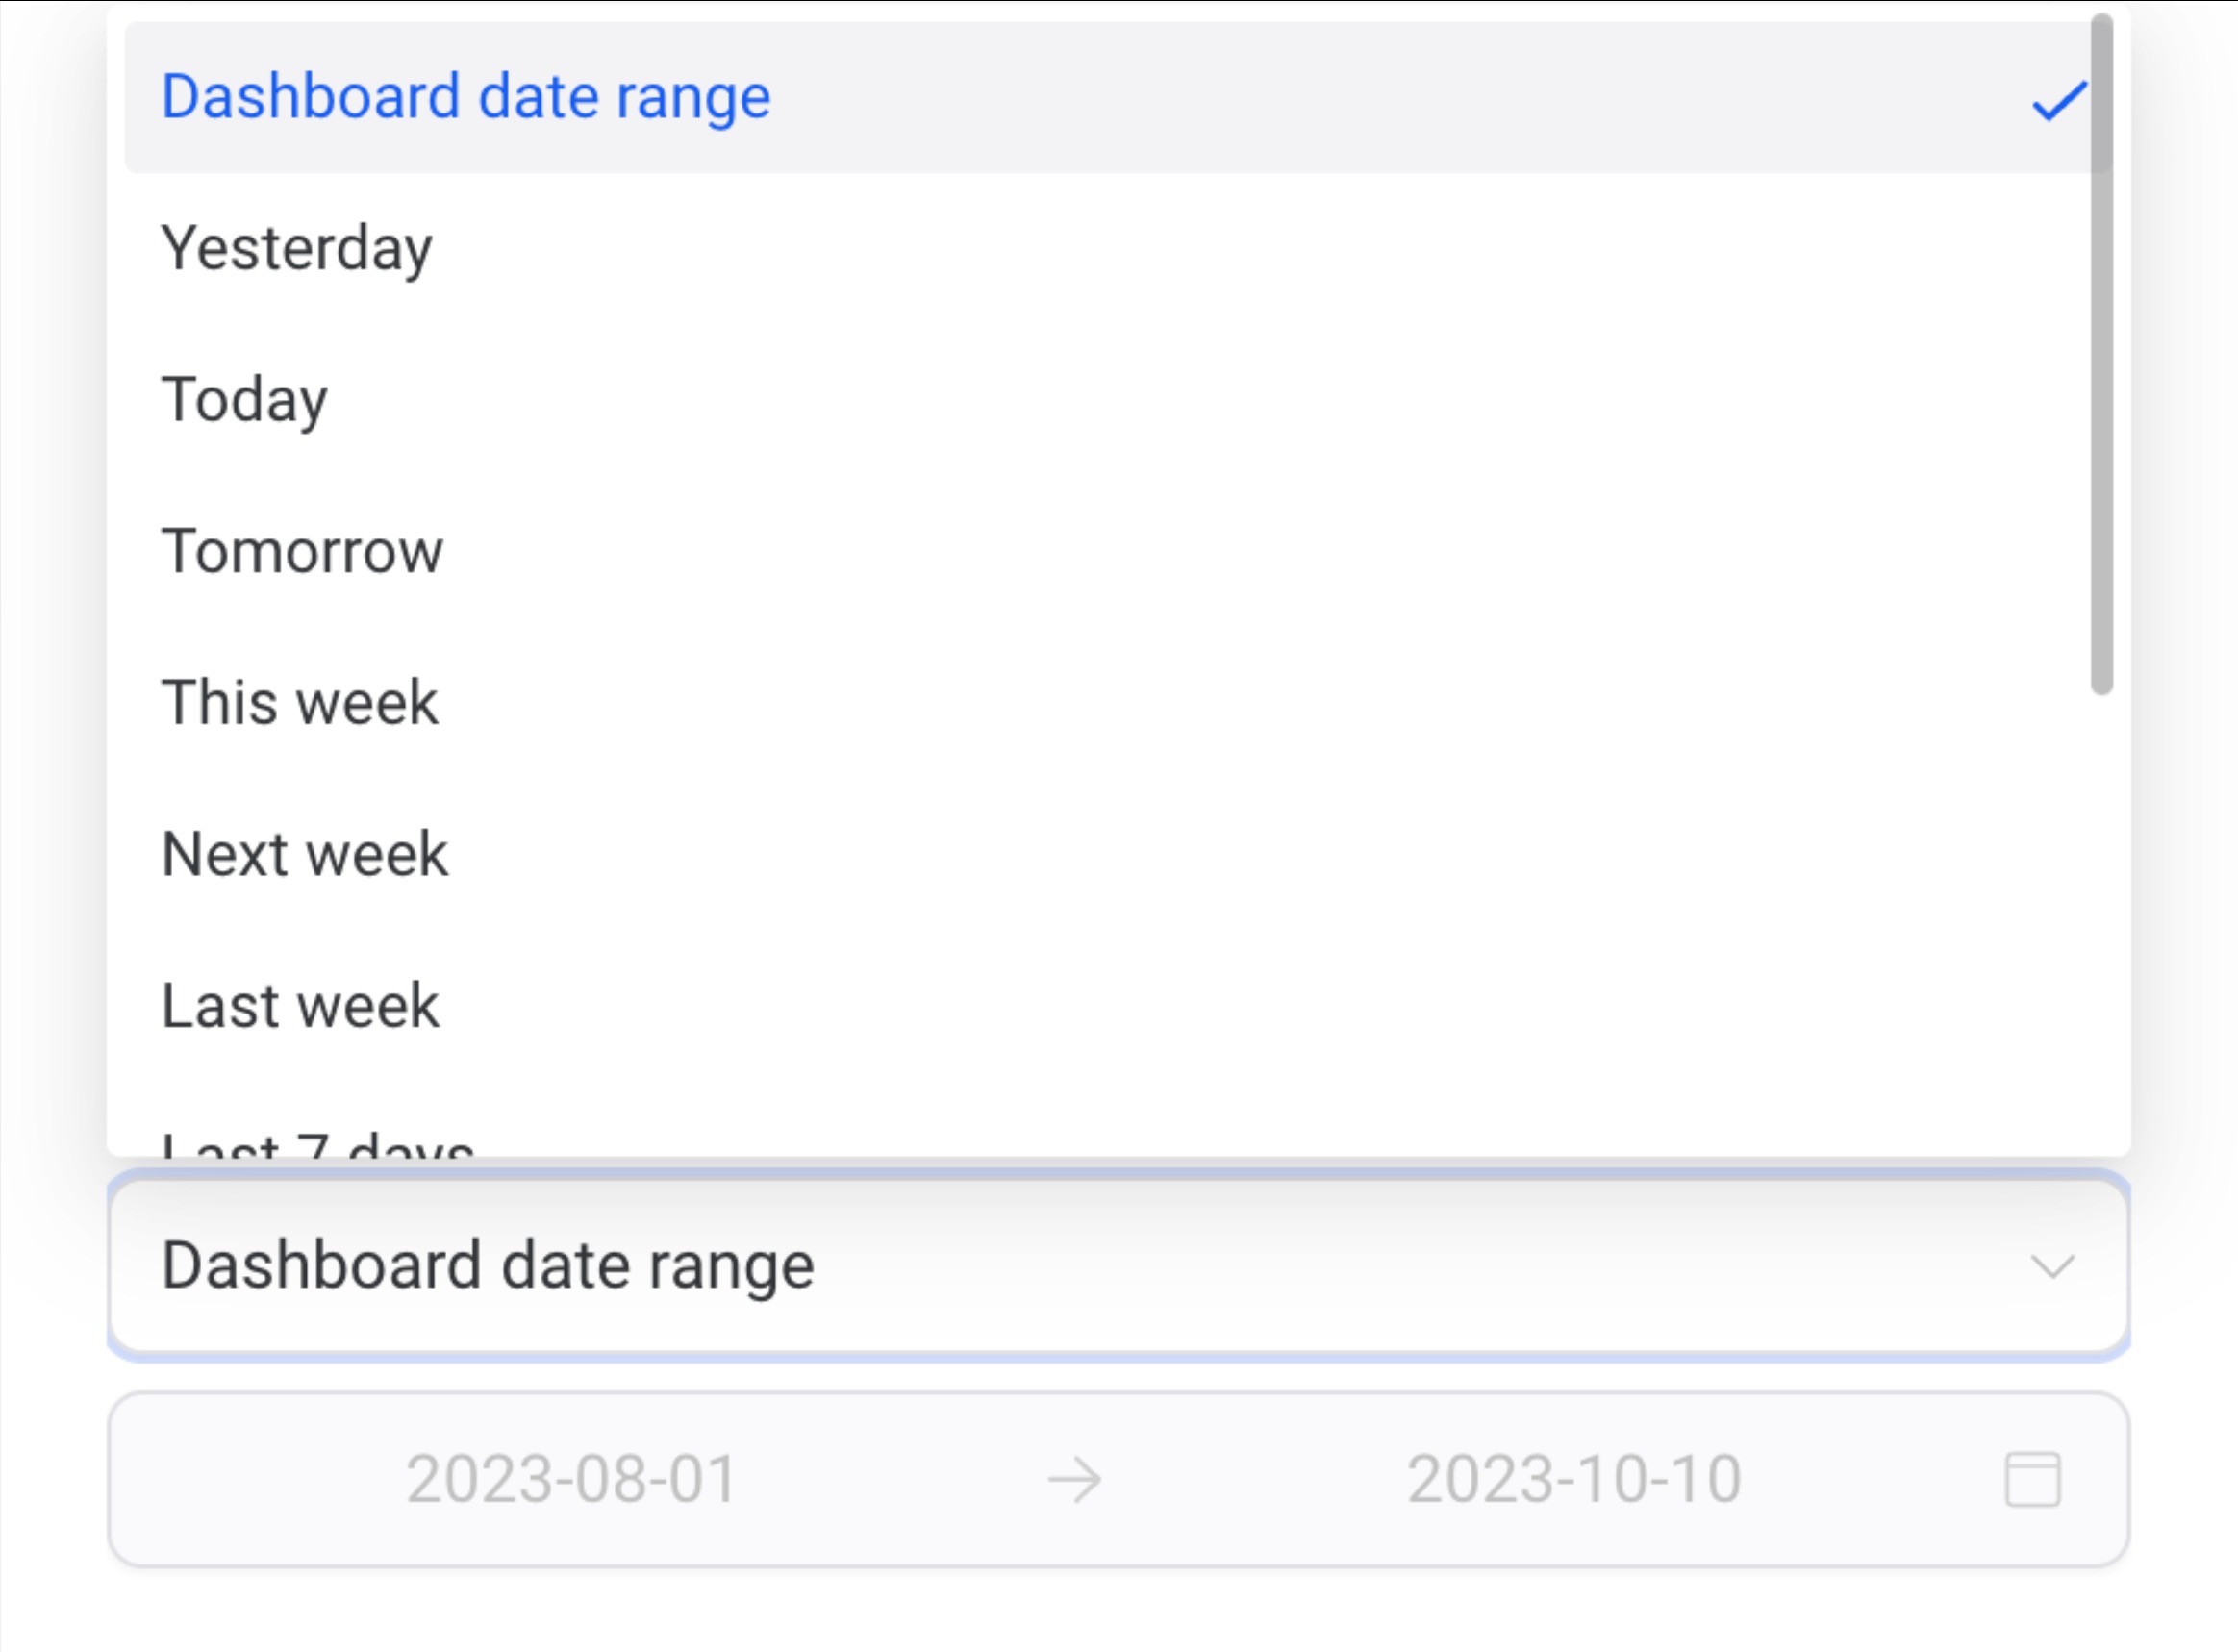
Advanced settings sit alongside these and offer further personalization, but they're optional and not required to save a widget.
Every widget's number stat can show a small trend badge next to it, an up or down arrow with a percentage, like ↓30% vs last 7 days. By default, this badge turns green when a metric goes up and red when it goes down.
That works well for metrics like Delivered Emails, where more is better. But for metrics like Unsubscribed Emails, Bounce Rate, or Cost per Lead, a lower number is the good outcome, and a badge that turns red just because the number dropped would be misleading. You can tell each widget which direction should count as positive, so the trend badge always reflects reality.
To set it:
Note: This setting only affects the trend badge's color. It requires a Comparison Date Range to be set (for example, "Previous 7 days"), since without a comparison period there's no percentage change to color in the first place.
Examples:
Widget | Metric behavior | Recommended setting | Result |
|---|---|---|---|
Unsubscribed Emails | Lower is better | Decrease is positive | A drop in unsubscribes shows green |
Delivered Emails | Higher is better | Increase is positive | A drop in delivered emails shows red |
Bounce Rate | Lower is better | Decrease is positive | A drop in bounce rate shows green |
Cost per Lead | Lower is better | Decrease is positive | A drop in cost per lead shows green |
Churn Rate | Lower is better | Decrease is positive | A drop in churn shows green |
This setting behaves the same whether the widget is displayed as a Number, Line, or Bar chart. Every existing widget defaults to Increase is positive, so nothing changes on a widget until you manually update its setting.
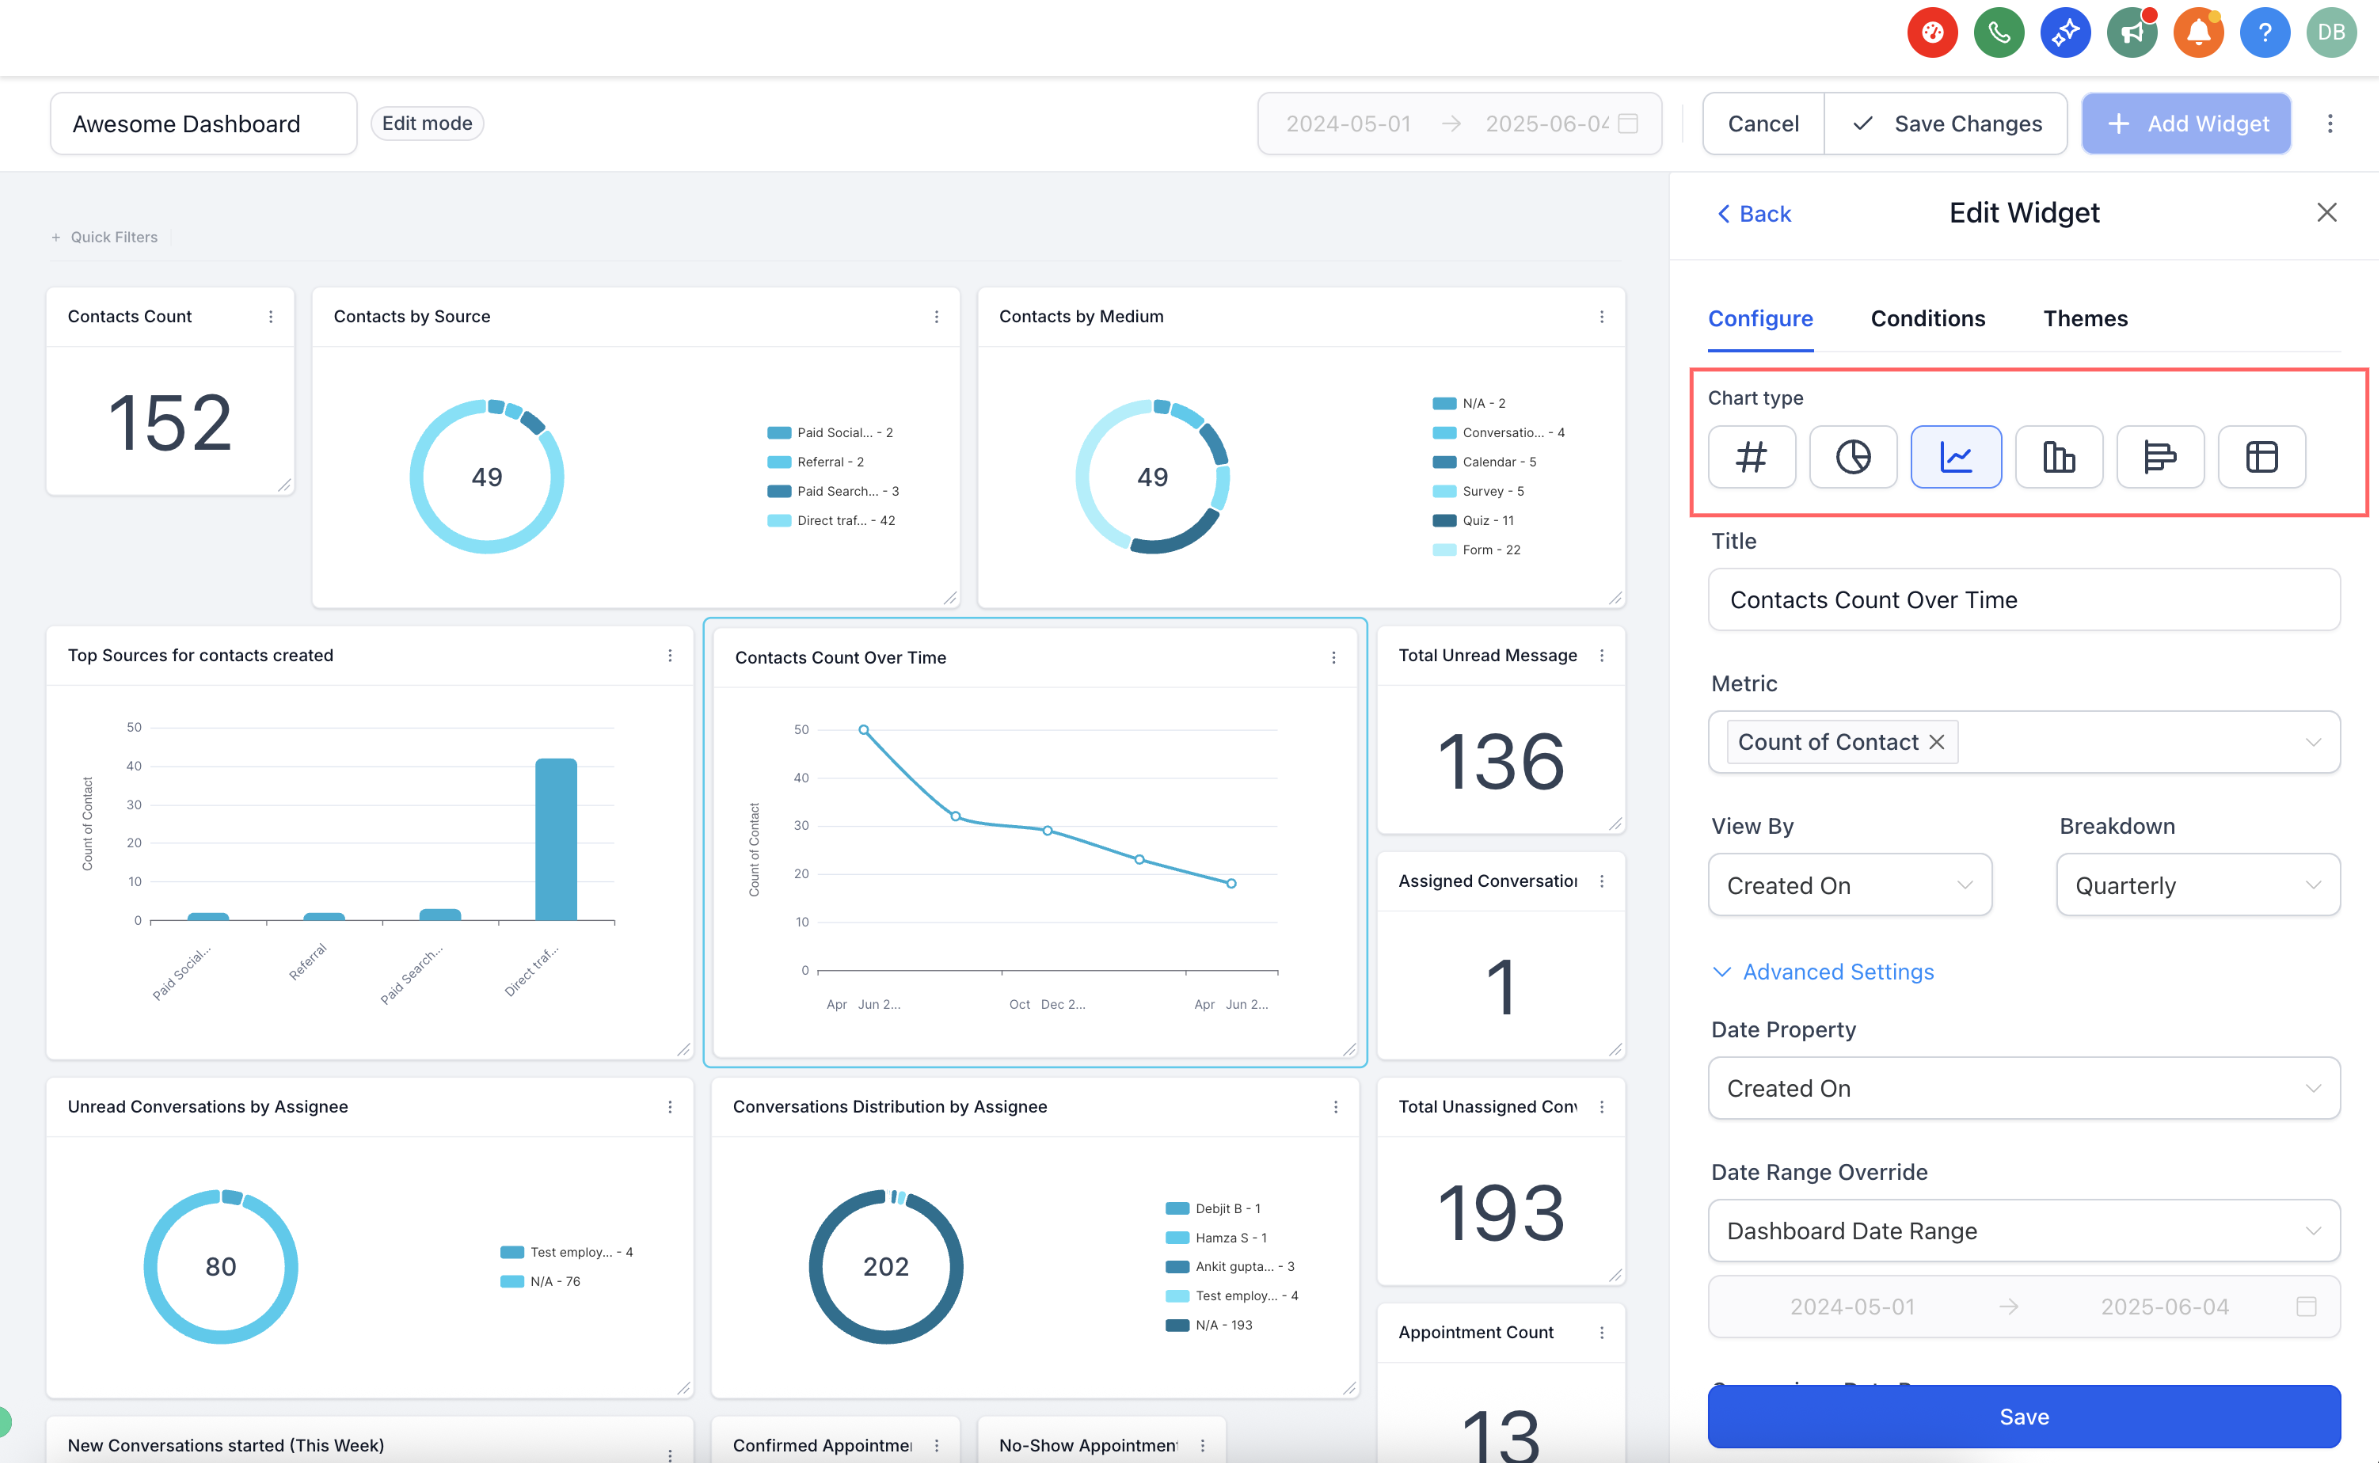
The chart type you pick affects how easy the data is to read at a glance. To pick a chart:
Open the widget's Settings, then go to Configure.
Choose the chart type you want (bar, line, pie, donut, and more) and review the live preview before committing.
Continue on to Conditions, or click Save if you're done.
Filters (called Conditions in the widget settings) let you narrow a widget down to a specific segment of your data, like leads from a particular source, or appointments booked in a particular pipeline stage.
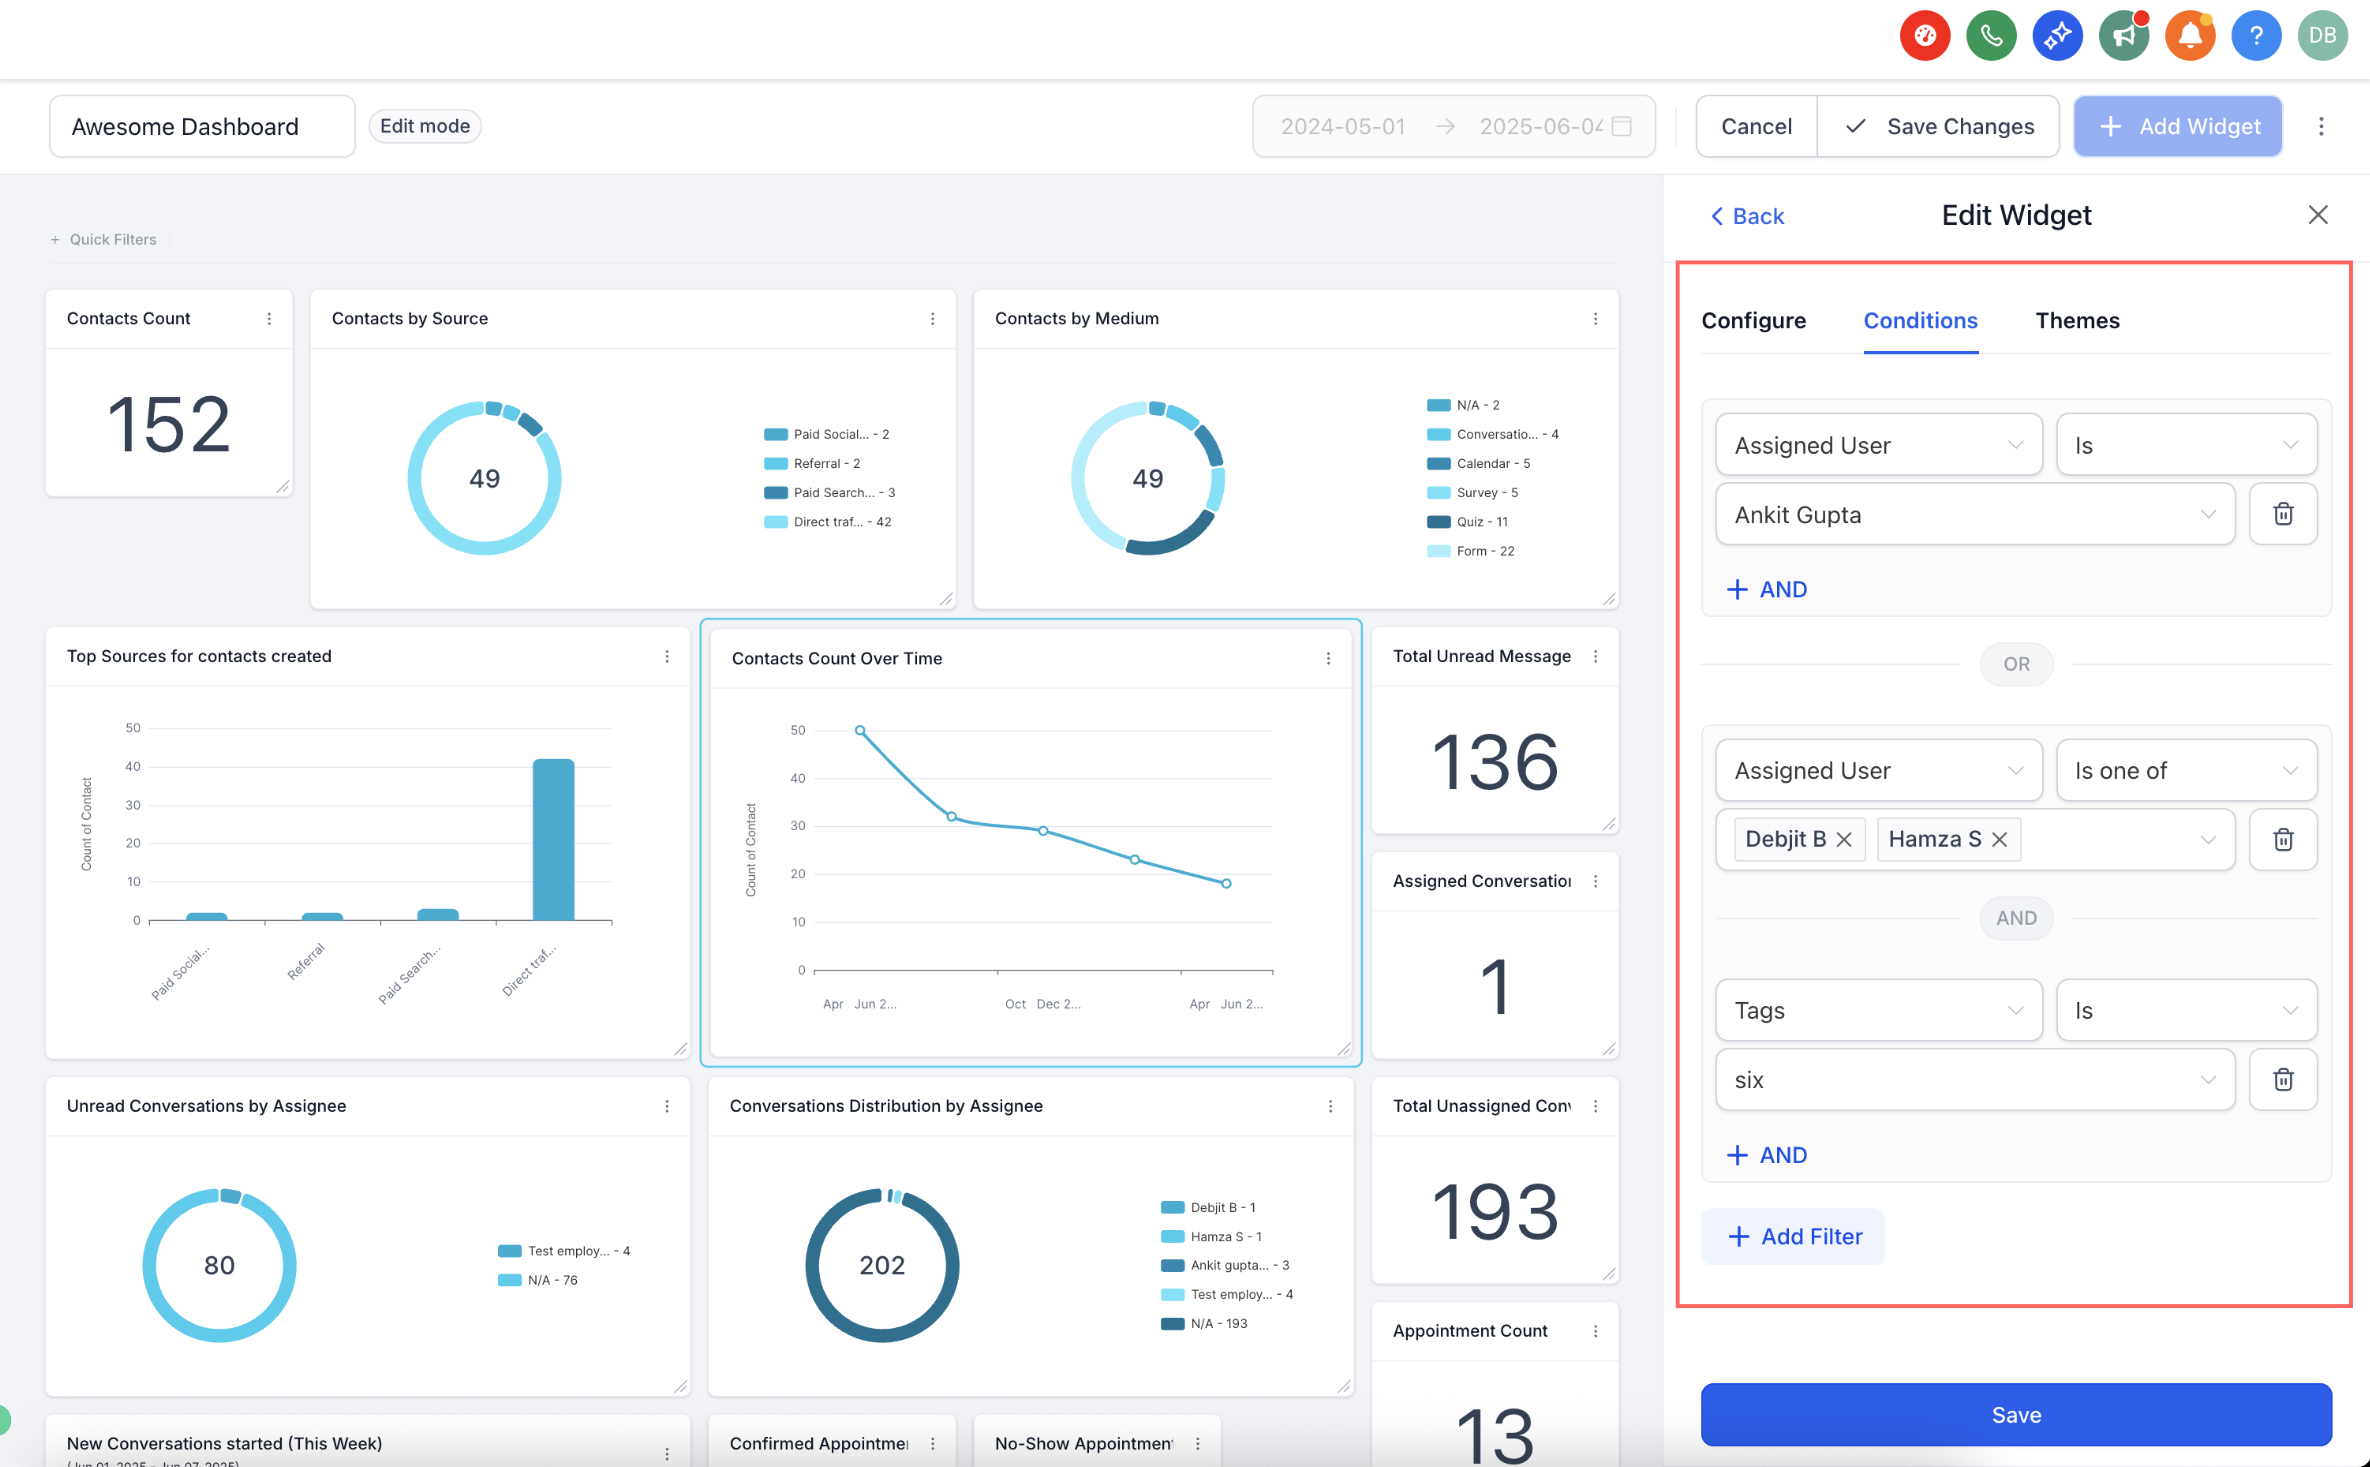
Grouping filters lets you build logic that matches real-world segments. Filters inside the same group are evaluated with AND (all conditions must match); separate groups are evaluated with OR (a record matching any one group qualifies).
To build groups:
Open the widget, then go to Conditions.
Click Add Filter to create Group 1.
Use +AND to add more filters inside that same group.
Click +Add Filter again to start Group 2 (this adds an OR condition against Group 1).
Repeat as needed, then click Save.
Visitor Data widgets support only one filter group.
Sometimes you need the same field twice, for example, Source = Google OR Source = Facebook. Using separate groups for the same field is fully supported, so you can match broader sets of contacts without workarounds.
Example:
Group 1: Source = Google
Group 2: Source = Facebook
Some filters depend on one another, such as Pipeline and Stage. If your combination of filters conflicts (for example, a Stage that doesn't belong to the selected Pipeline), Aesthetix CRM shows a clear inline warning inside Conditions. Adjust either filter to resolve the warning, then save.
To add a condition:
Click Add Condition under the Conditions tab.
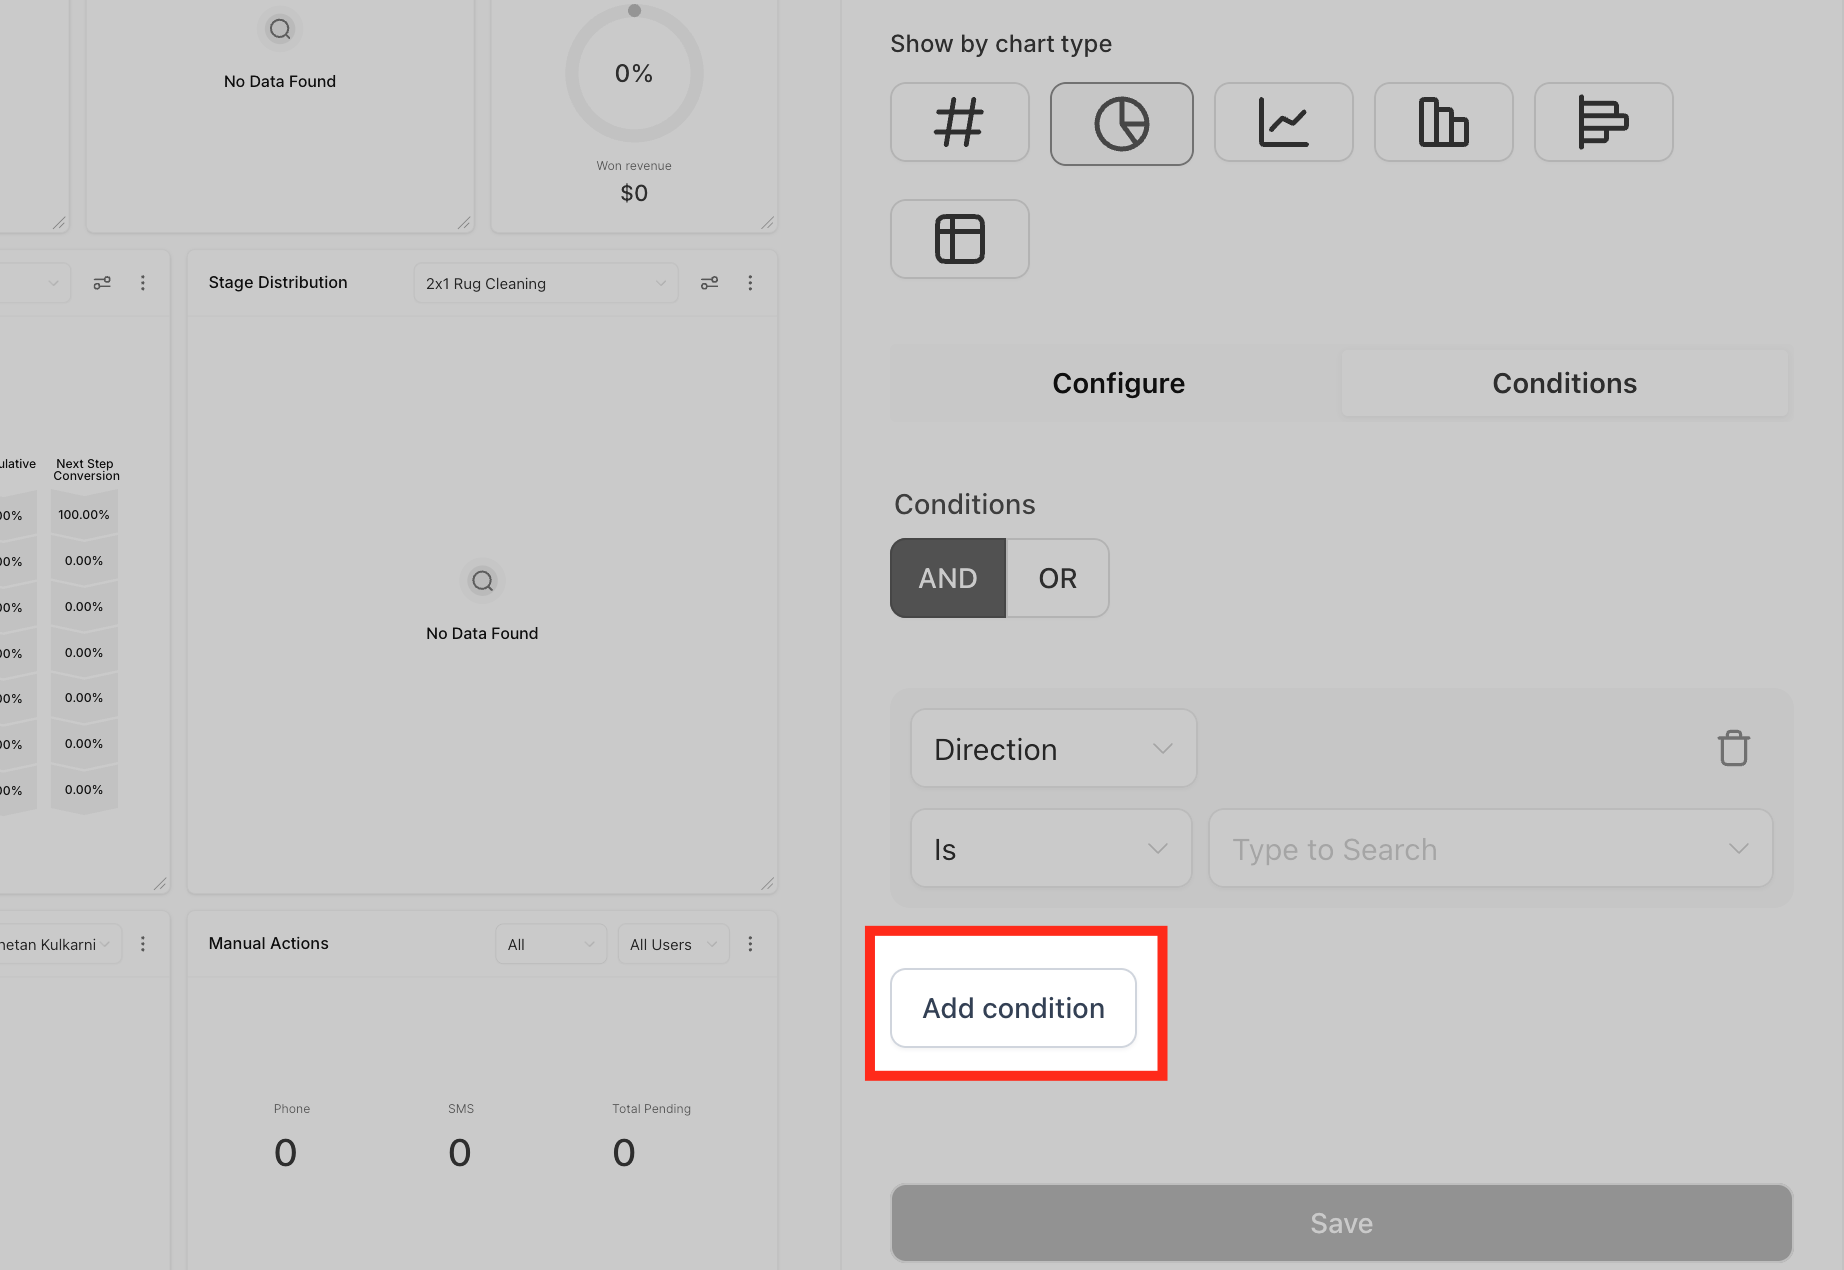
Choose the filter field, the operator, and the parameters.
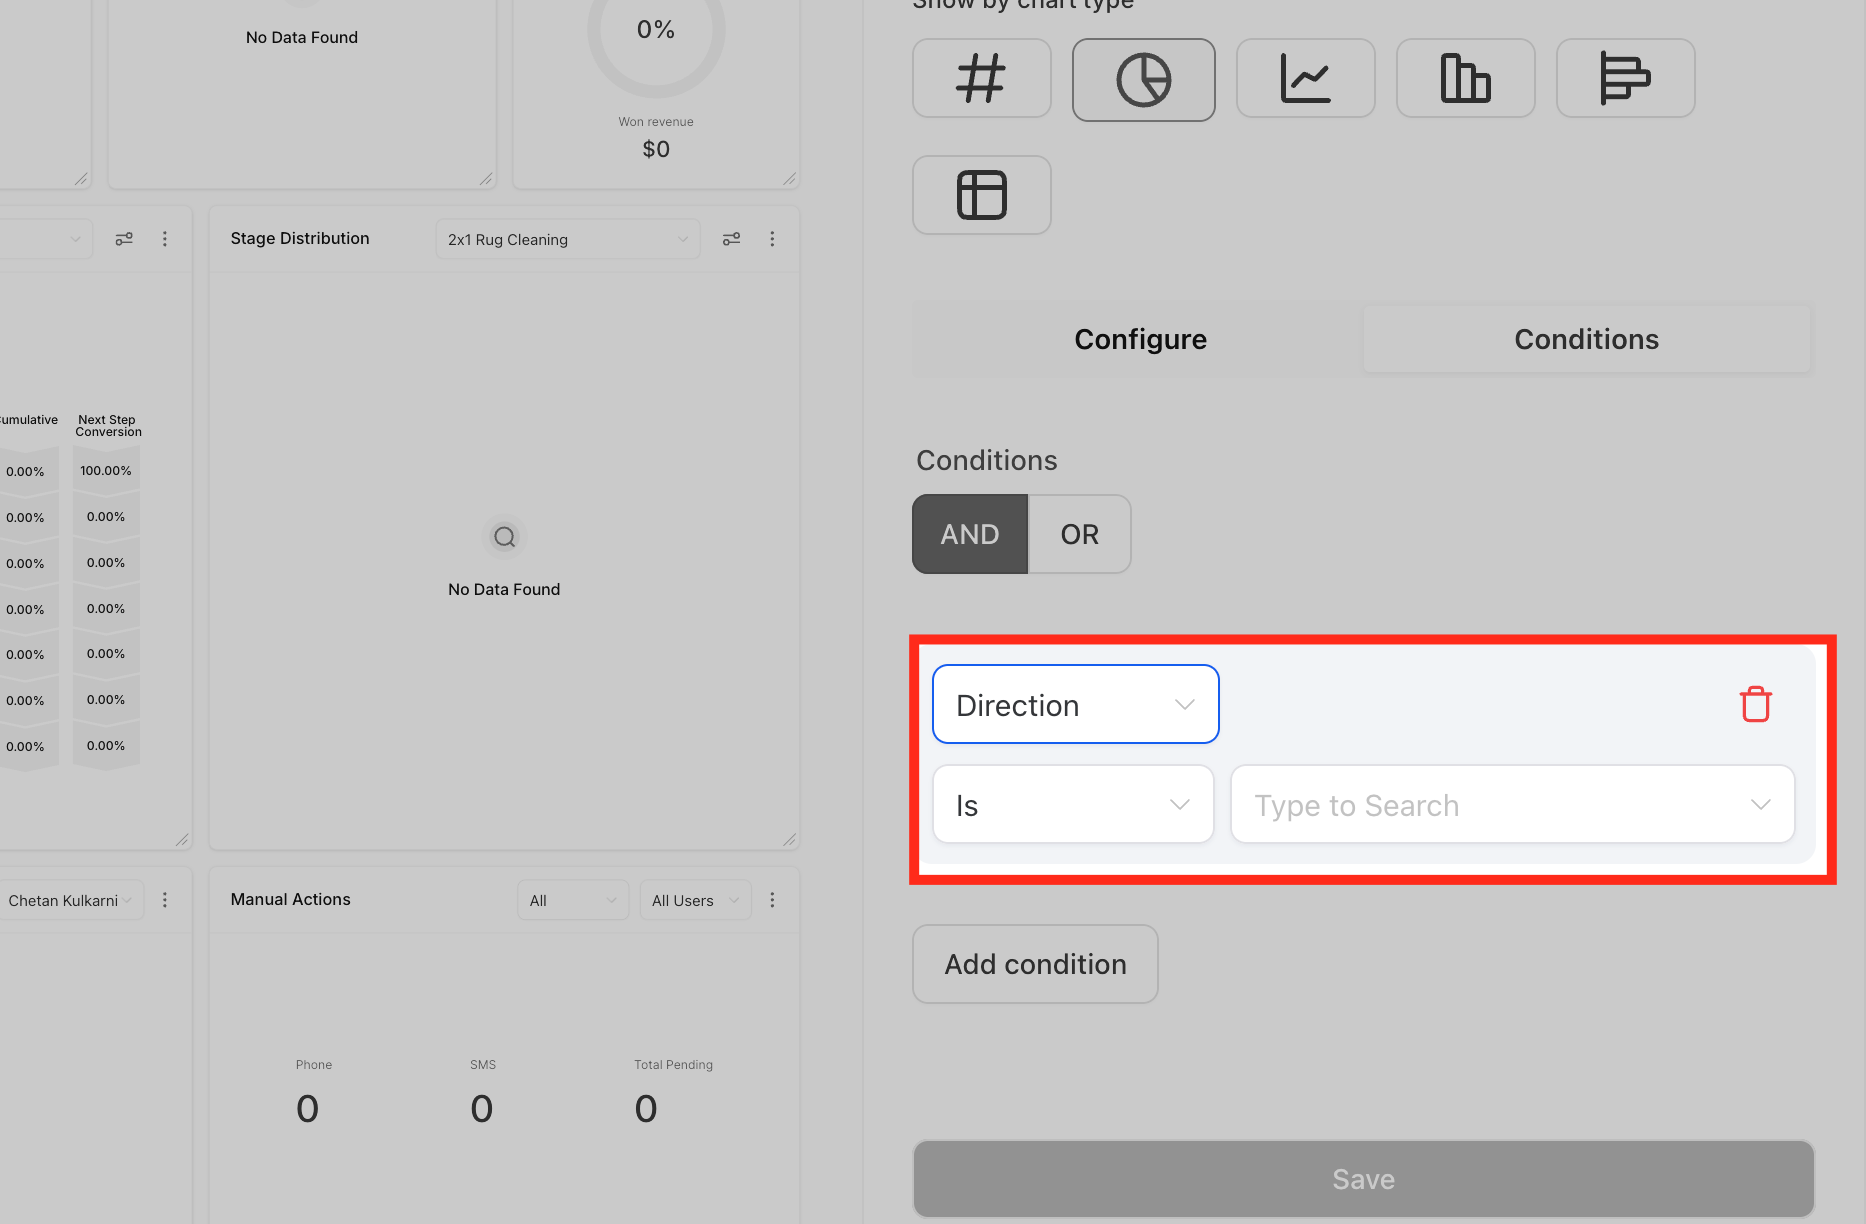
Add as many filters as you need using AND/OR logic, or delete any you no longer want.
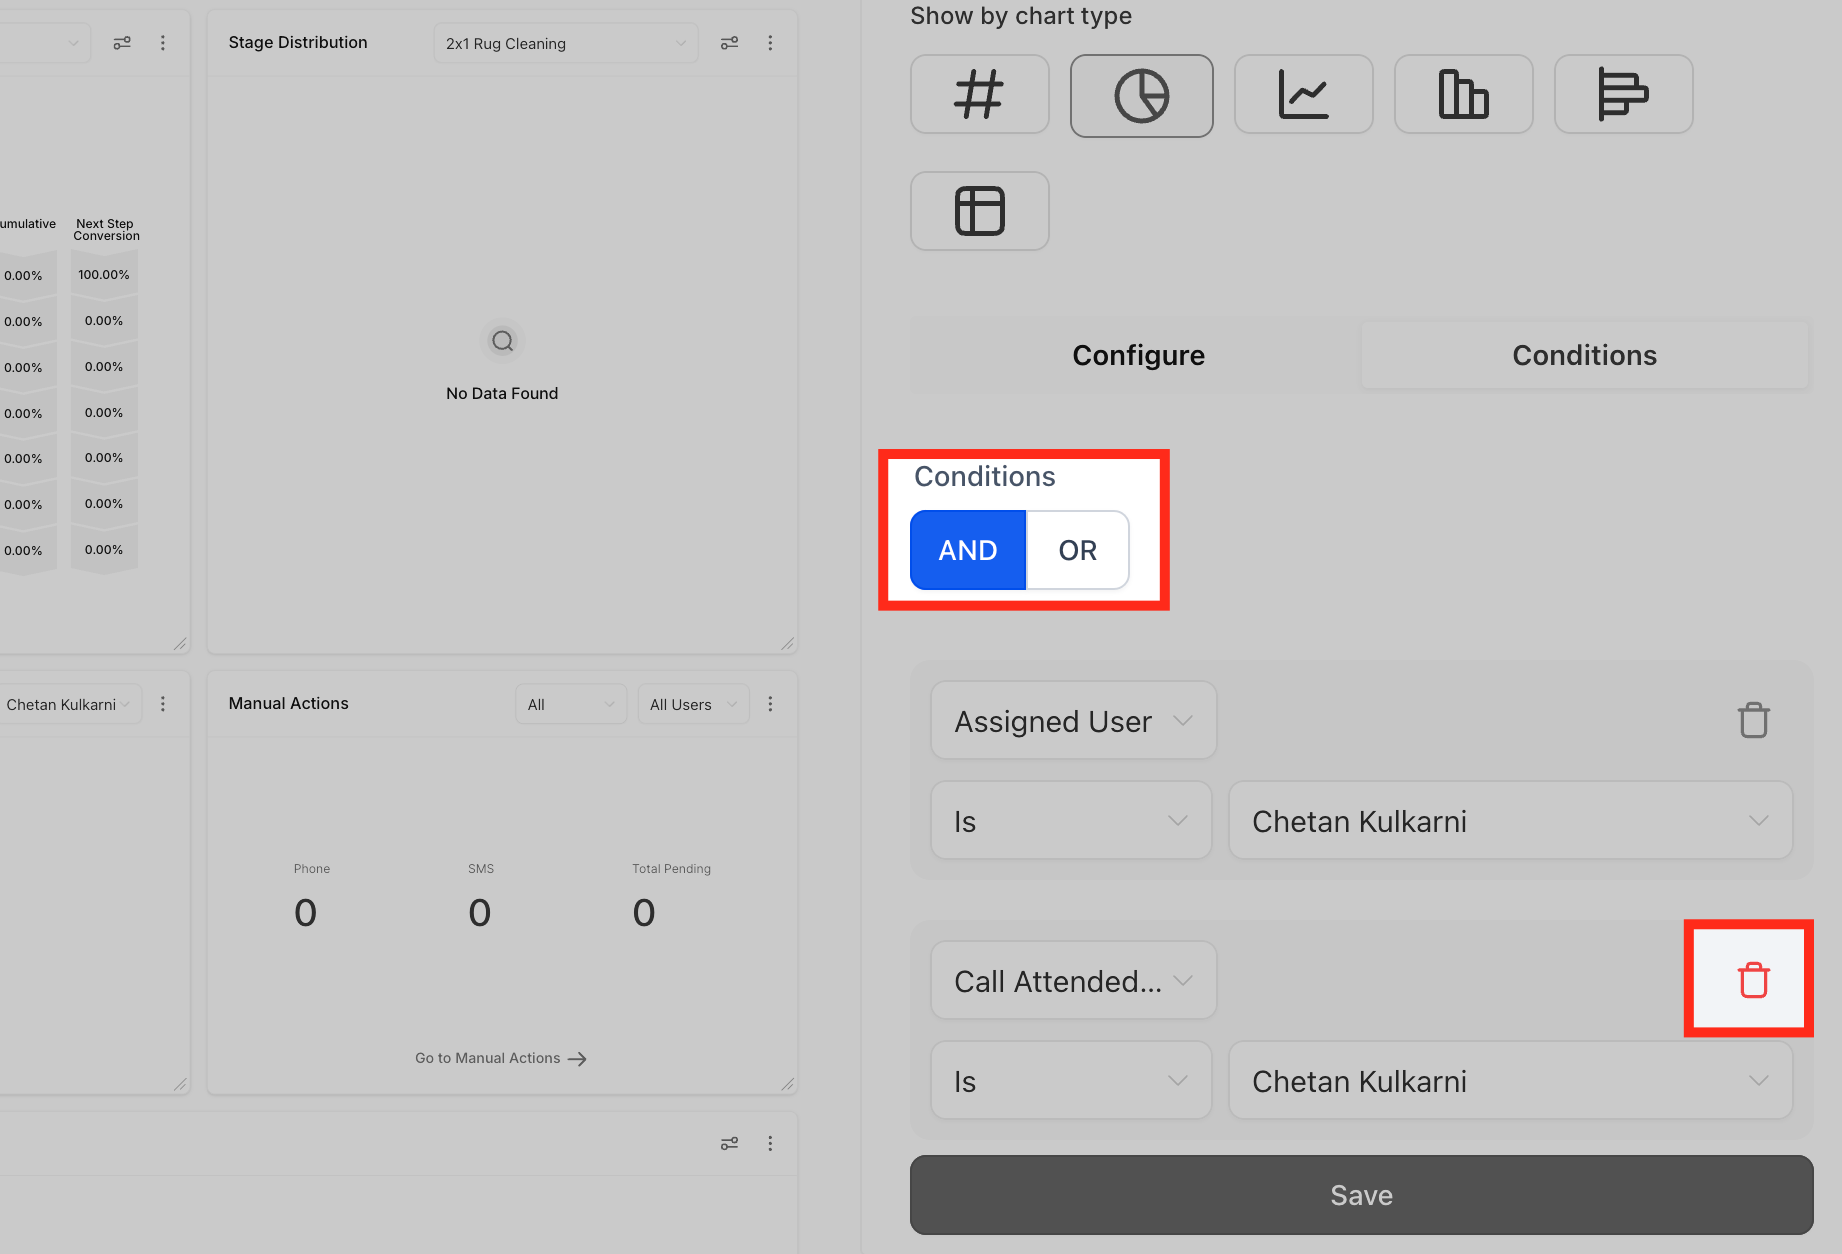
Note: If no data matches a filter, you won't be able to save the widget until you adjust or remove that filter.
Once your widget looks the way you want:
Click Save to update the widget itself.
Adjust the widget's size or position on the dashboard if needed.
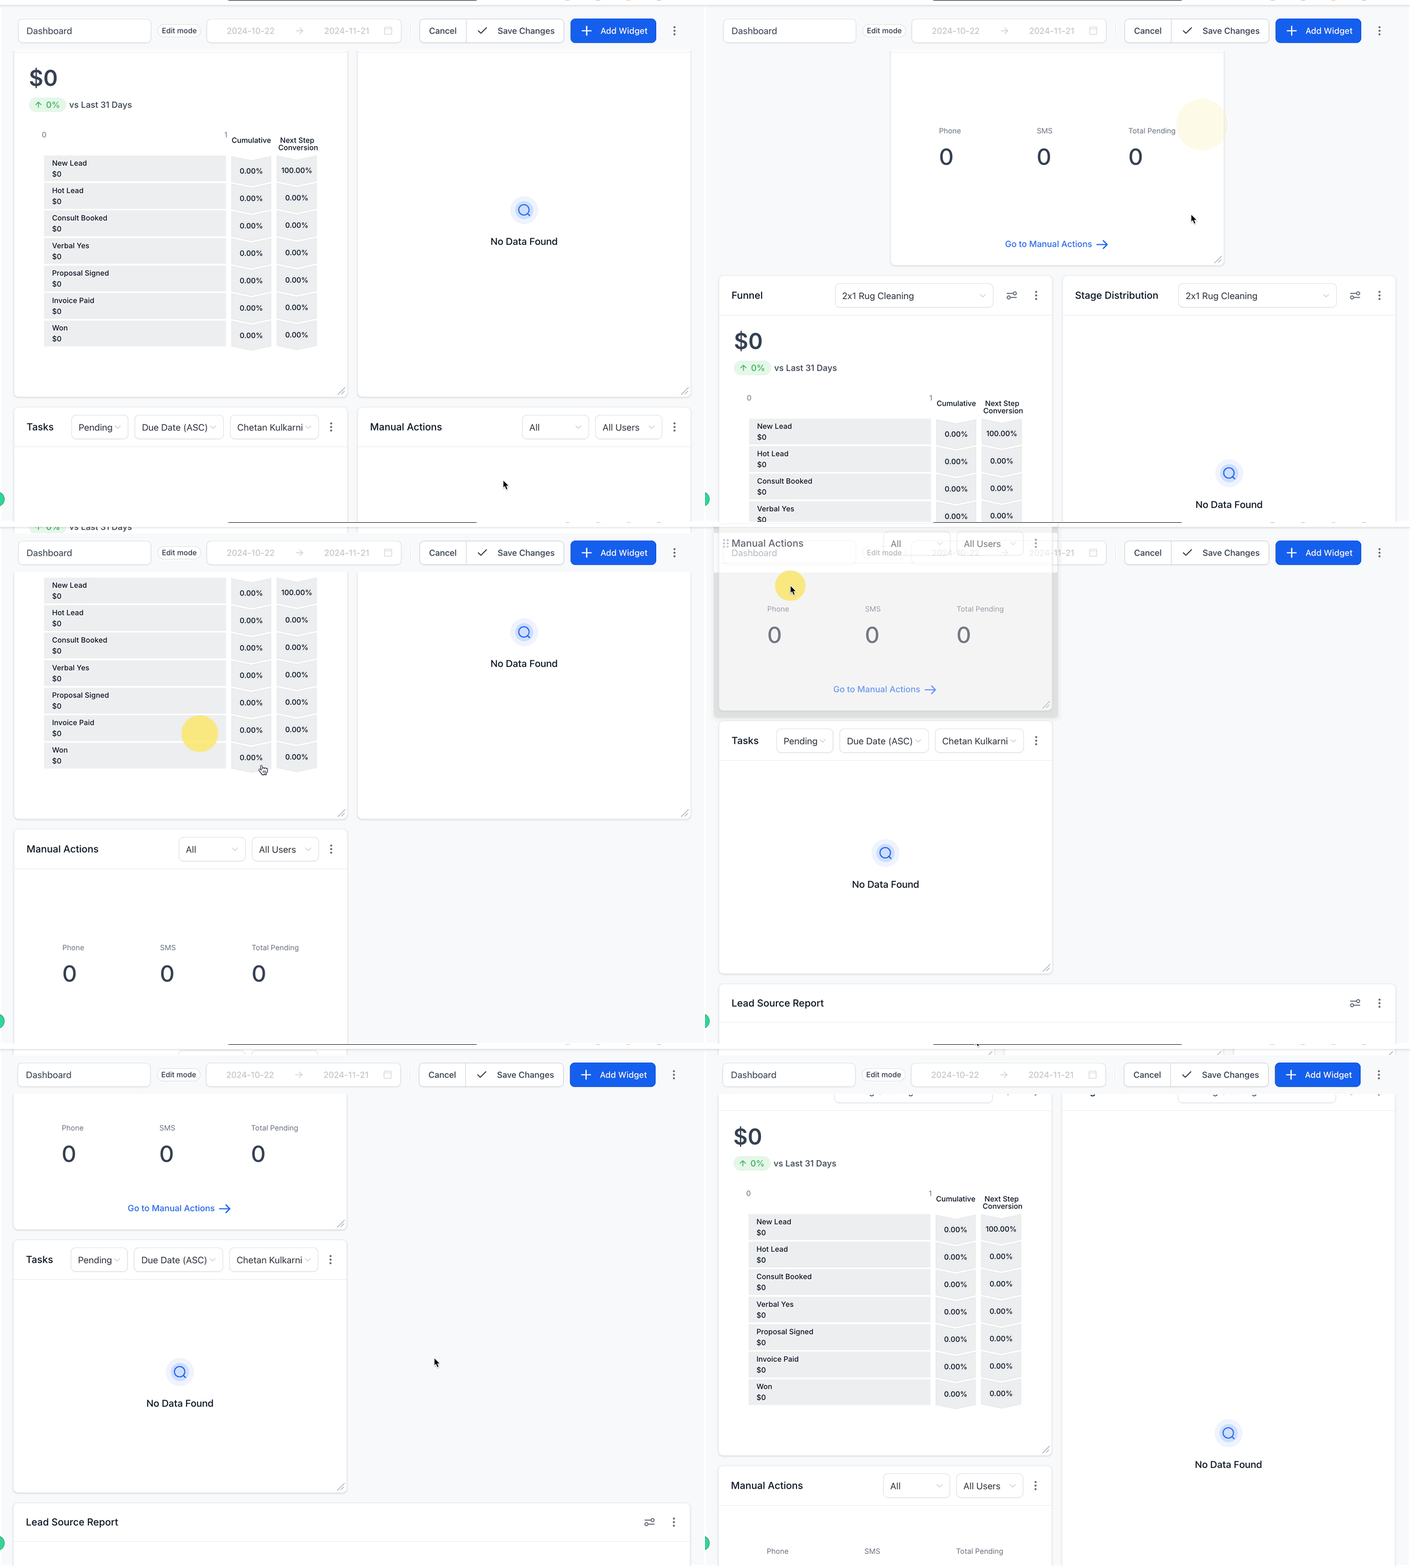
Save your dashboard layout to finalize everything.
Can I add more than one metric to a single widget? Yes. Line, Bar, and Horizontal Bar charts all support multiple metrics in the same widget, so you can compare several data points side by side.
Why can't I save my widget after adding a filter? Aesthetix CRM blocks saving if a filter condition has zero matching data. Either remove the offending filter or adjust its value so it matches real records.
What's the difference between clicking Save and clicking Save Changes? Save (inside the widget panel) commits that widget's own settings, like its title, metrics, and filters. Save Changes (on the dashboard) commits its size and position among the other widgets. You need both for a change to fully stick.
Can I override the dashboard's date range for just one widget? Yes. Use the Date Range Override field in the widget's Configure tab to give that widget its own date window that's independent of the dashboard's global range.
Can I use OR logic across filters? Yes. Filters inside the same group use AND logic, while separate filter groups are combined with OR logic. This lets you build segments like "Source = Google OR Source = Facebook."
Are there widgets I can't edit? A small number of default/general widgets can't be edited or removed. If a widget's three-dot menu has no Edit option, that widget falls into this category.
Can I use the same field in two different filters? Yes, as long as each instance lives in its own filter group. This is how you build "either/or" conditions on the same field, such as matching two different lead sources.
Where do I change a widget's chart type after it's already been created? Open the widget's Settings, go to Configure, and use the chart type picker there. You'll see a live preview before you commit to the change.
What does the Comparison Date Property field do? It adds a comparison percentage to your widget so you can see how the current period stacks up against a prior one, useful for tracking growth in leads, consults, or revenue over time.
Do filter changes affect the whole dashboard or just one widget? Filters and conditions you set inside a widget's Configure tab apply only to that widget. Your dashboard's global date range is separate and can still be overridden per widget using Date Range Override.
Will turning on "Decrease is positive" change how my existing widgets look? No. Every existing widget defaults to Increase is positive, matching prior behavior. Nothing changes unless you manually update a widget's setting.
I don't see a trend badge on my widget at all, why? Make sure a Comparison Date Range (for example, "Previous 7 days" or "Previous period") is set for the widget. Without a comparison range, there's nothing to compare against, so no badge or percentage appears.
Is there an equivalent setting for custom metrics? Yes. Custom metrics have a similar "When the metric increases, show indicator as Positive/Negative" toggle in the custom metrics builder.
