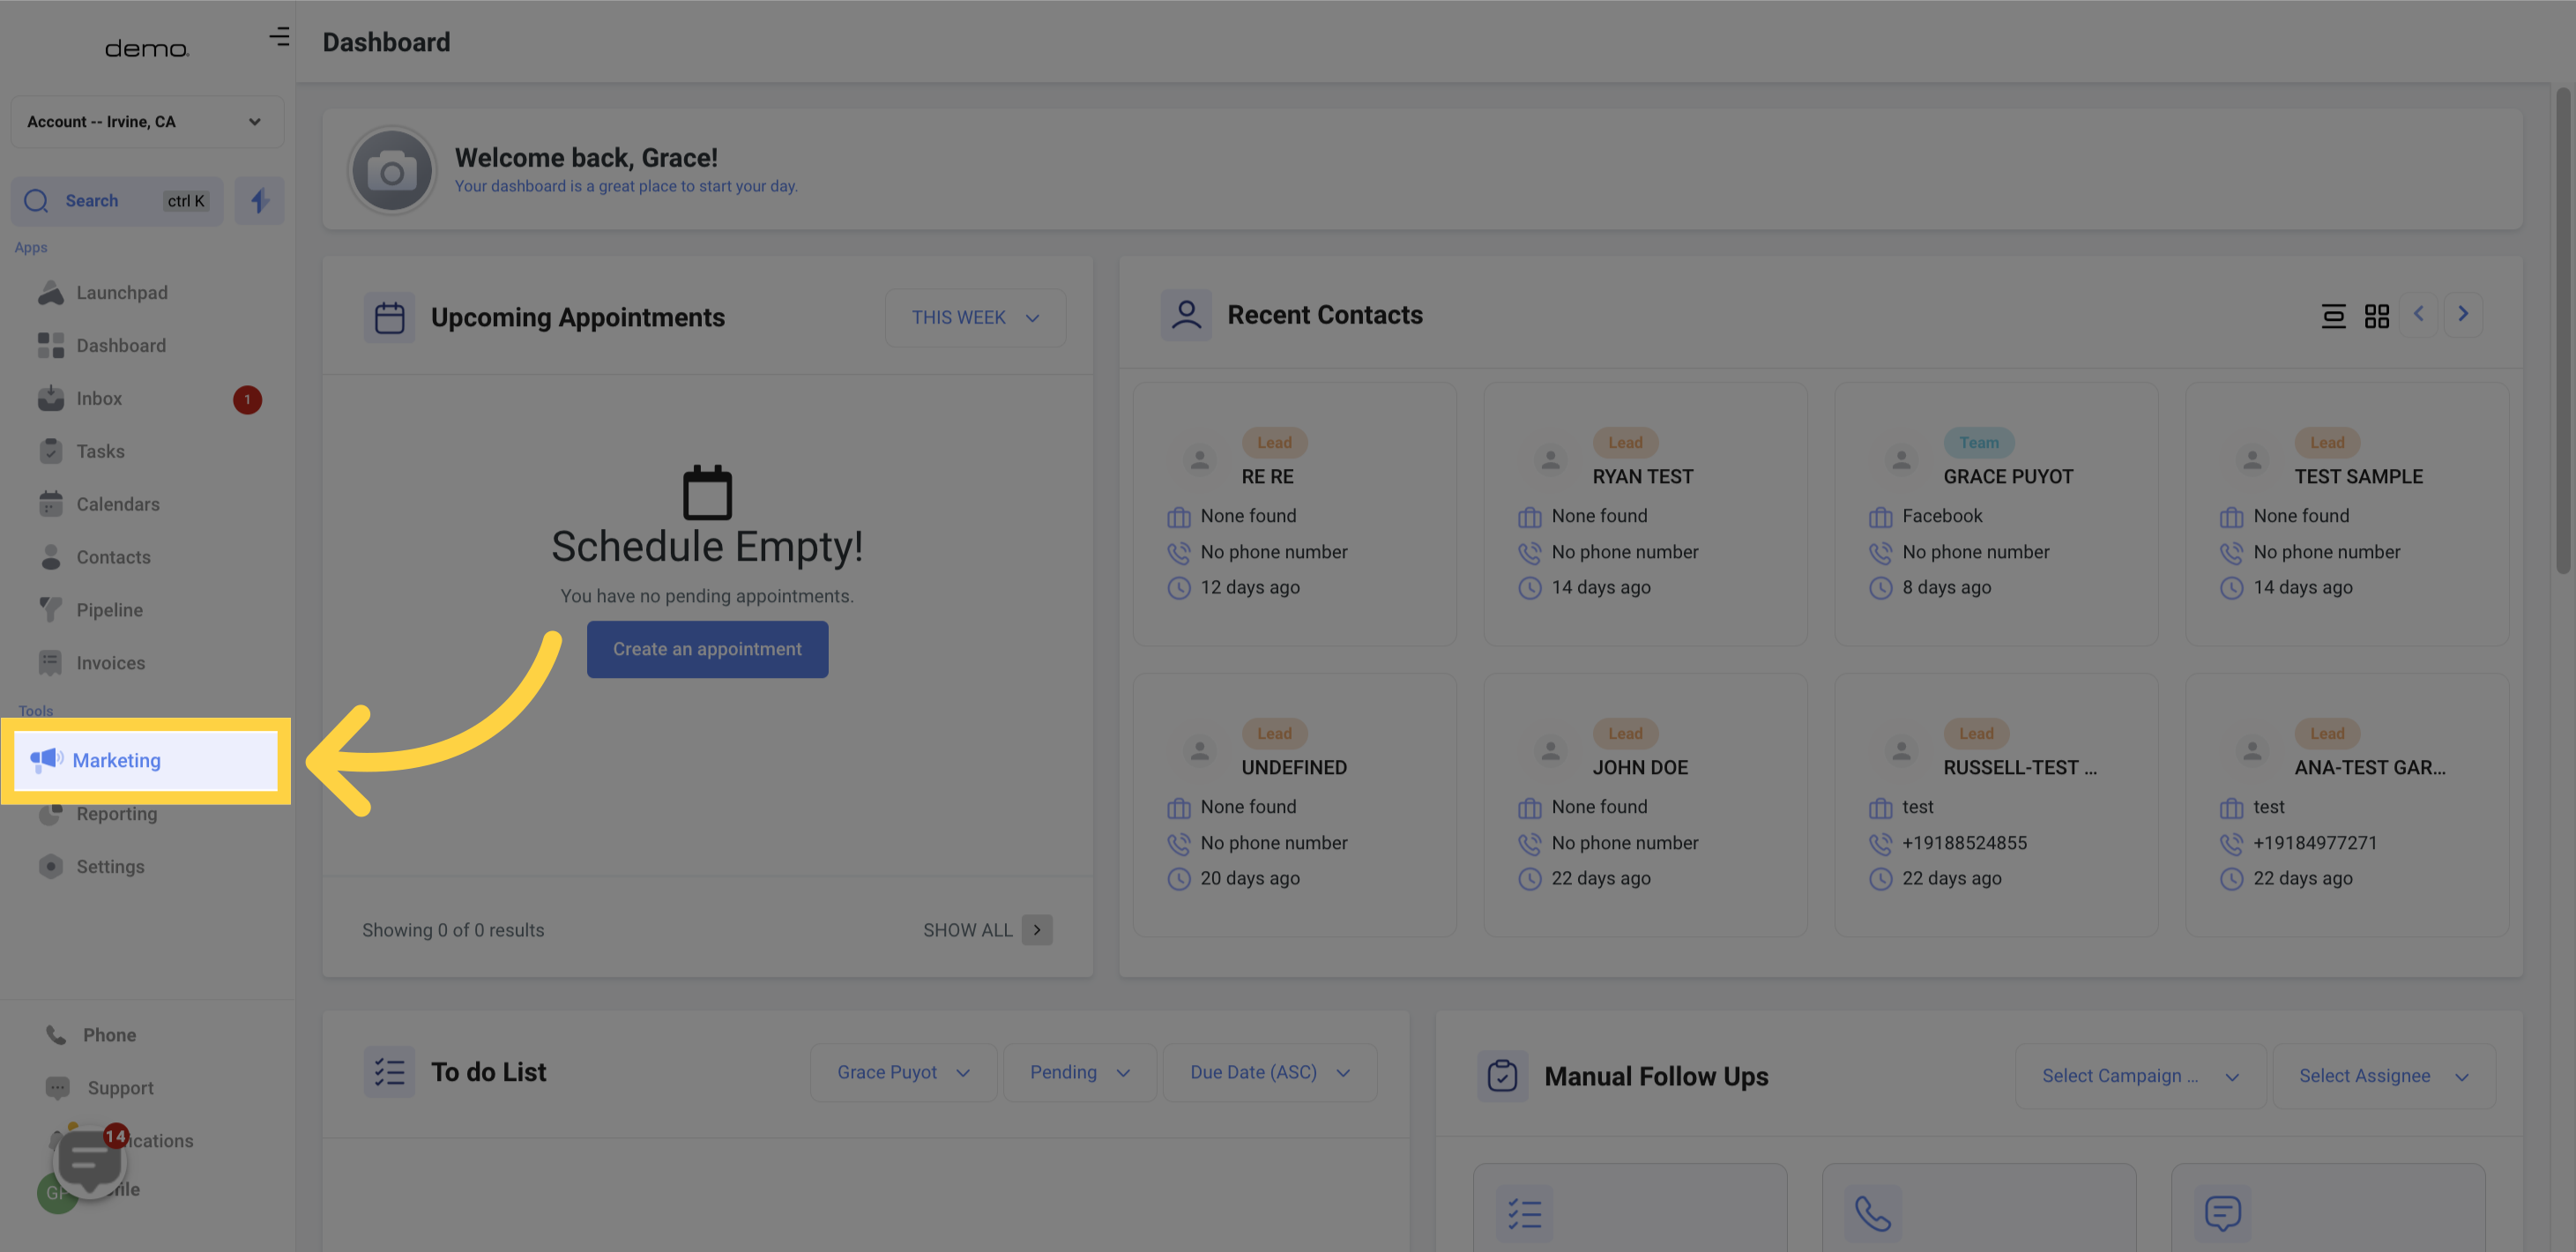
Click on the "Marketing" tab.
Click on the "Funnels" option.

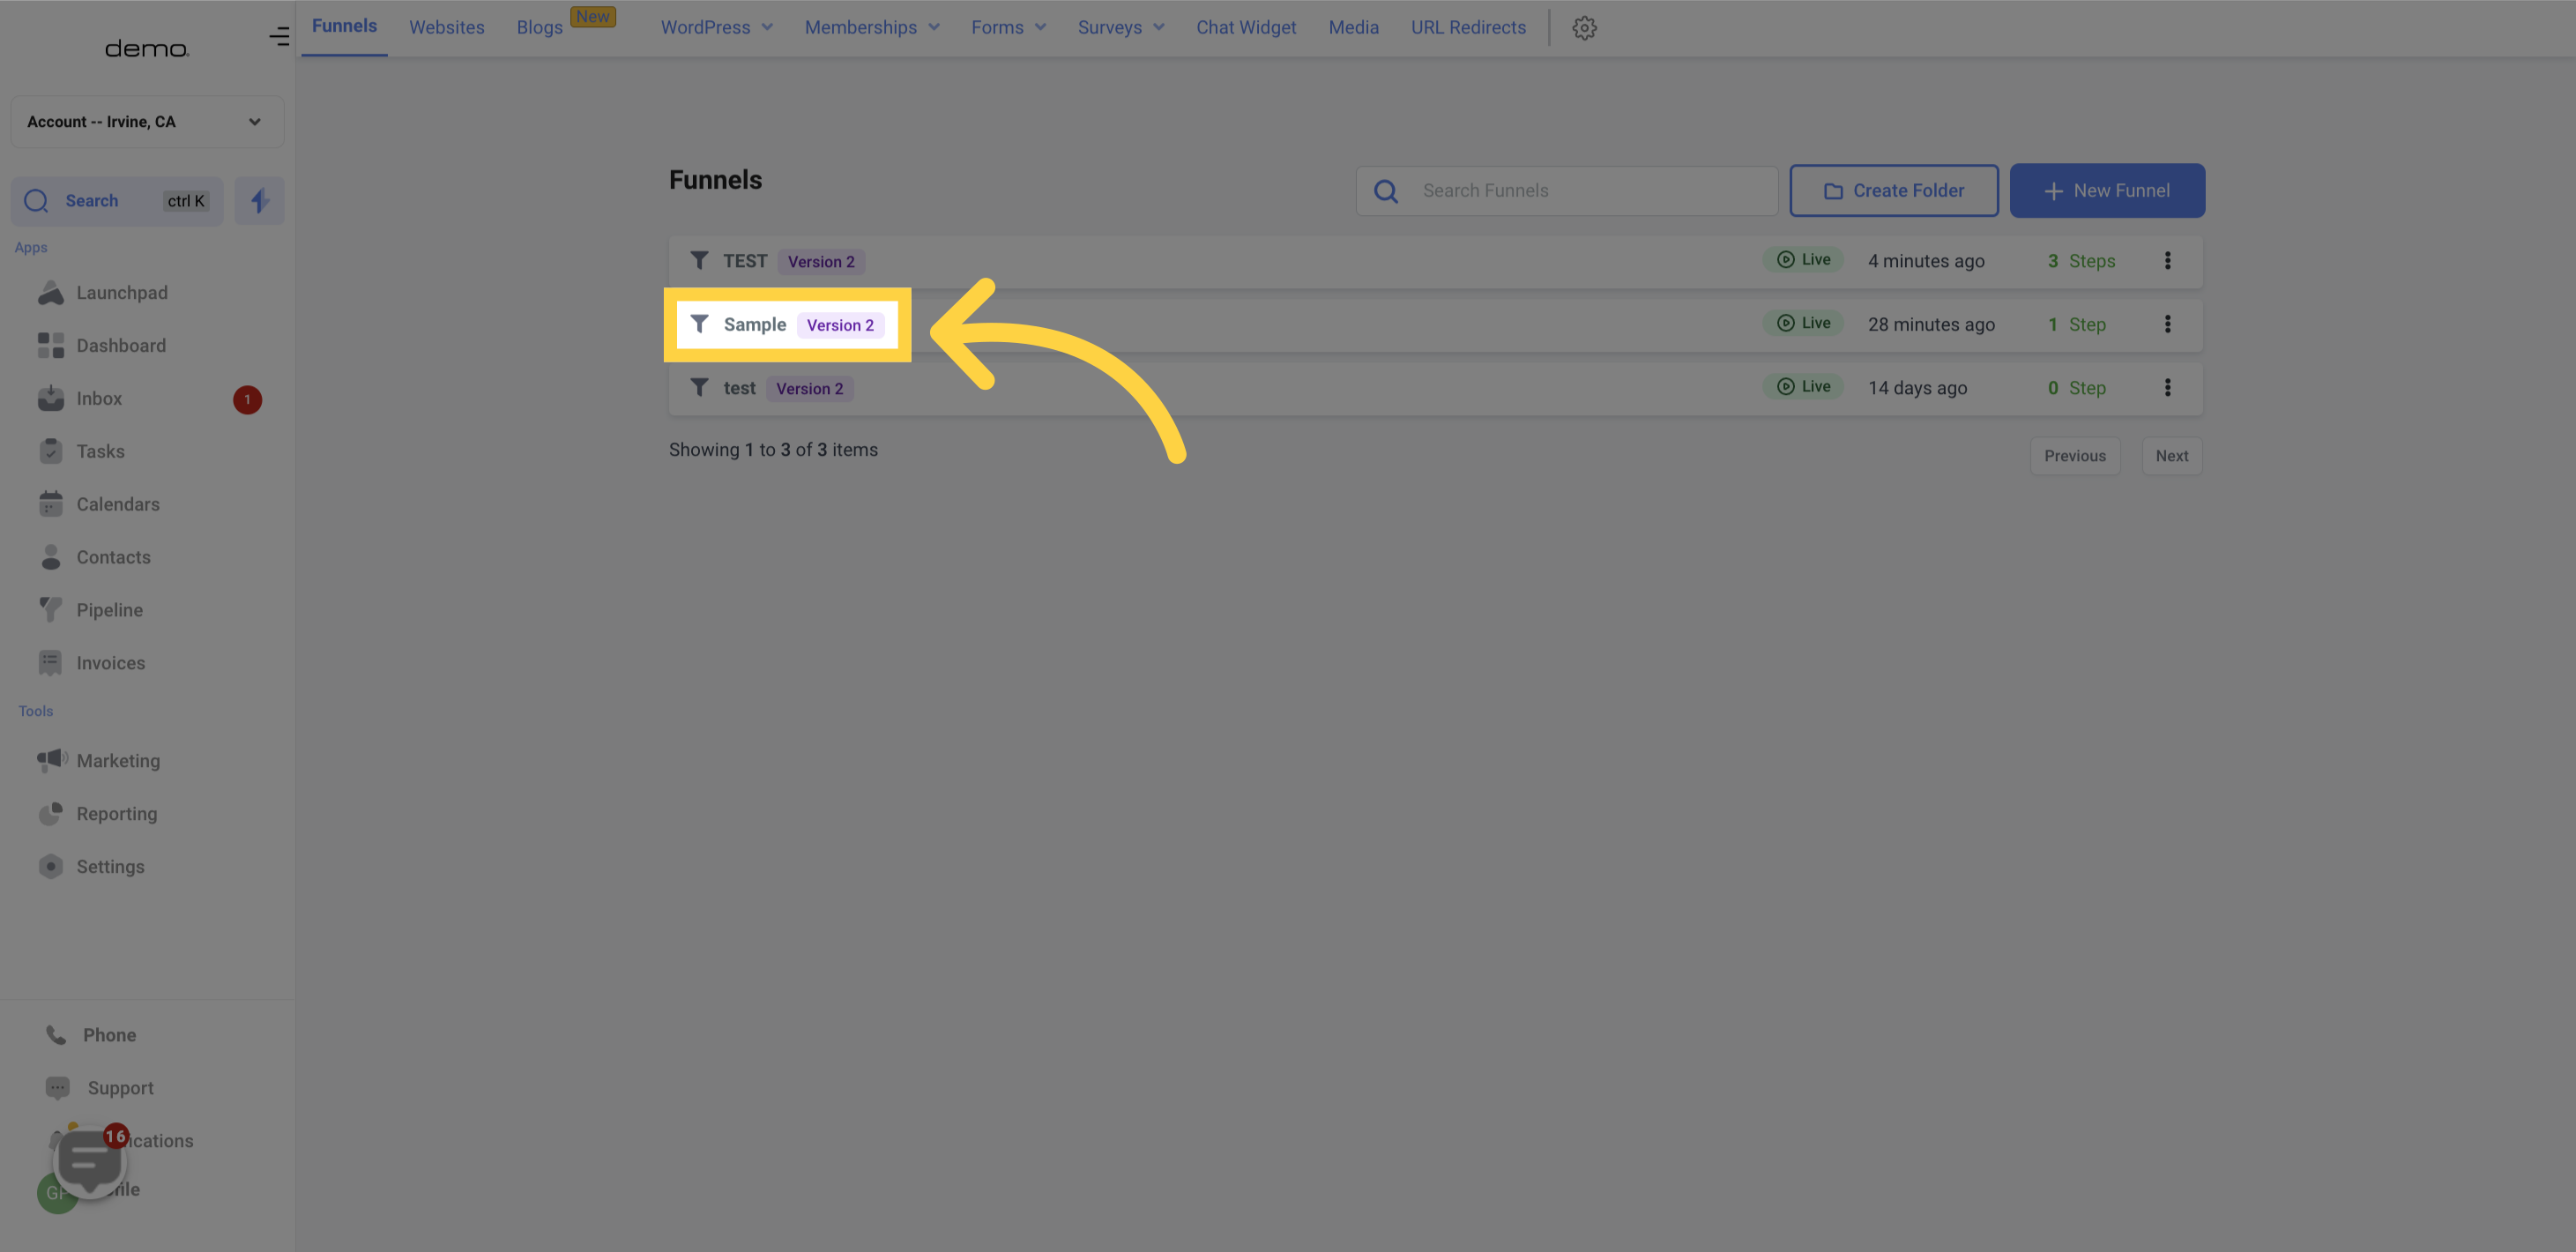
Select the desired funnel from the list.
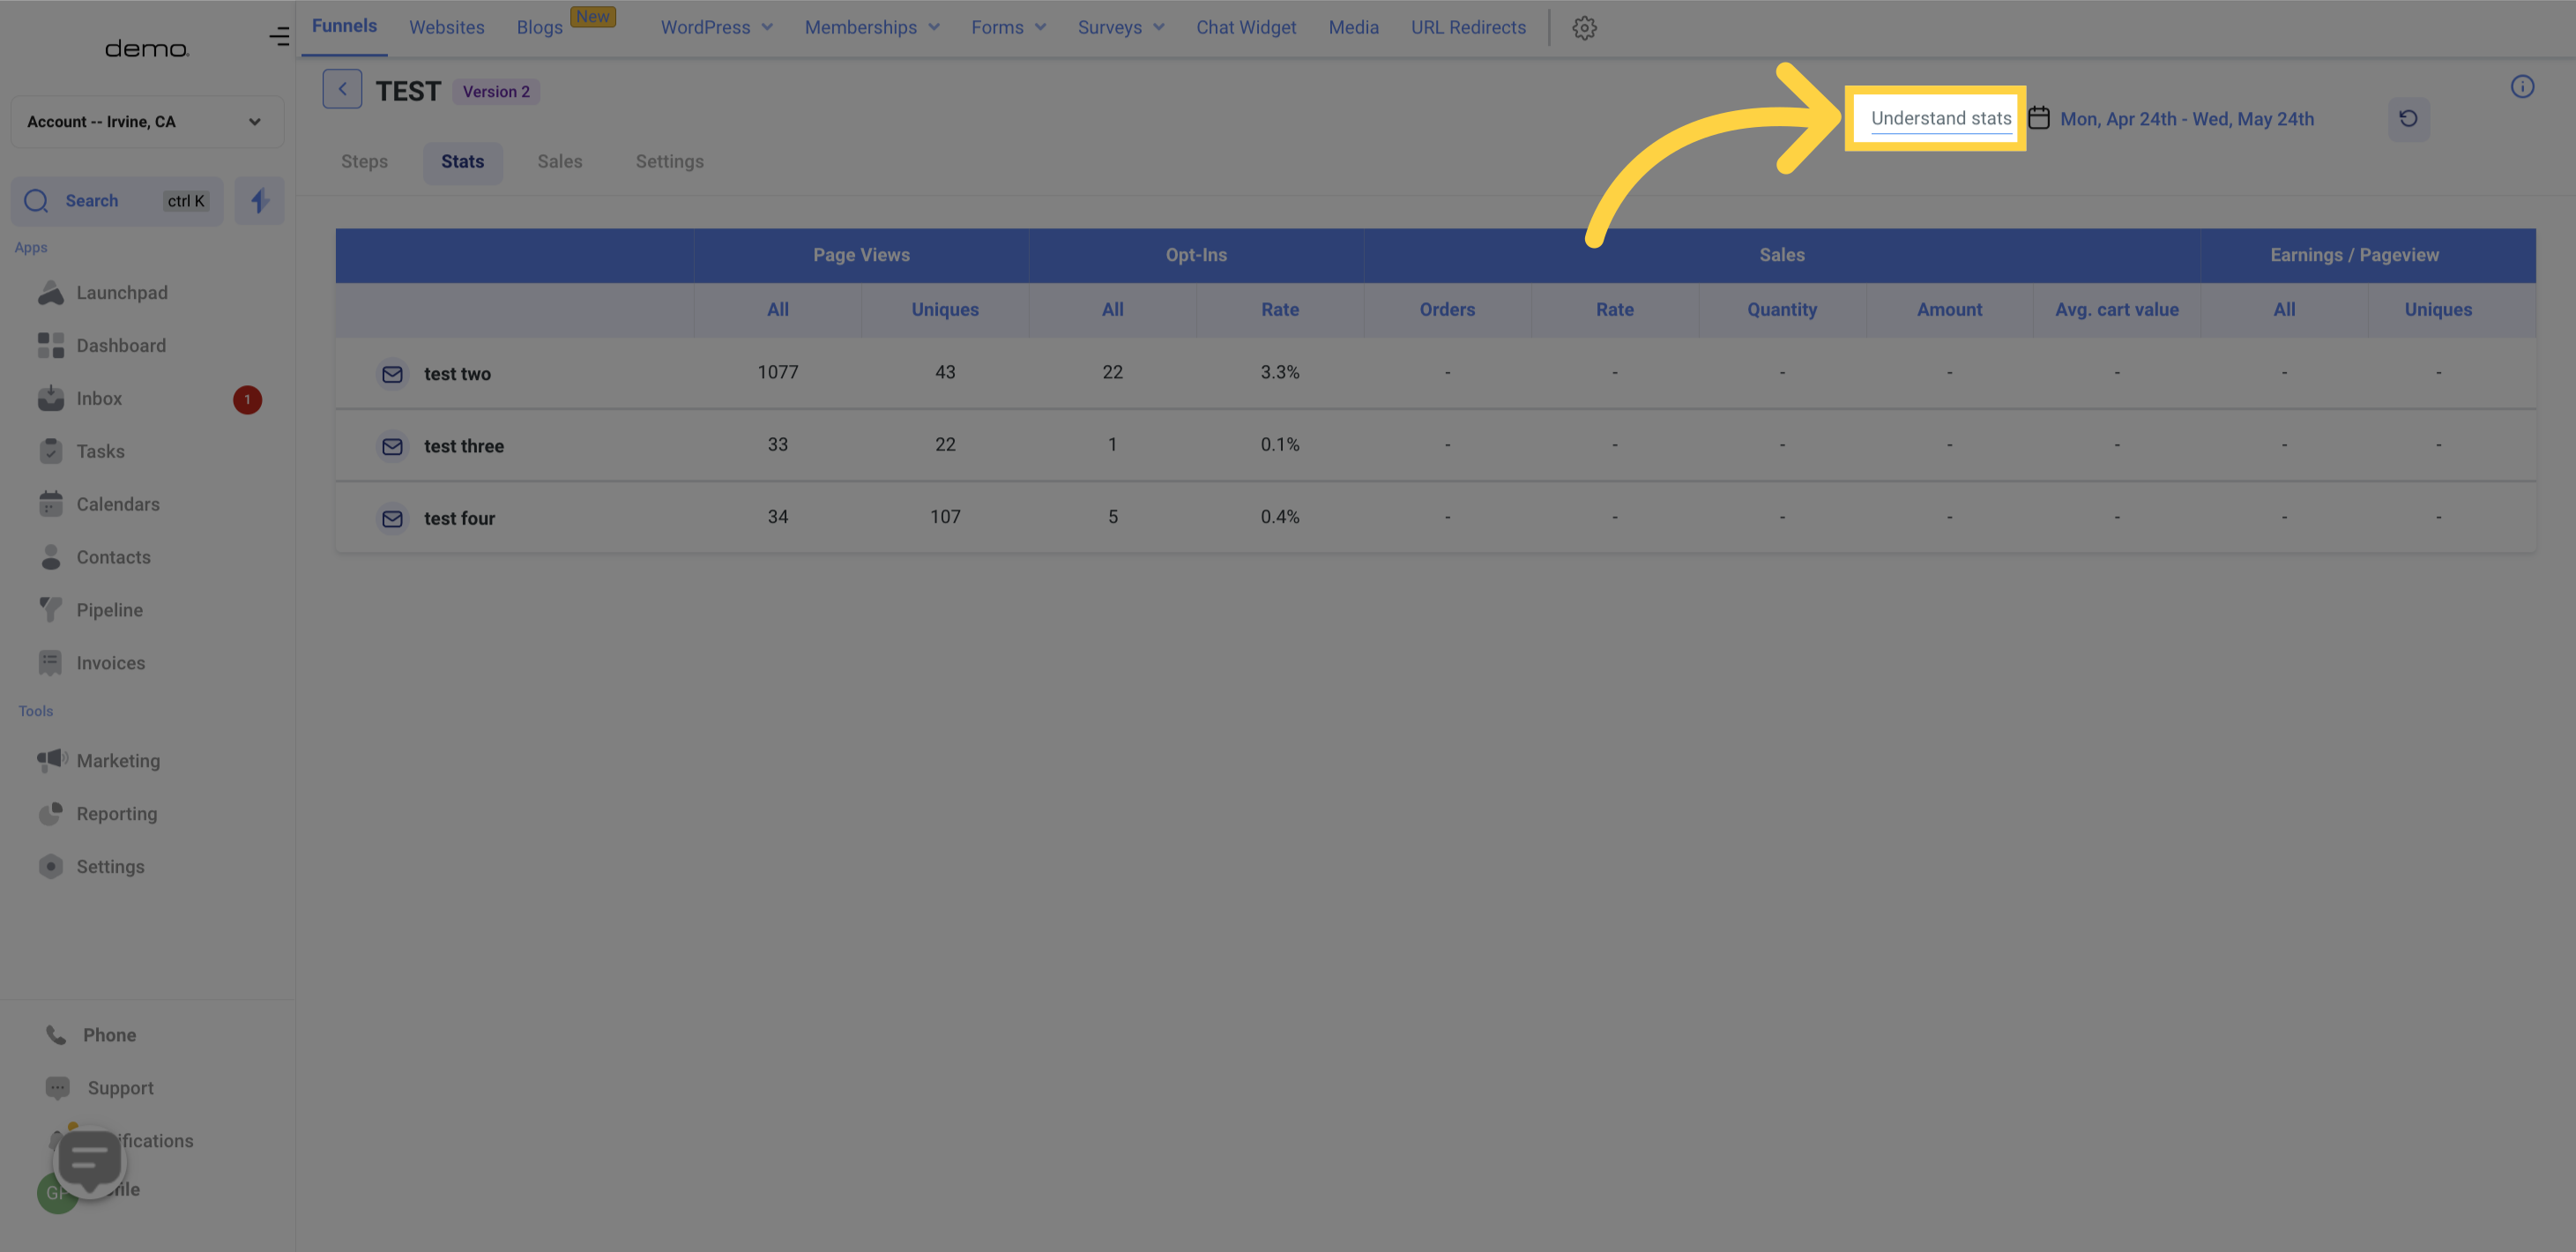
The Stats Tab displays the statistics of every step in your Funnel. It provides information on the number of visitors who opened your page and the actions they took on each page.
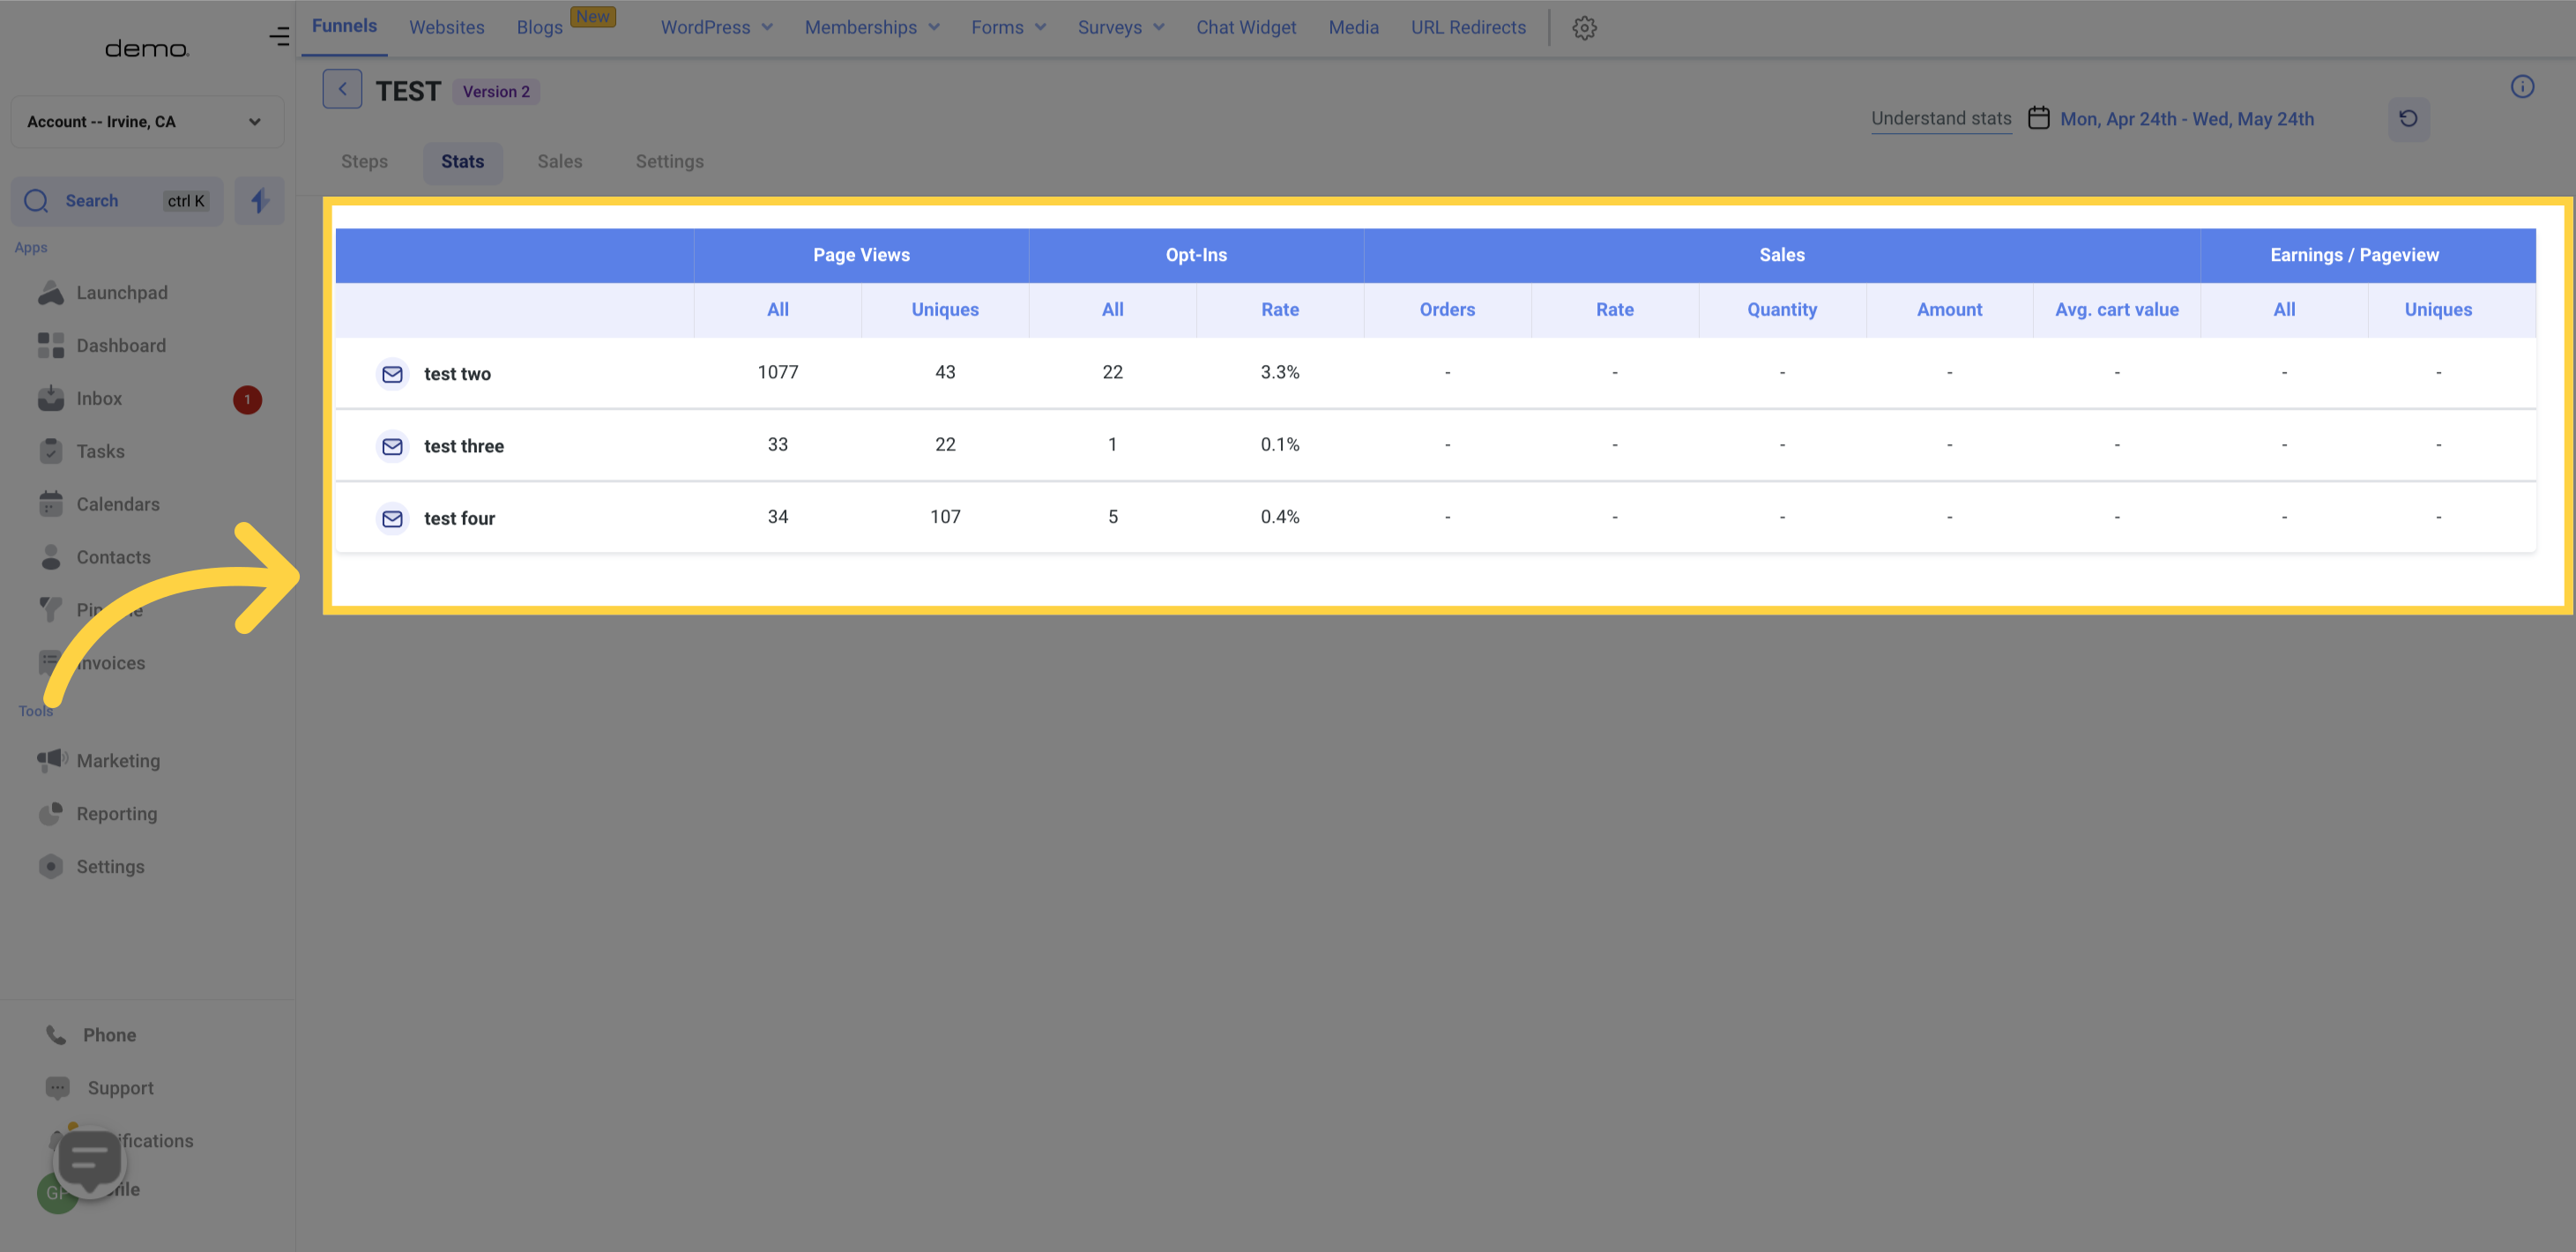
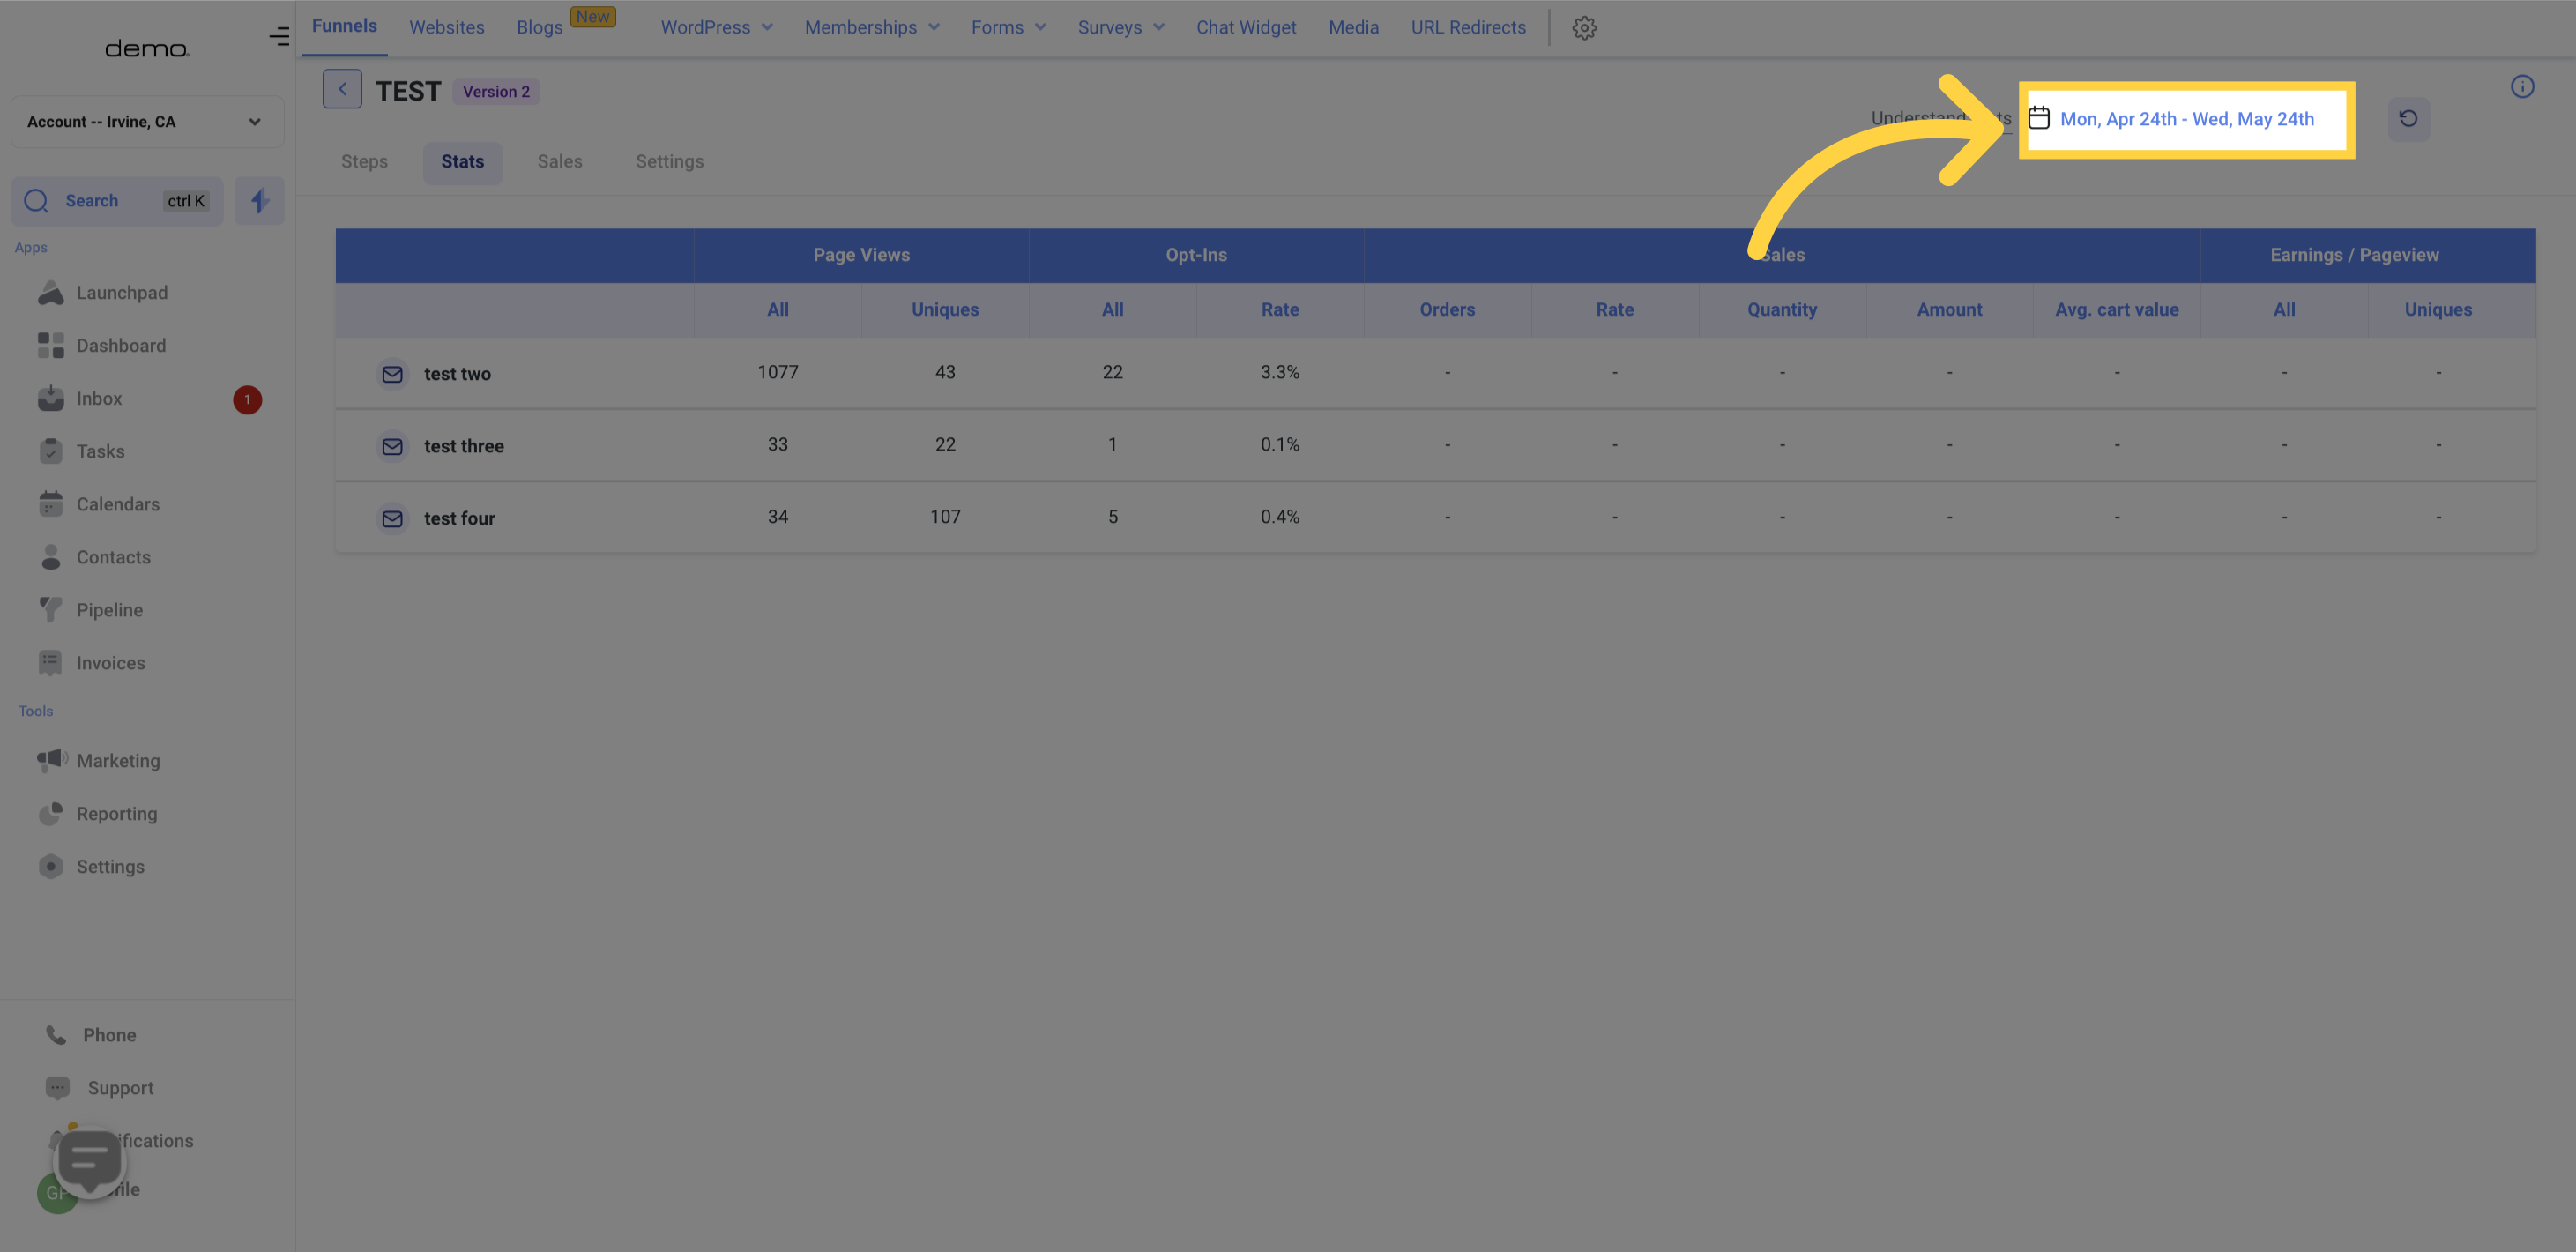
Access the stats tab and select the desired date range.
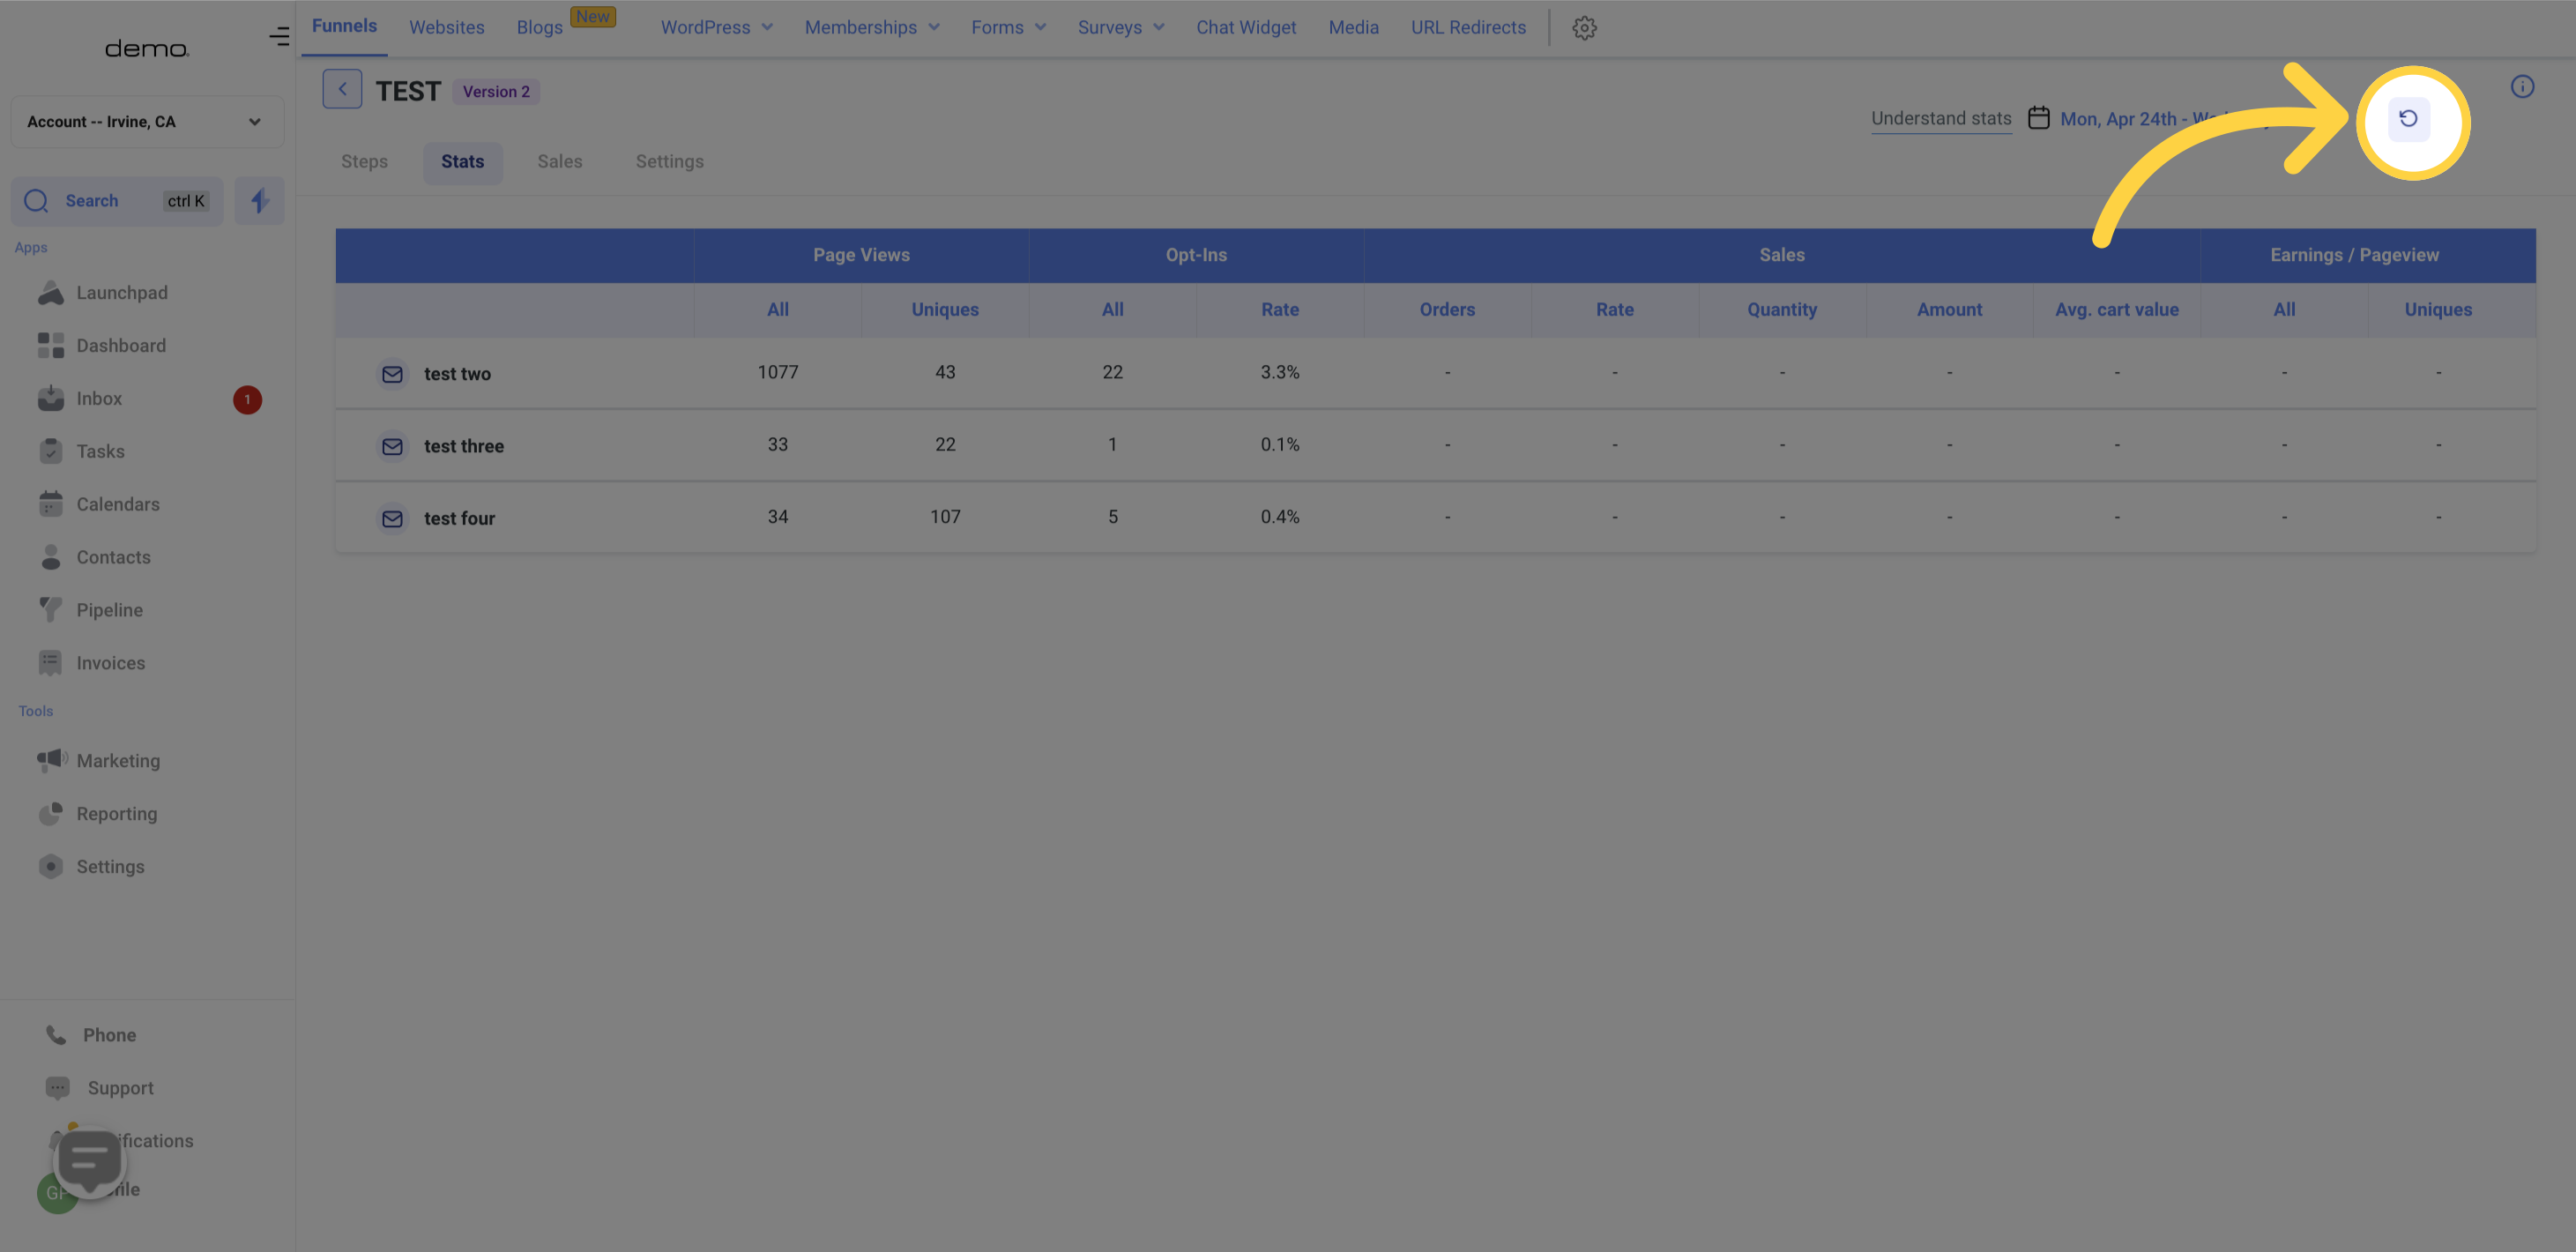
Clicking on the "Reset" icon erases all data from the Funnel. However, it is not recommended to reset the data as it permanently deletes all information.
Clicking on this icon provides additional information about the Funnel URL.
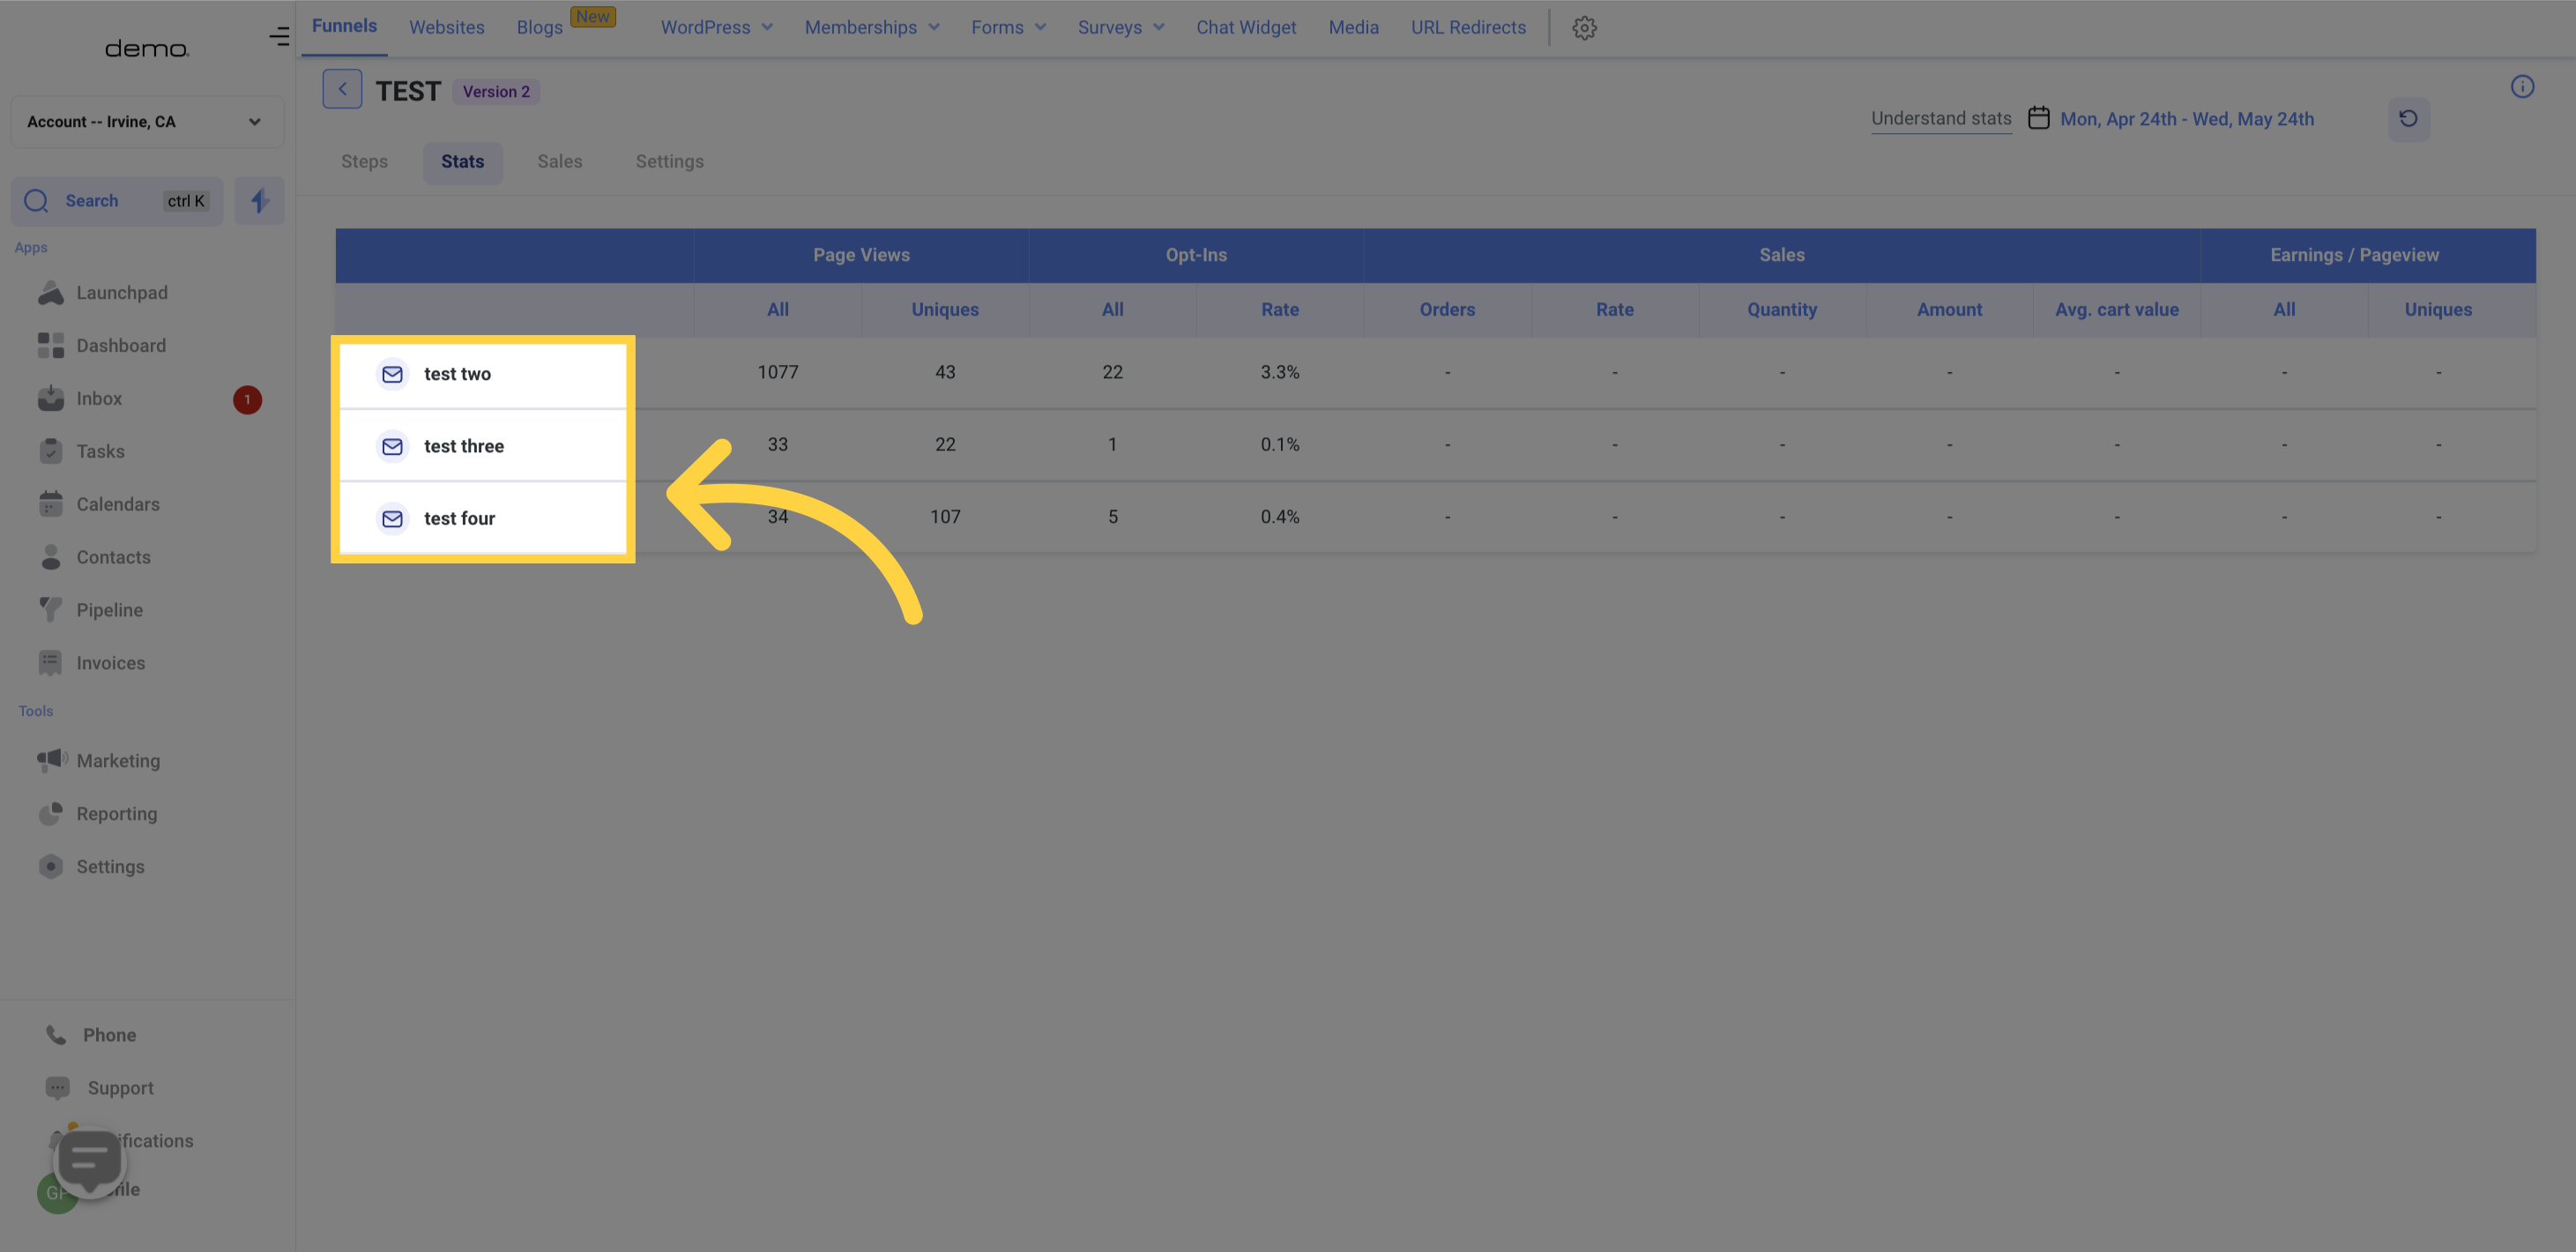
These are the various Funnel pages. You can click on each page to access its sub-pages (if any).
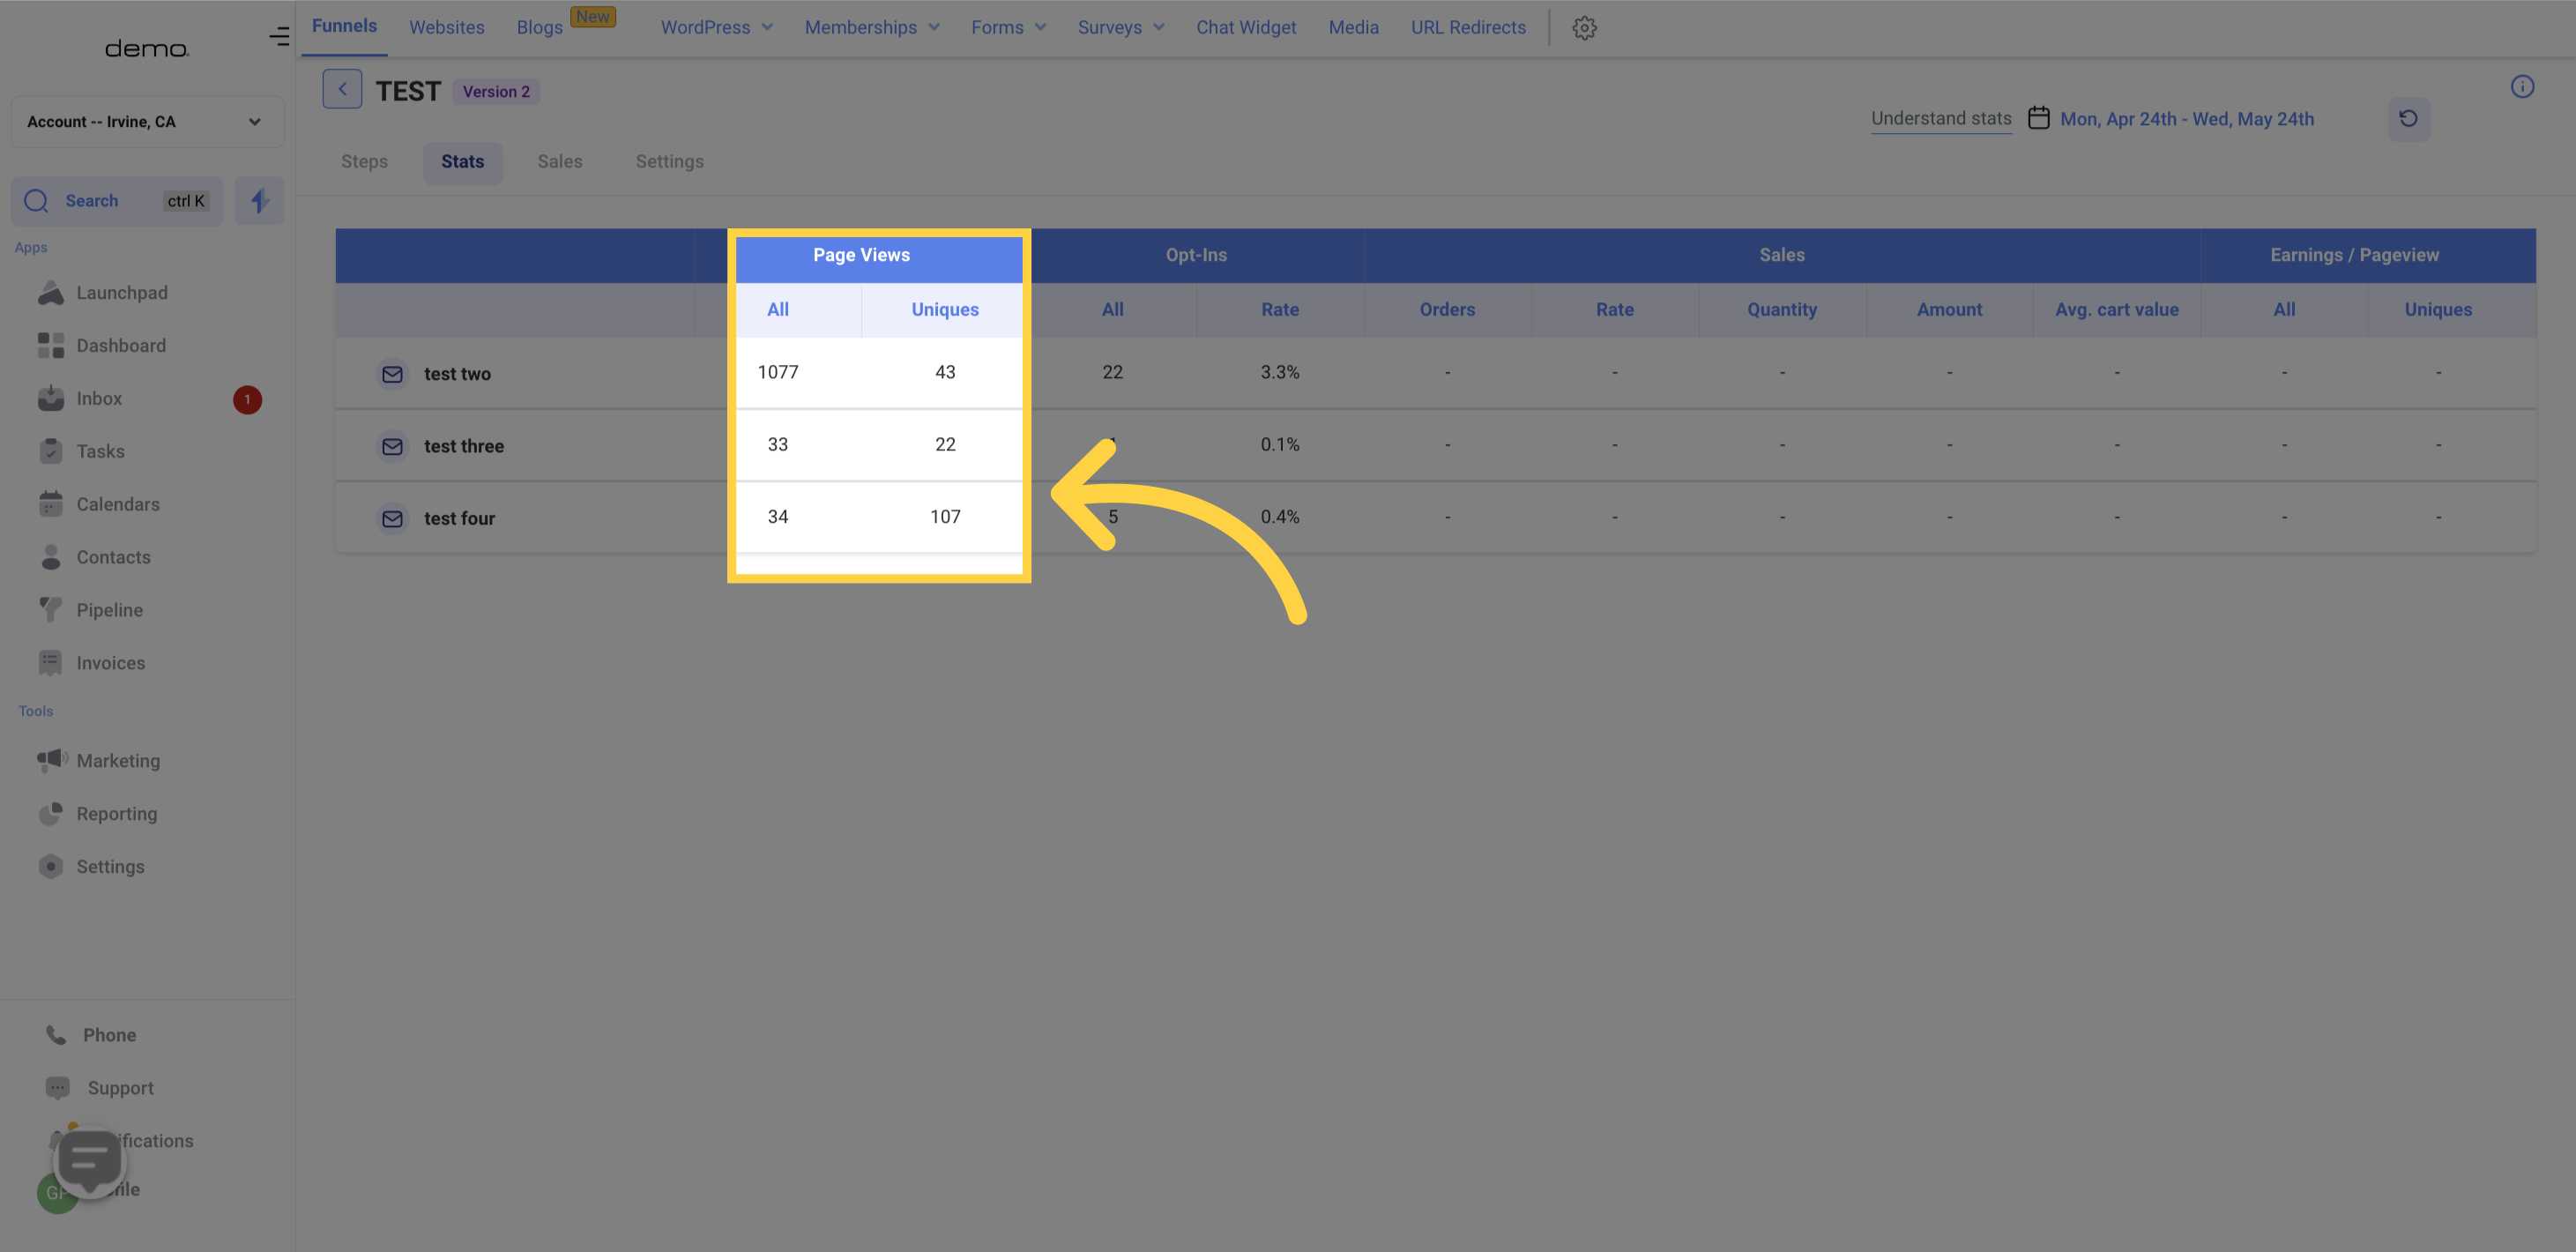
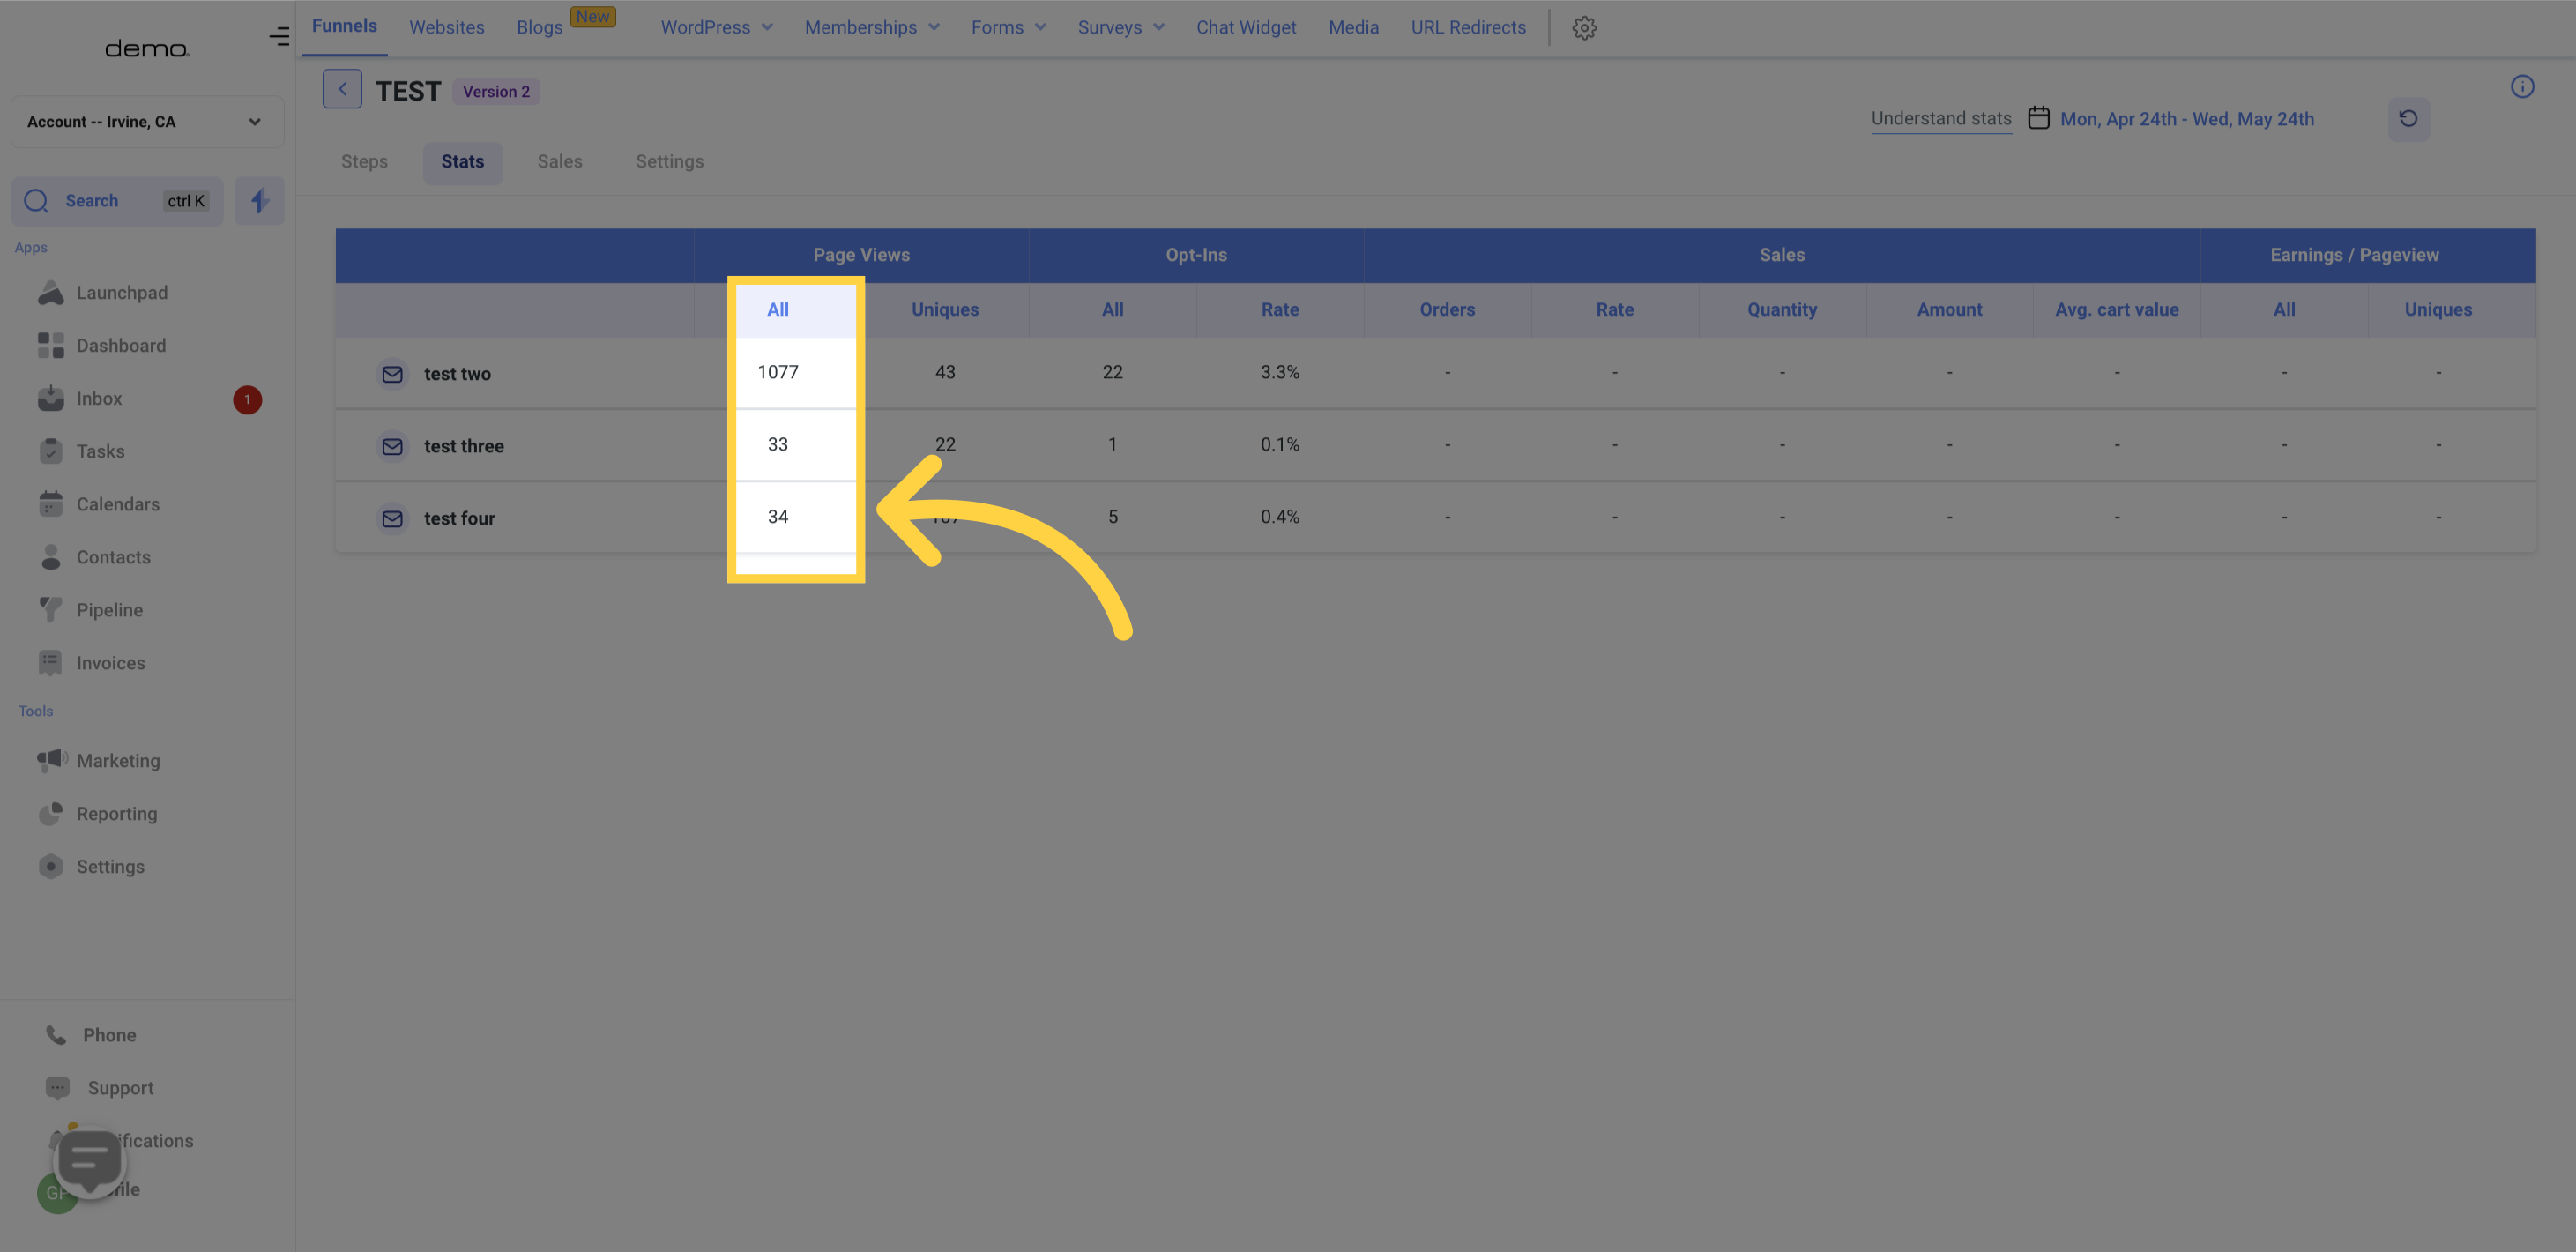
The "All" metric indicates the total number of times a particular Funnel page has been opened and viewed by visitors, both new and returning. For example, if a returning visitor opens a page five times and a new visitor also opens the page, the "All" data will record a total of 6 (the returning visitor's five views and the new visitor's one view).
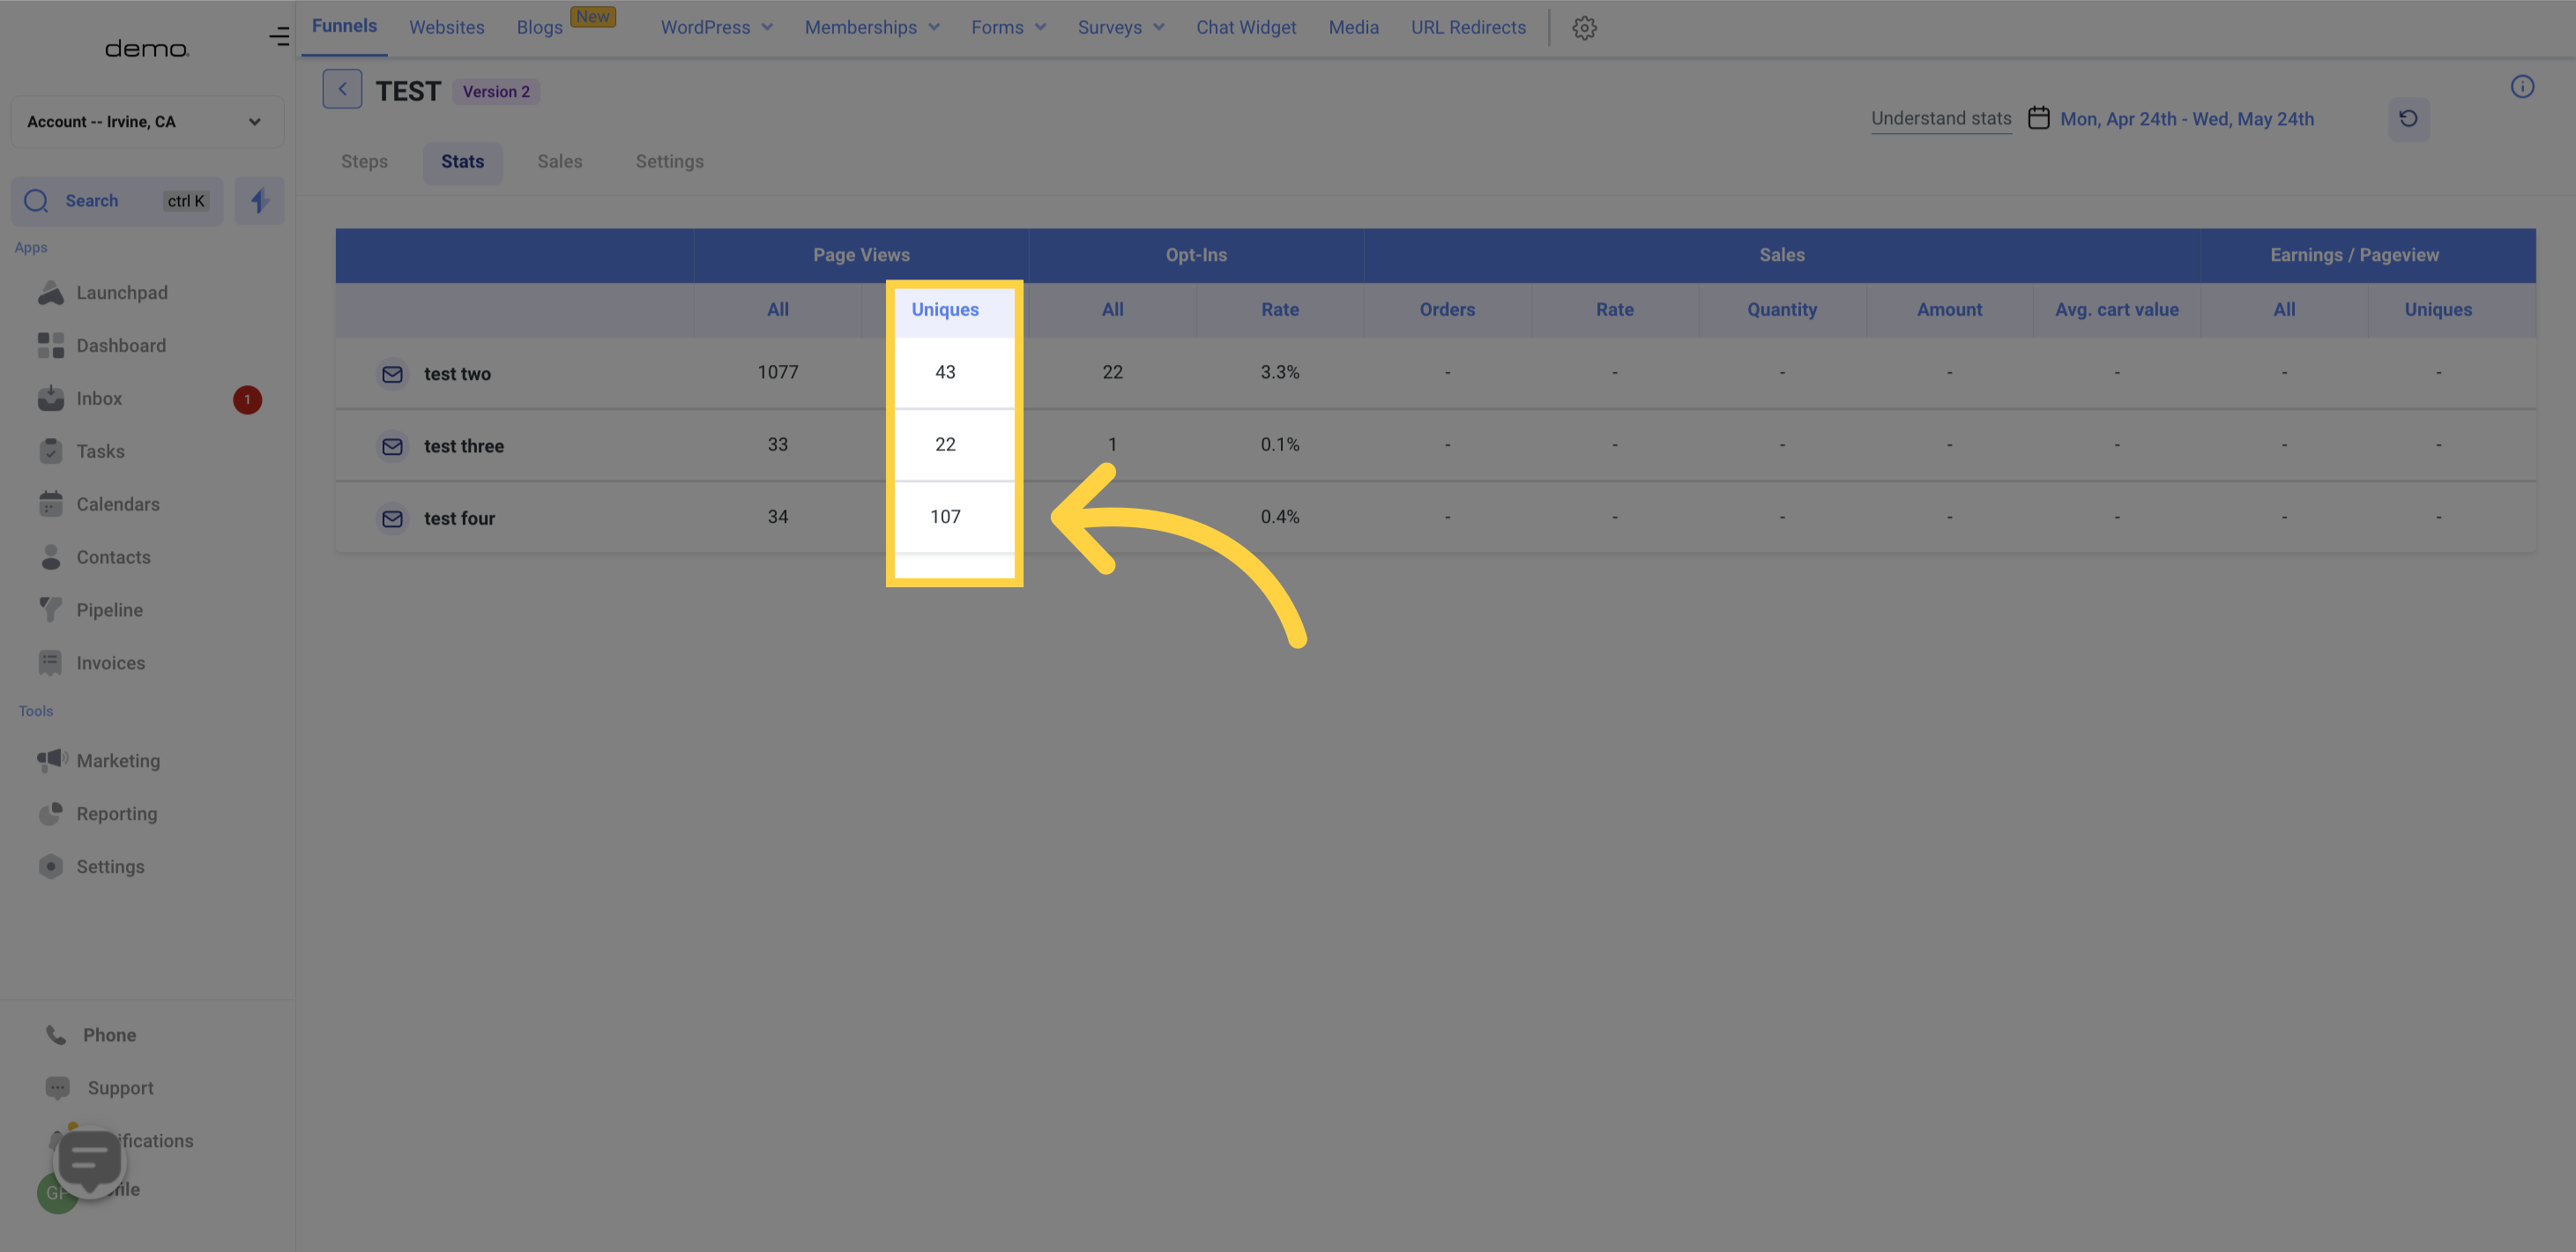
On the other hand, the "Uniques" metric collects data on the number of unique, first-time visitors that open the Funnel page. For instance, even if a returning visitor opens a page five times and a new visitor also opens the page, the "Unique" data will only record a total of 1 (the new visitor's single view).
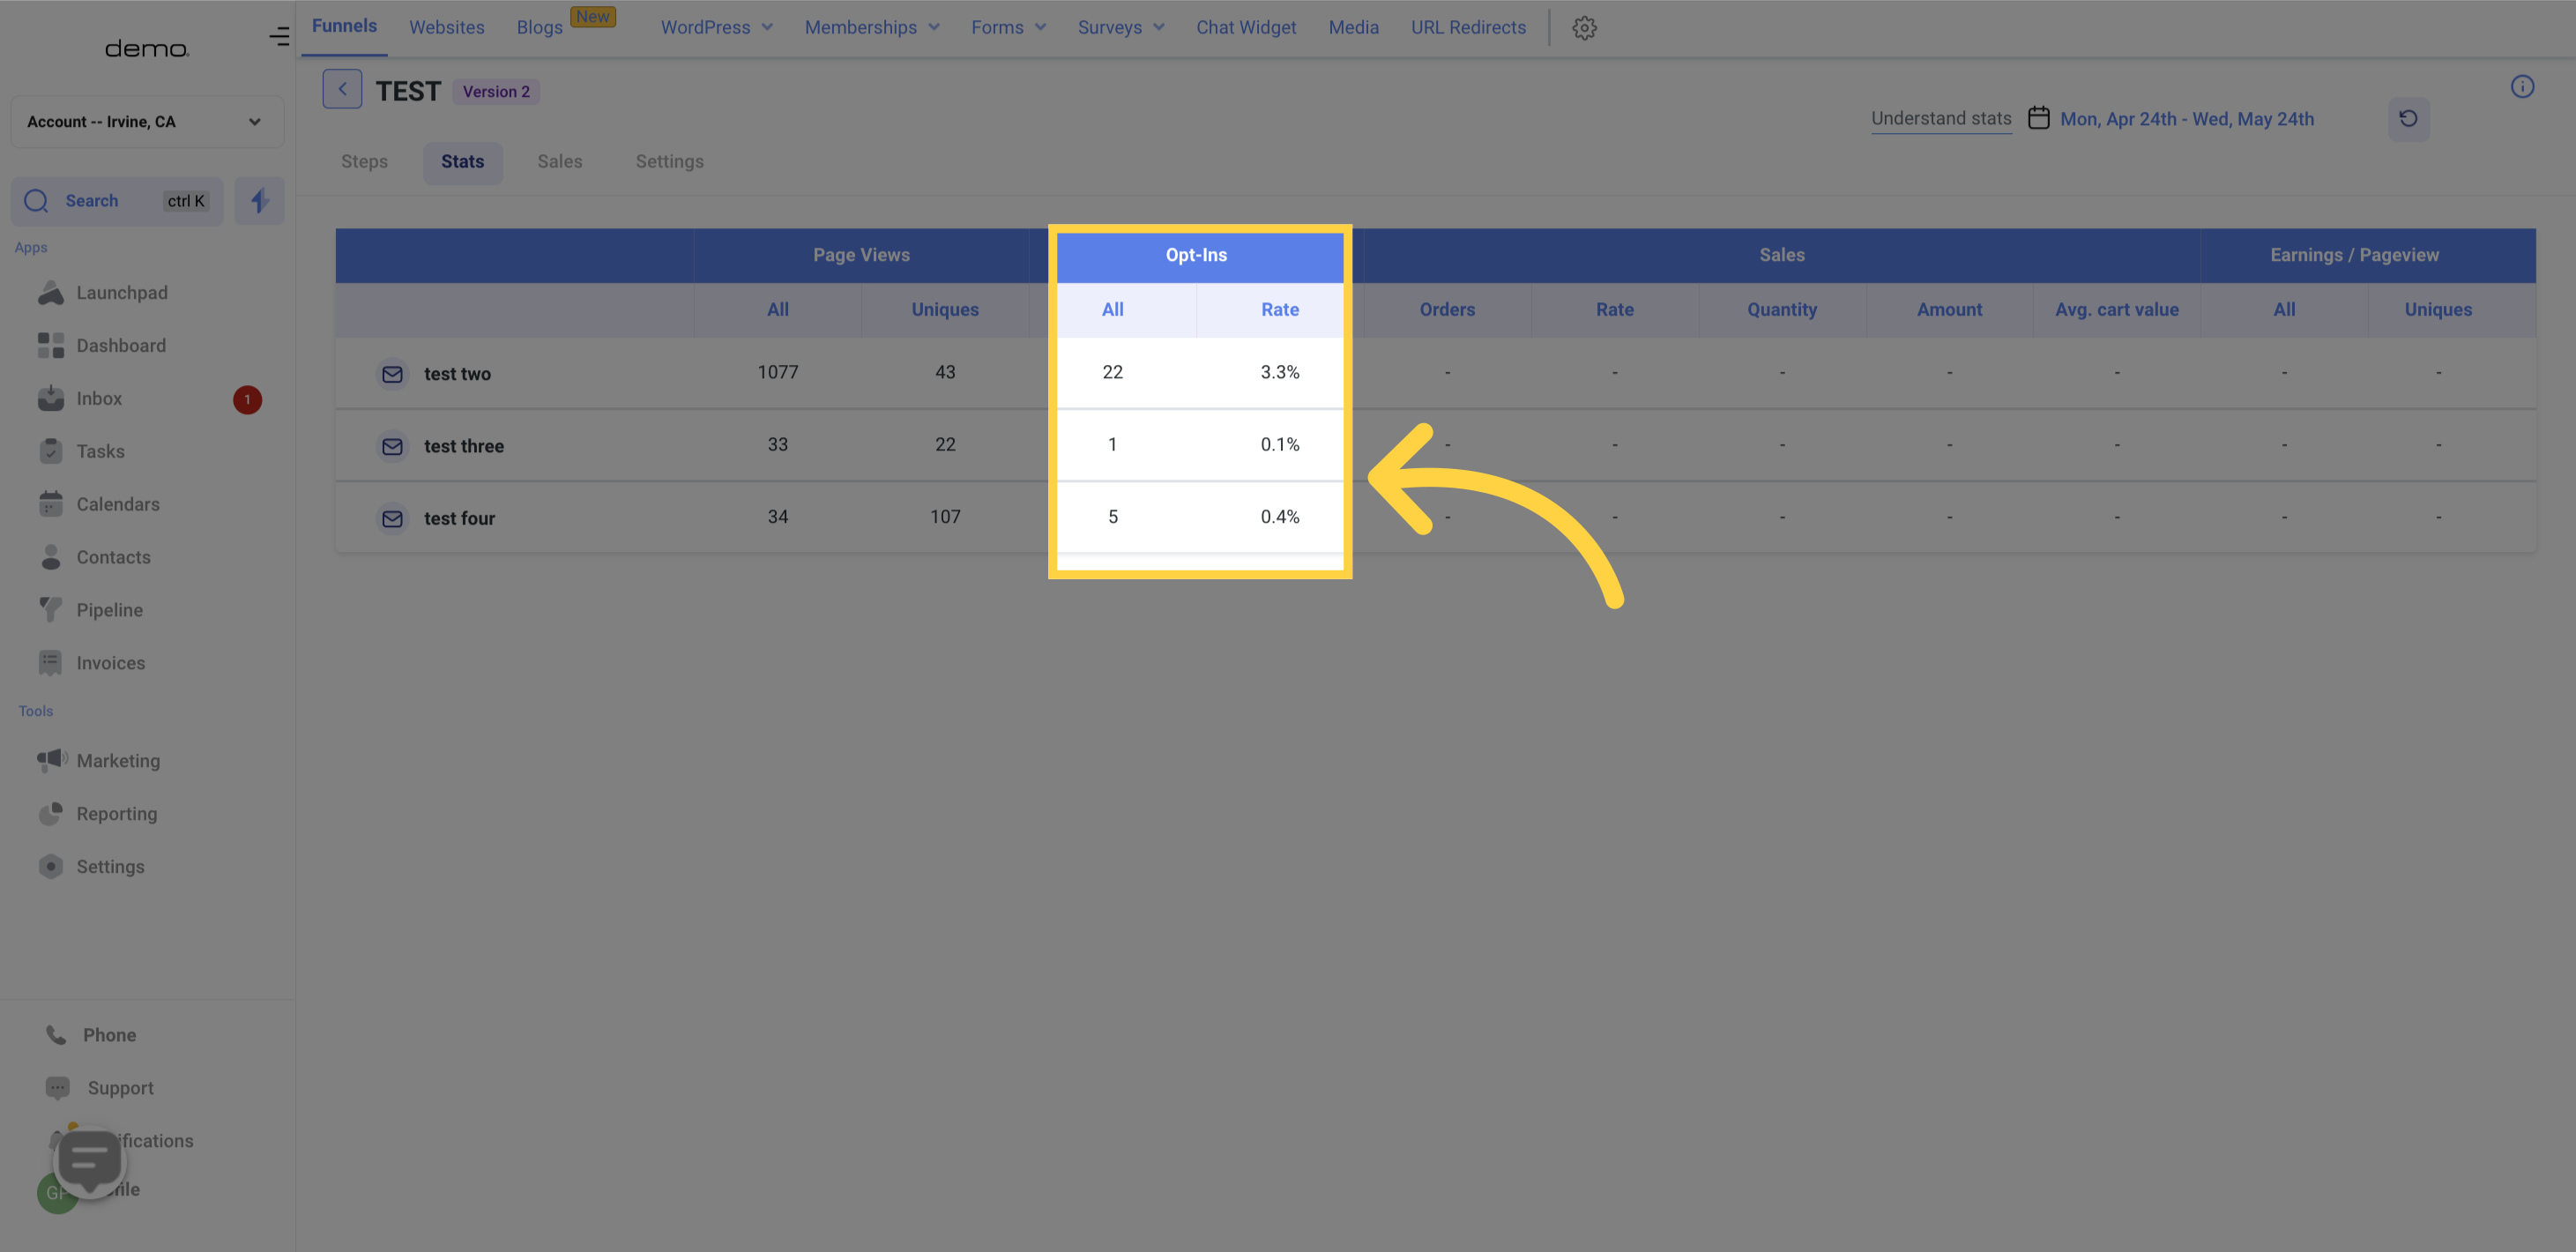
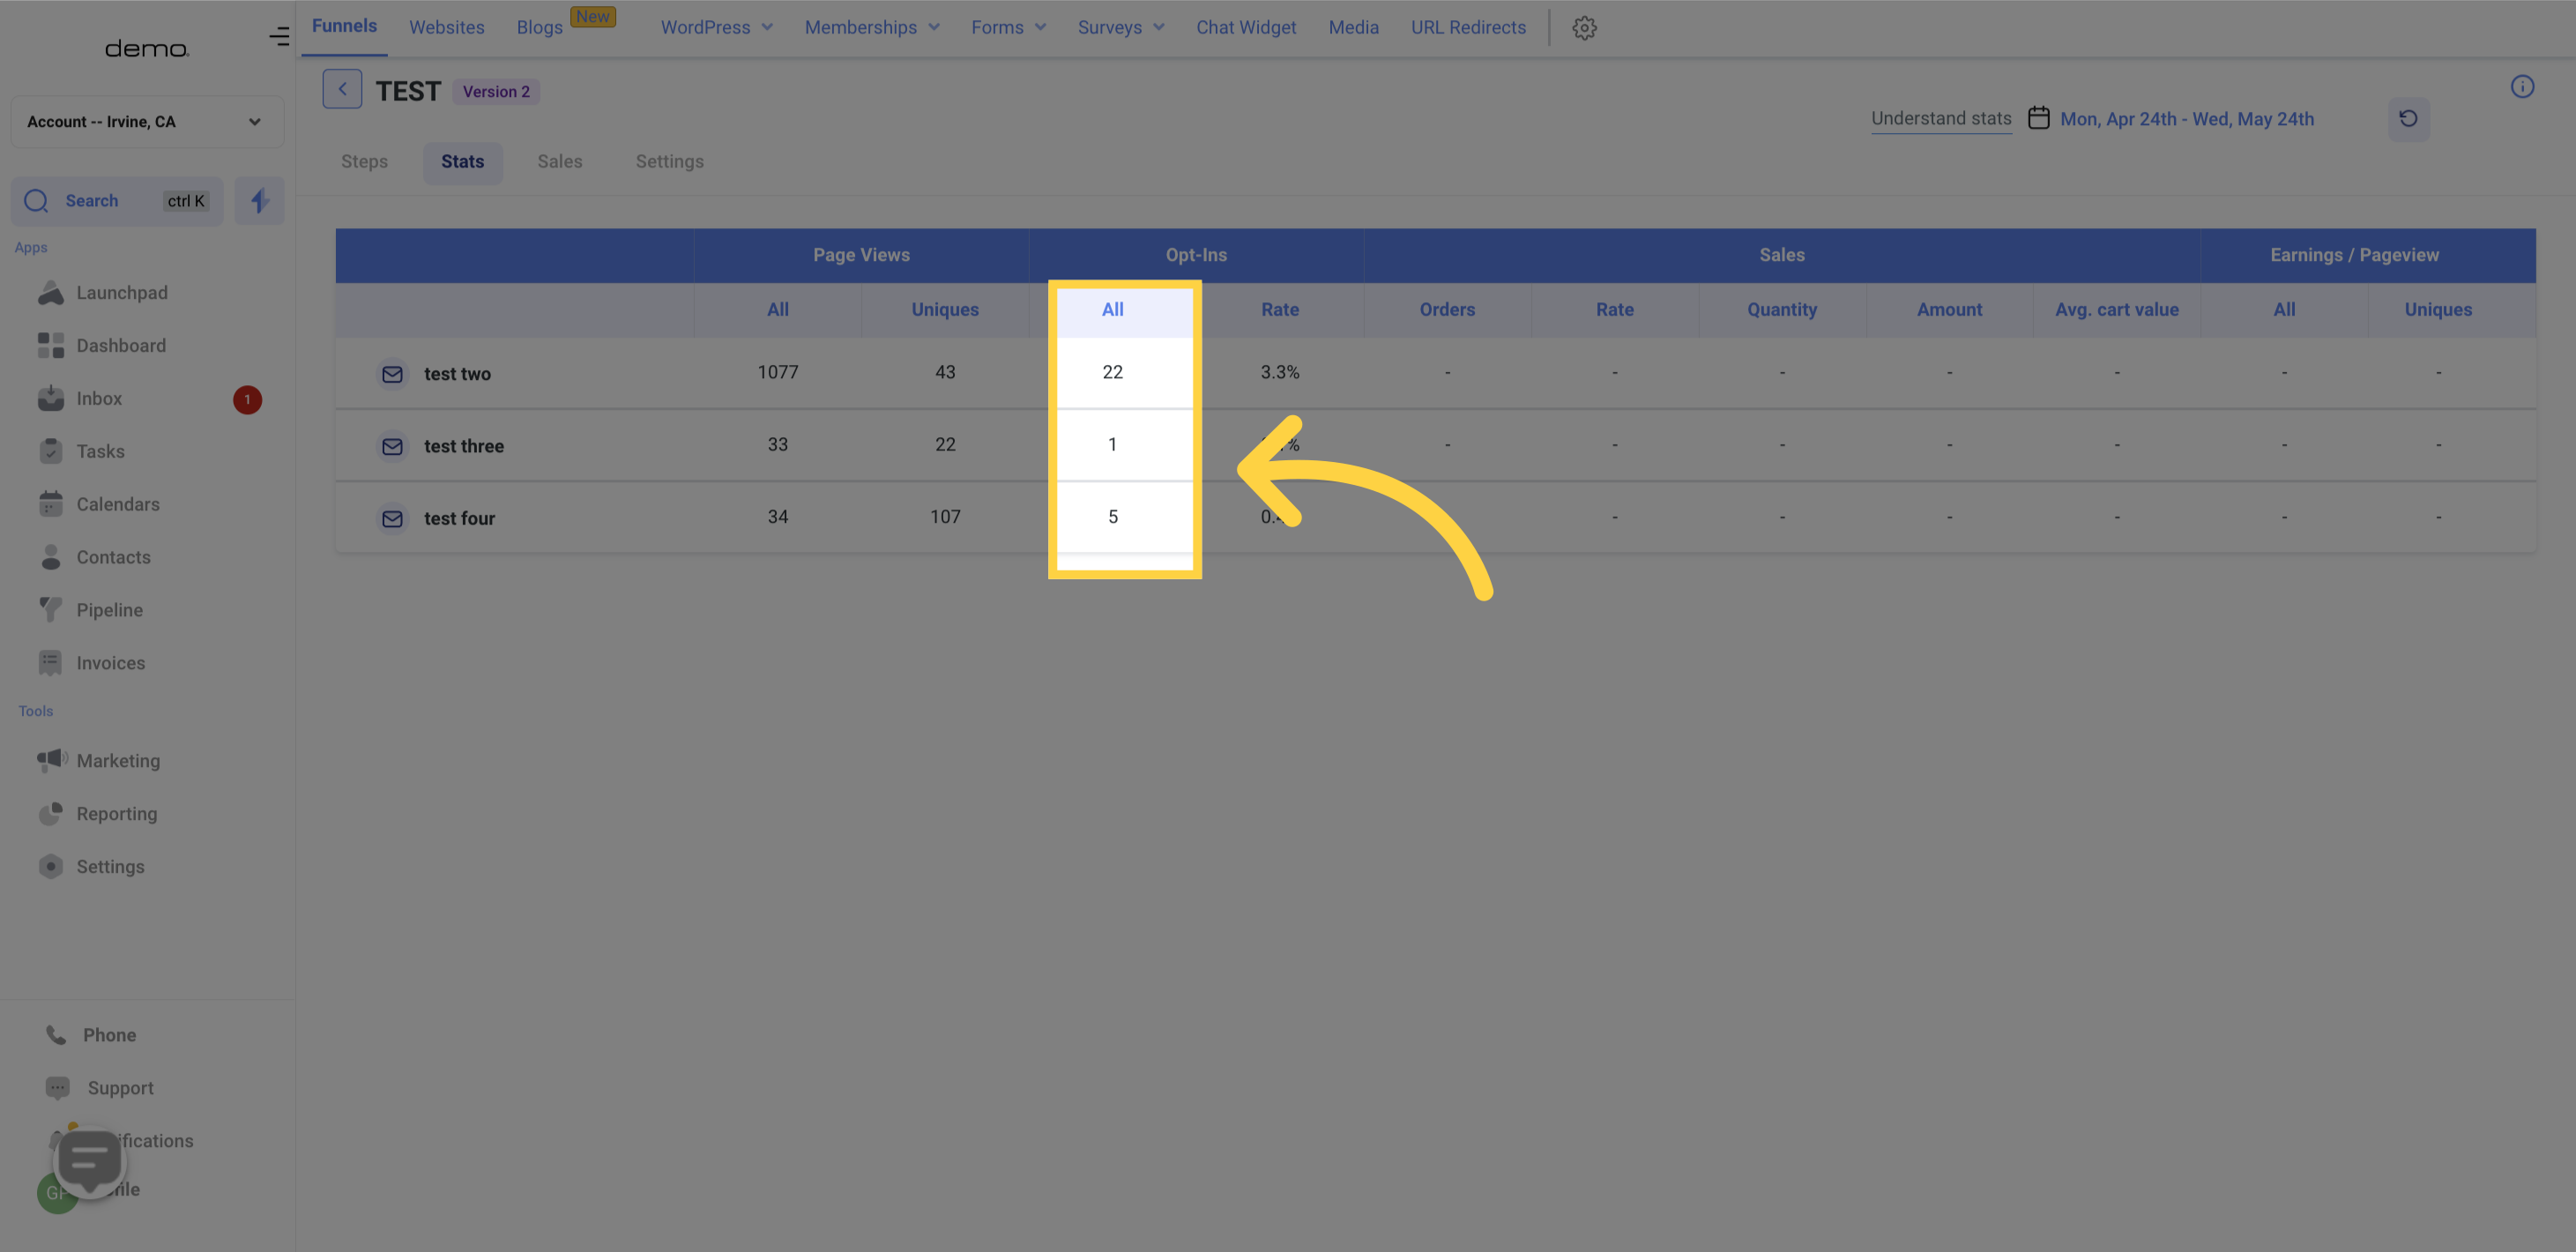
The "All" column displays the total number of users who either opted in for a product, purchased it, submitted a form/survey, or booked an appointment through a calendar on that particular Funnel page
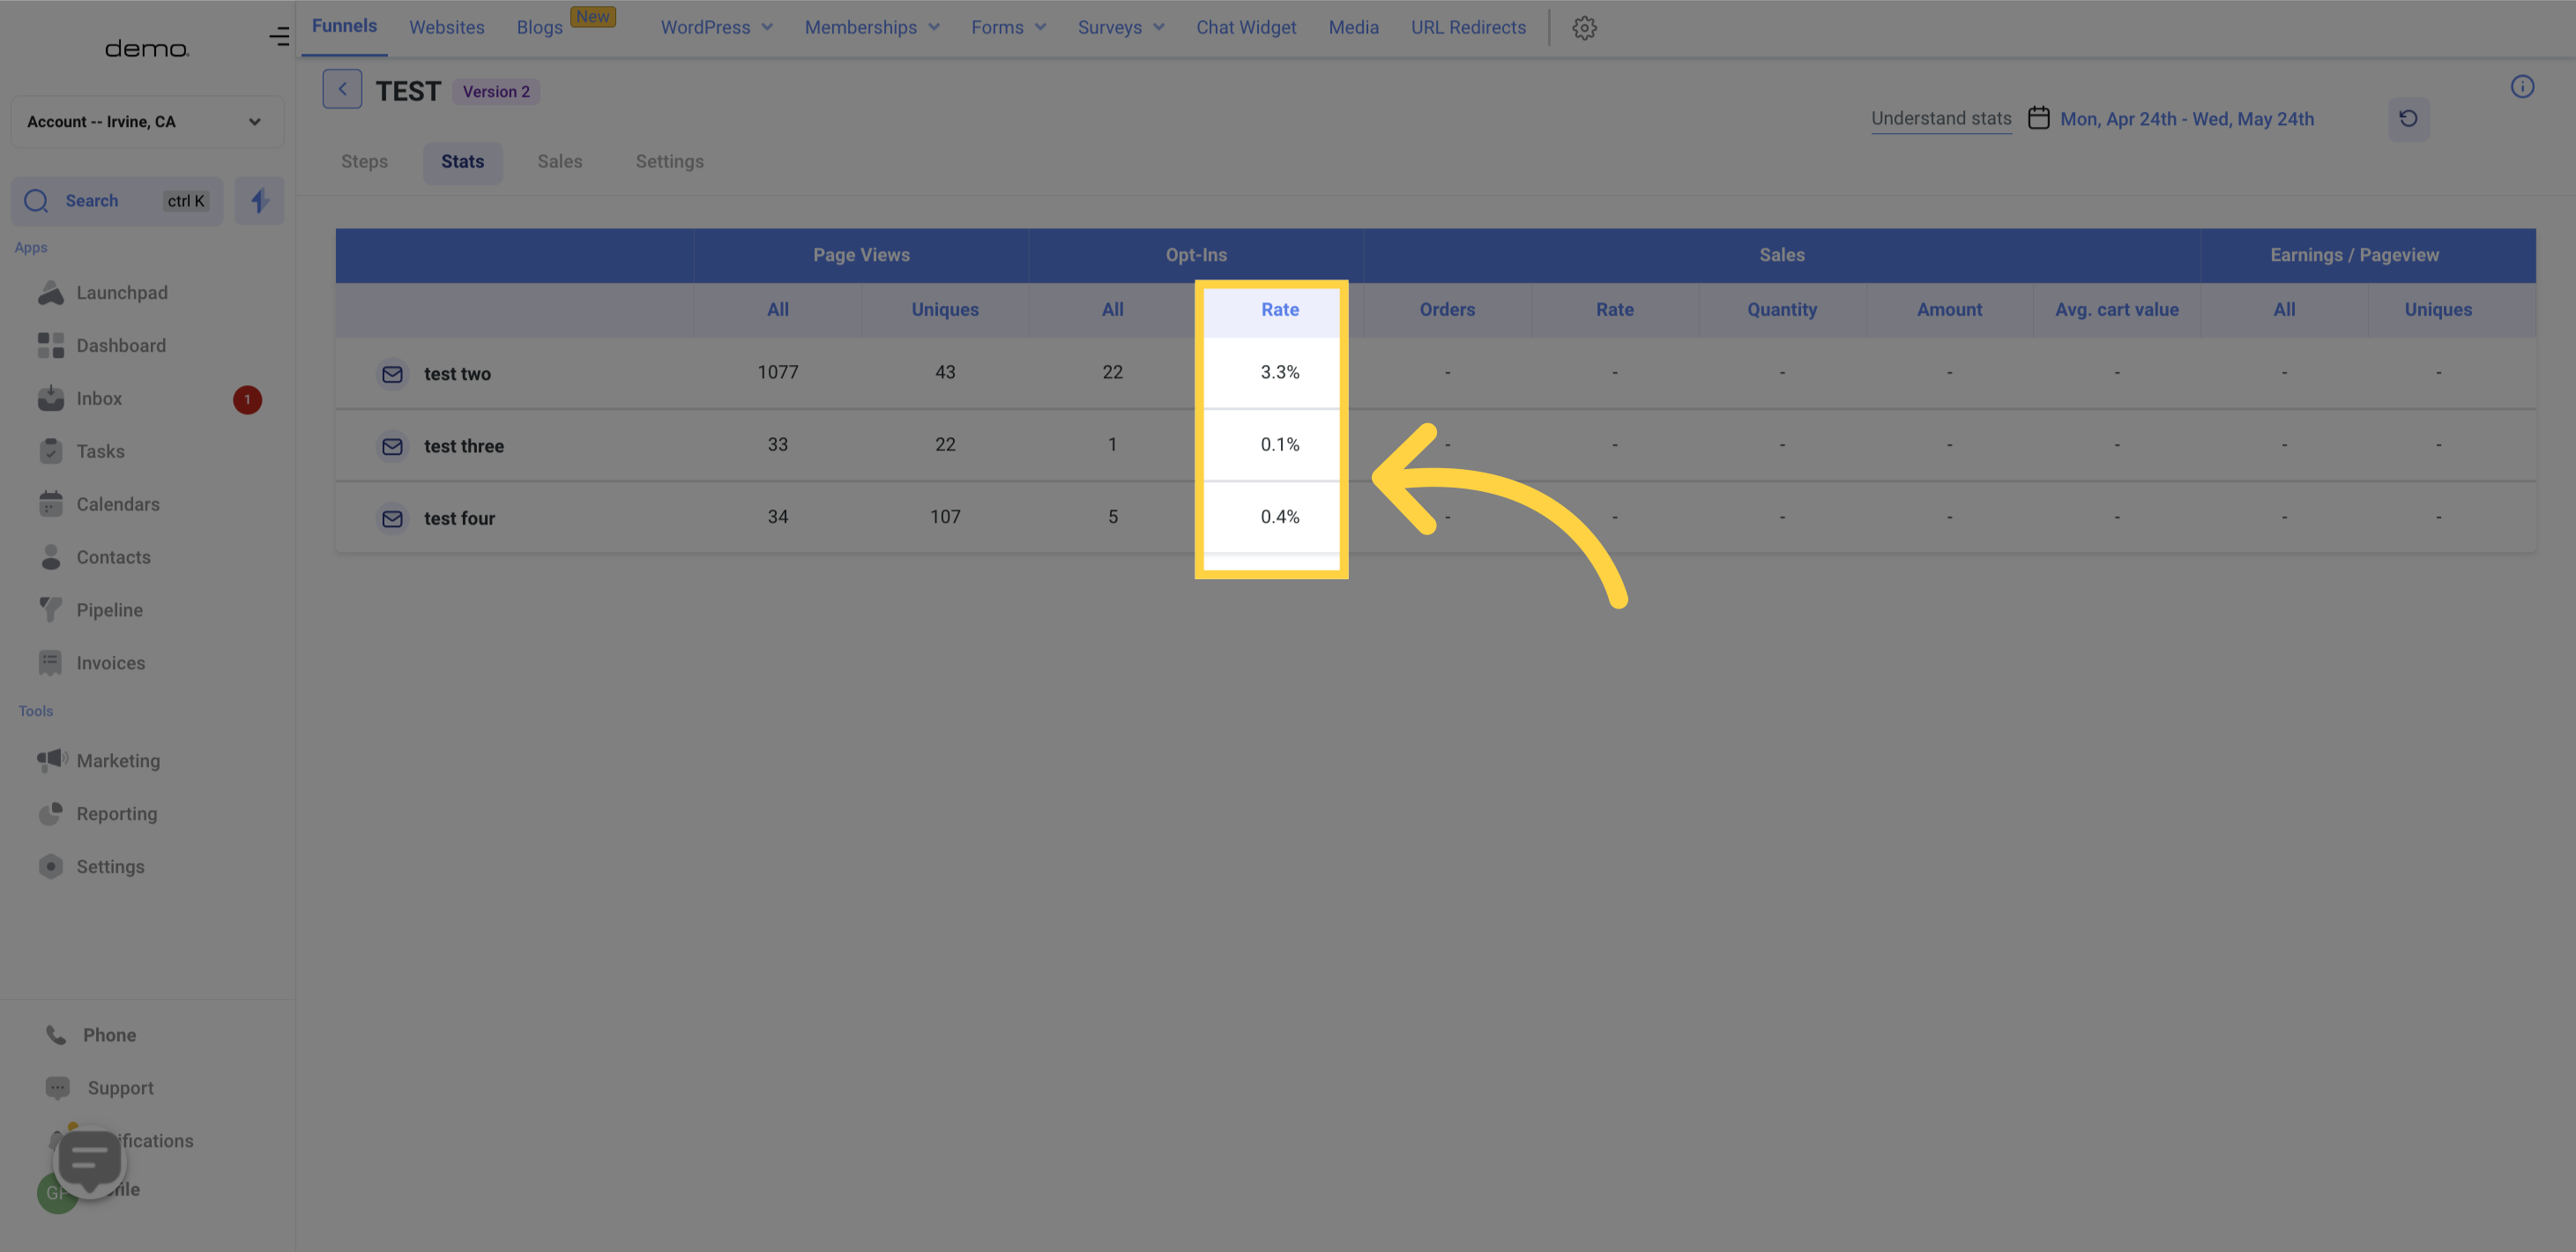
The "Rate" column indicates the rate at which those Opt-Ins occurred. Usually expressed in percentage (%), the "Rate" helps calculate the conversion rate of Opt-Ins. To get the number displayed in the "Rate" column, divide the "All" Opt-Ins by Unique Page views.
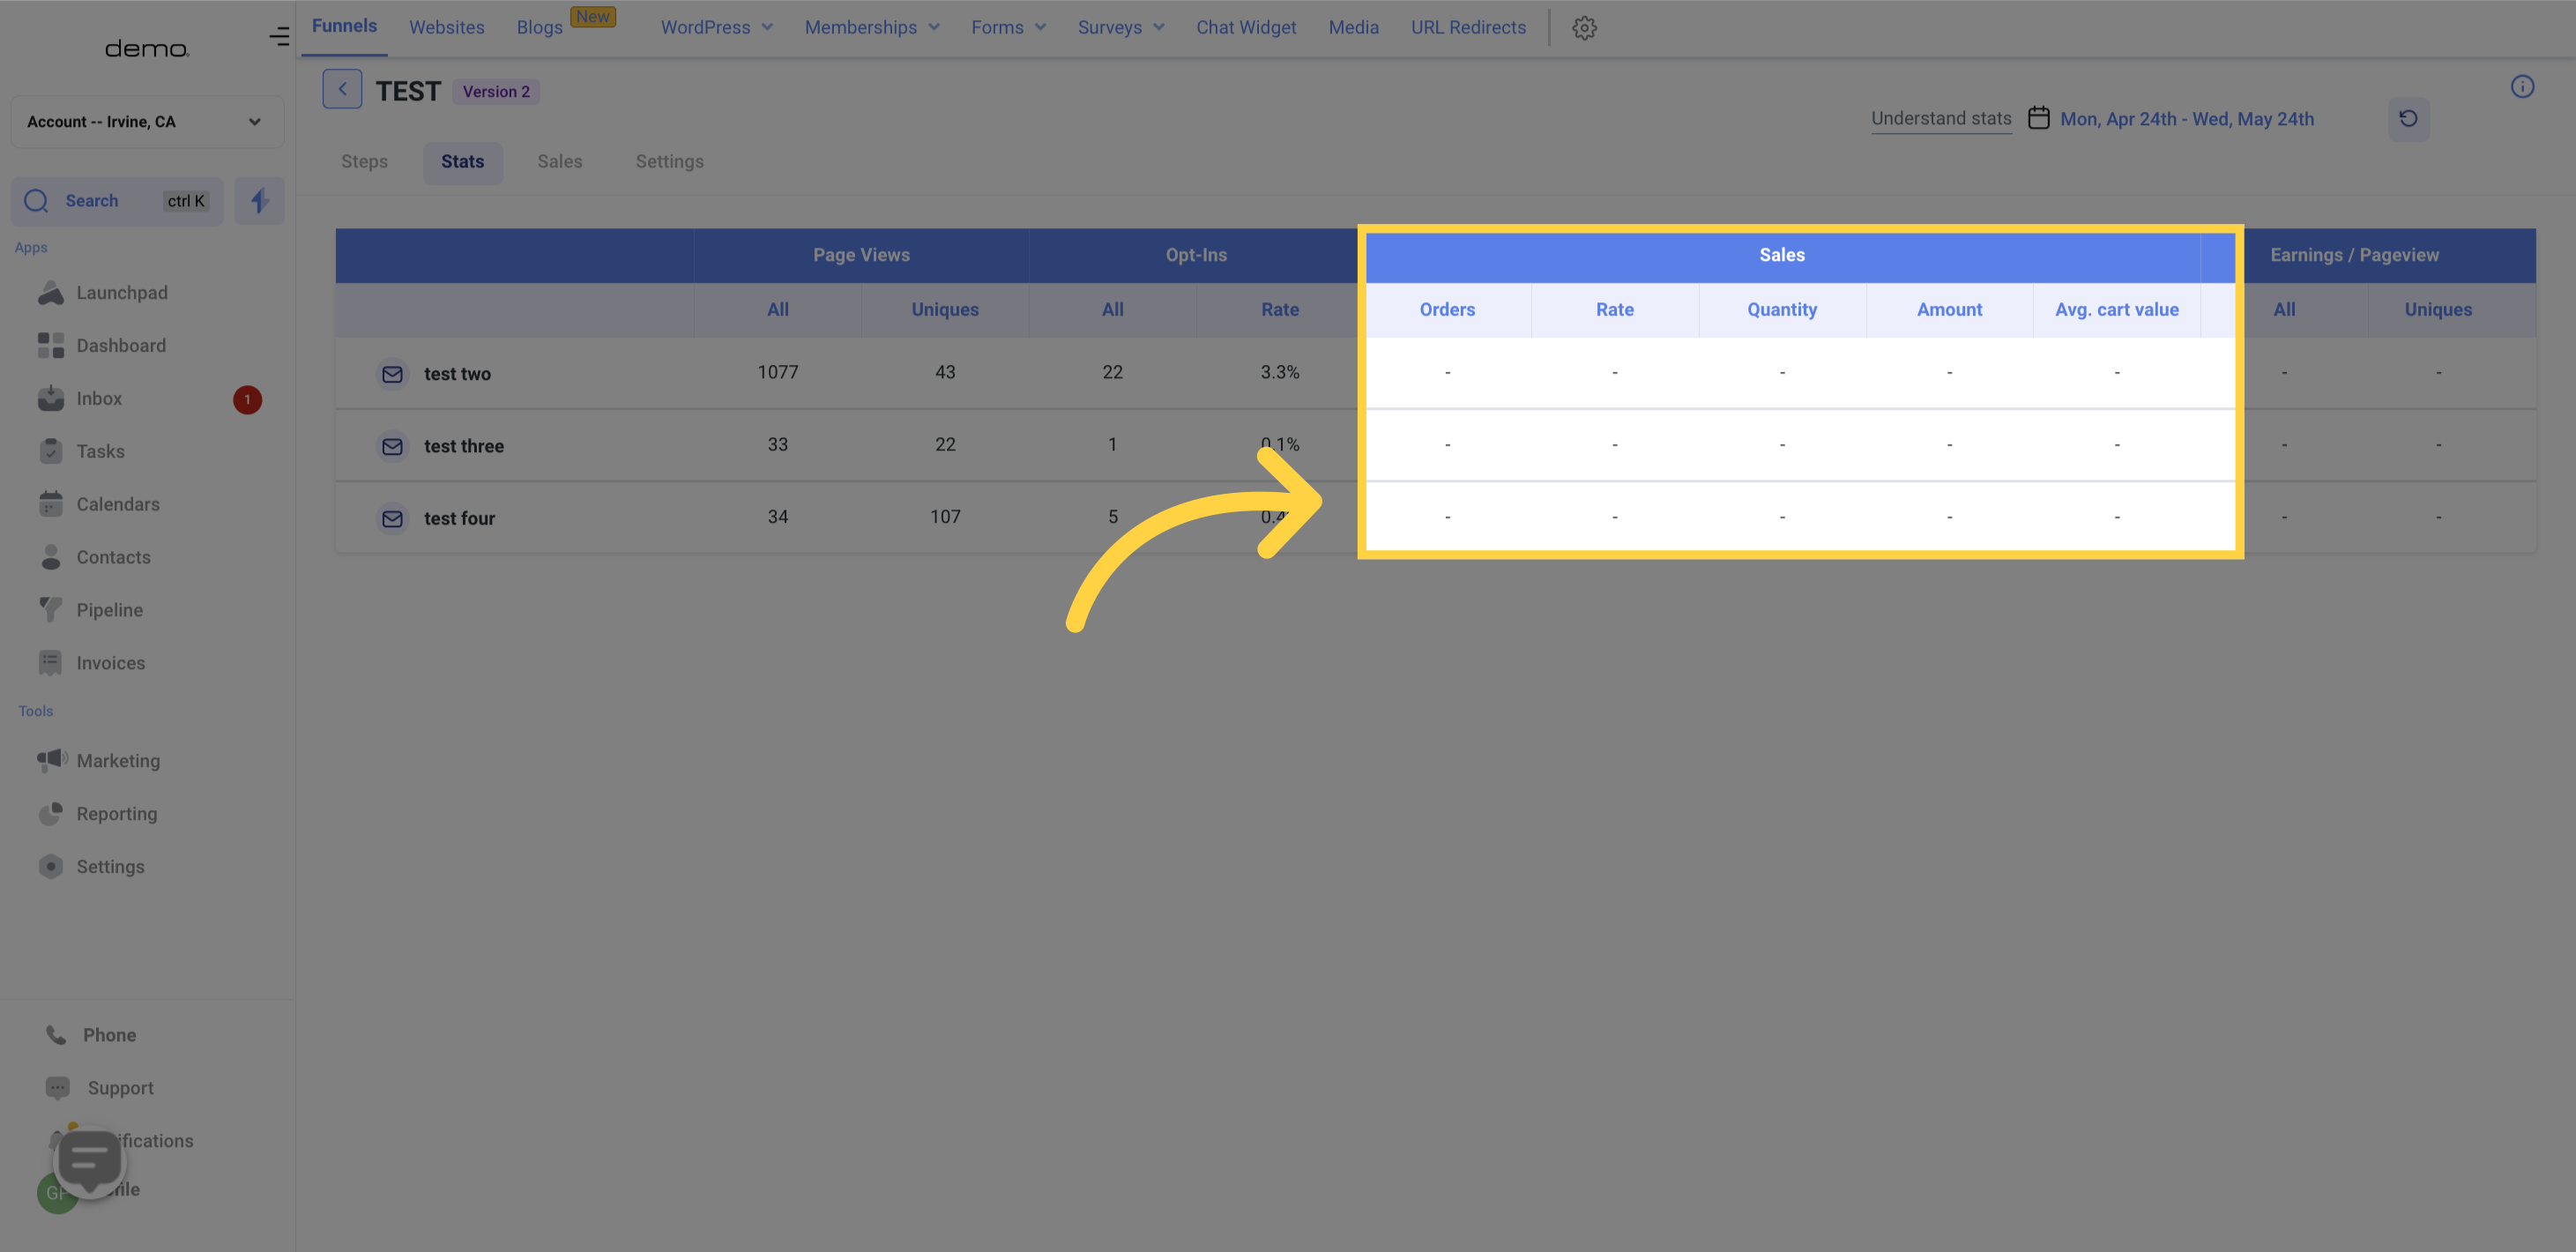
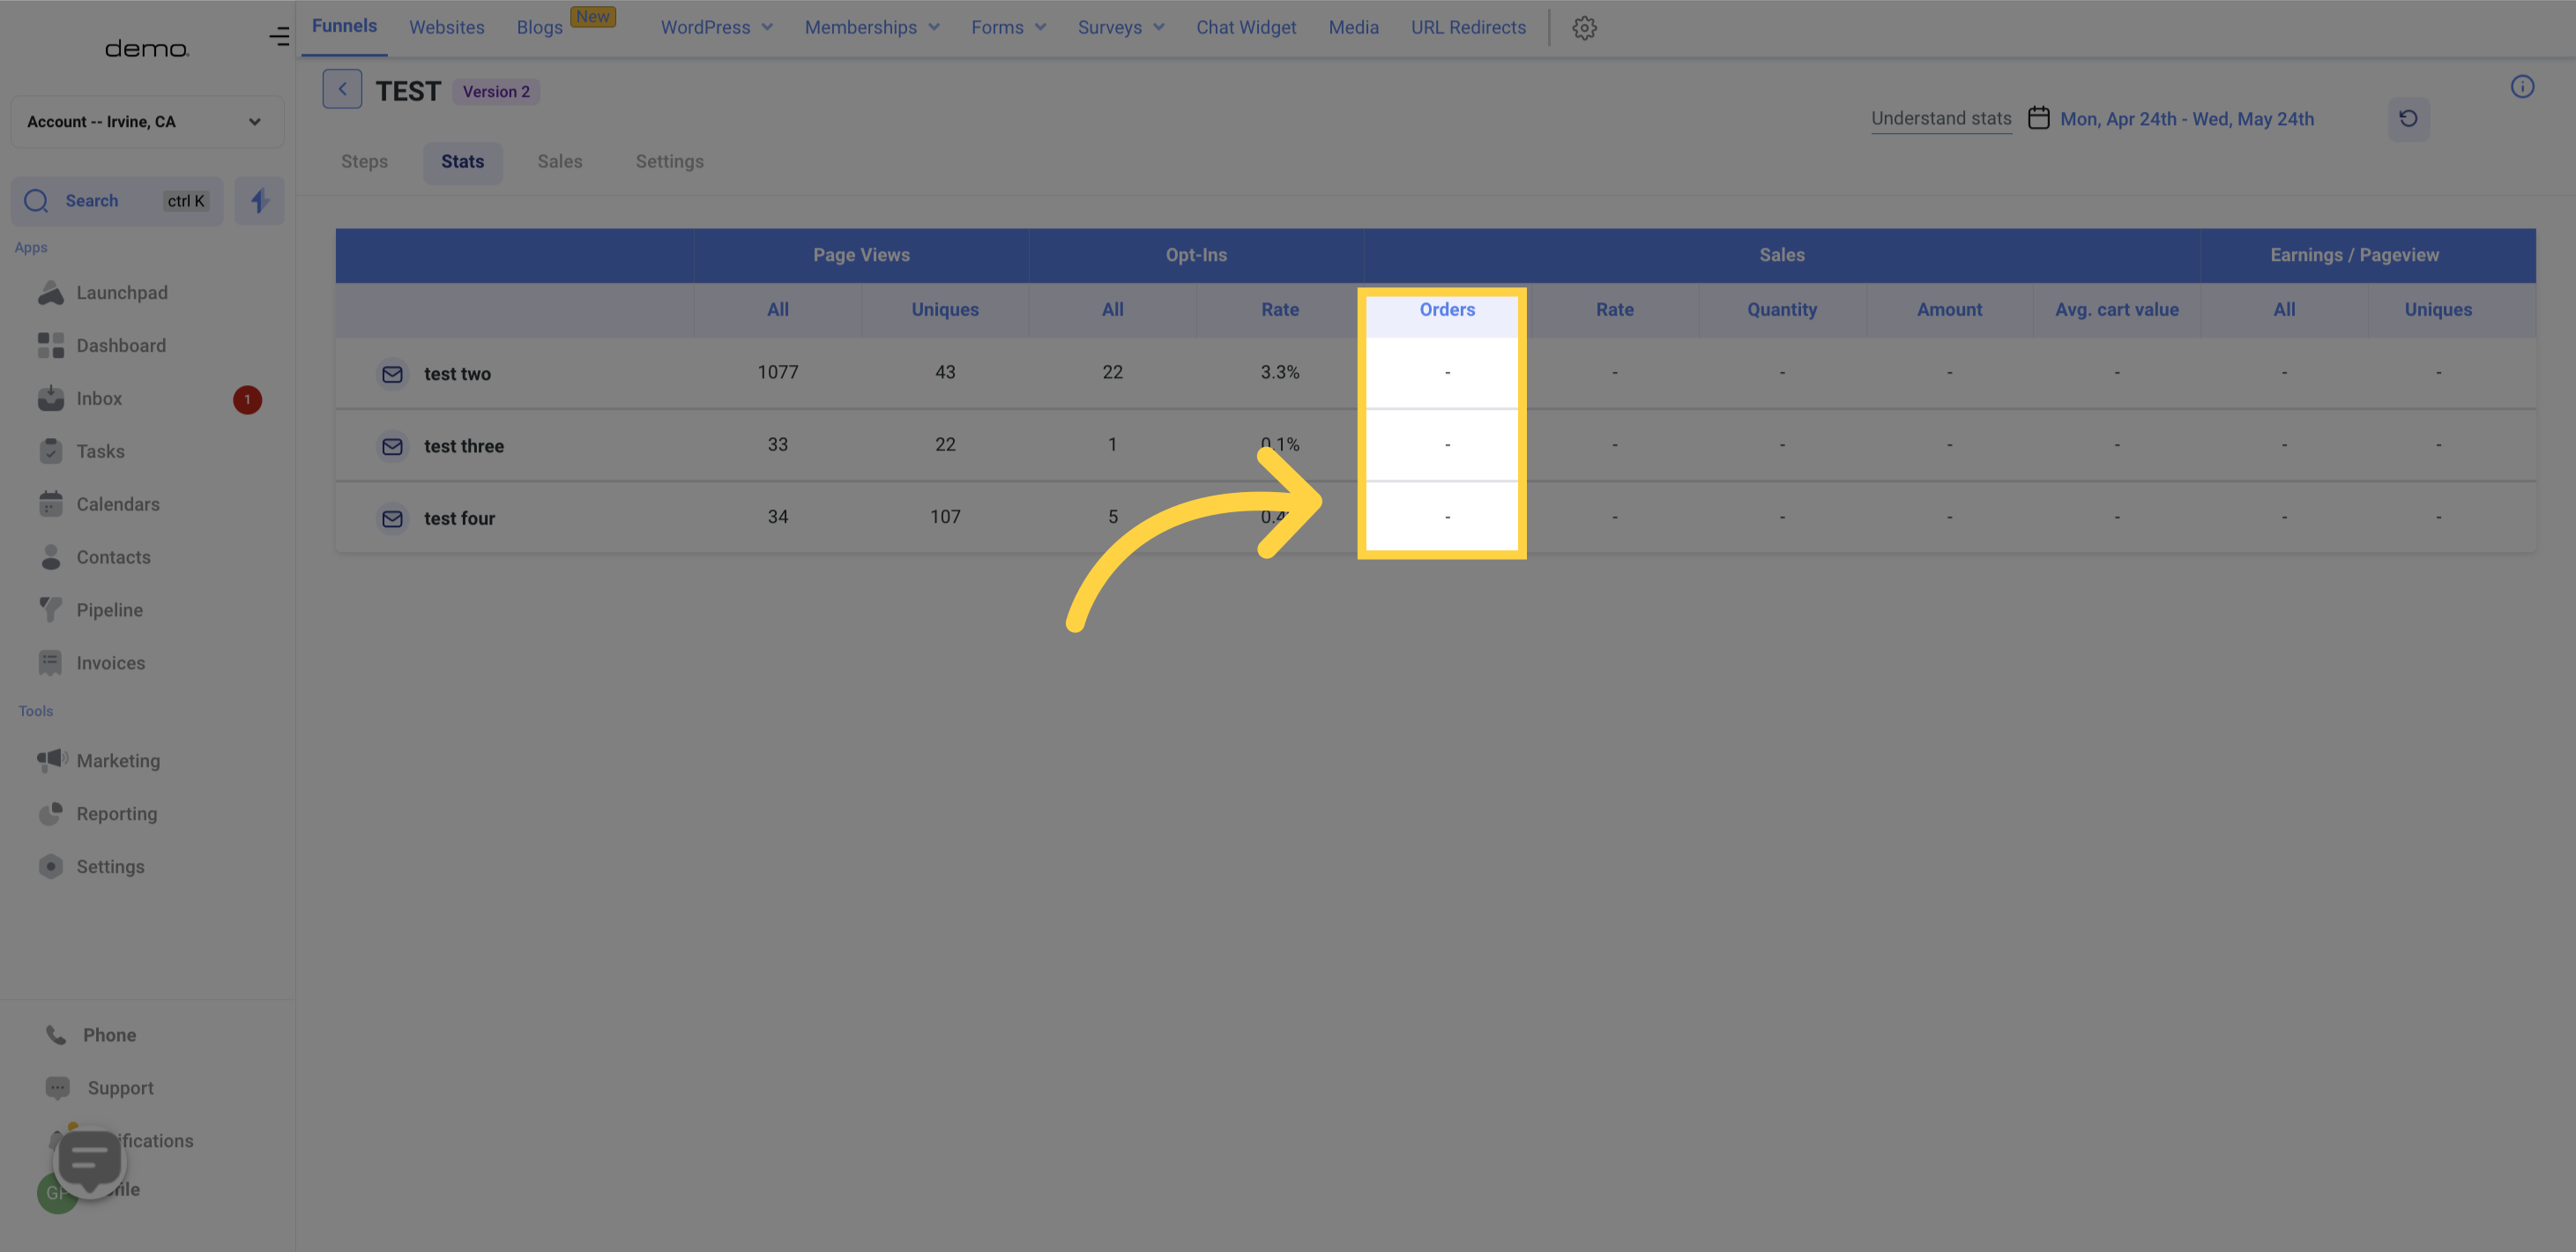
Under the "Order" metric, at the Funnel step level, it shows the total number of sales orders that occurred. This metric represents the total number of orders placed, without taking into account the number of products and quantities purchased.
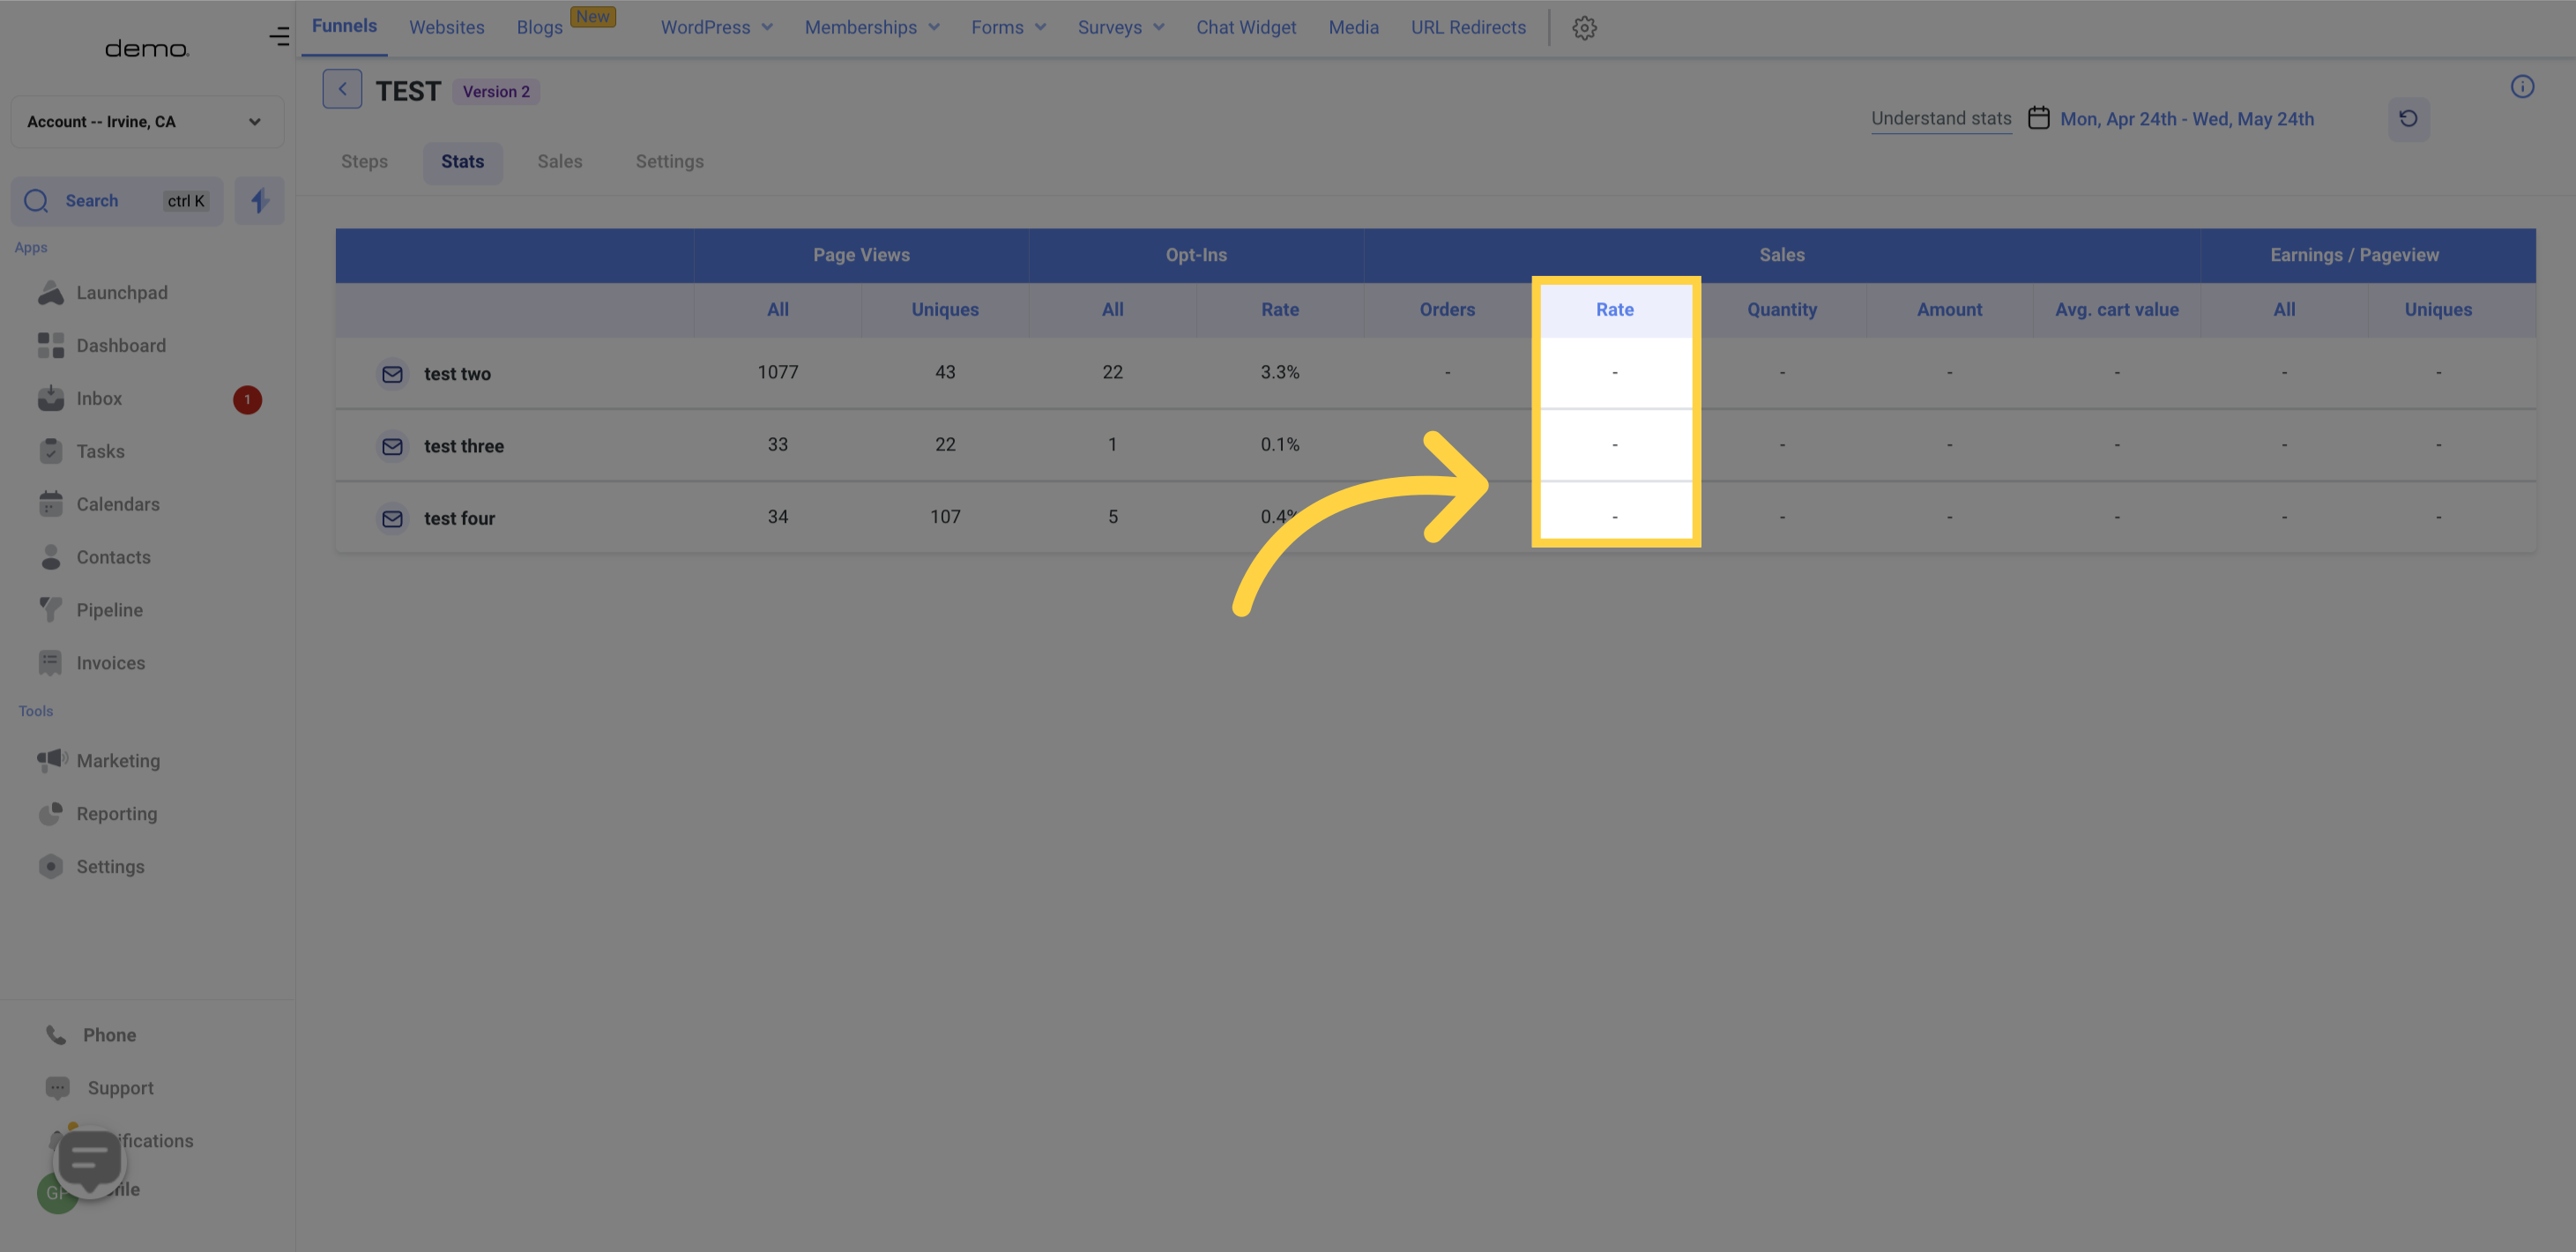
The "Rate" column calculates the sales rate At the Funnel step level. This metric indicates the number of times any product is purchased, divided by the count of unique page views to give the "Rate" value. At the individual product level, the "Rate" is calculated as the number of times the specific product is purchased divided by unique page views.
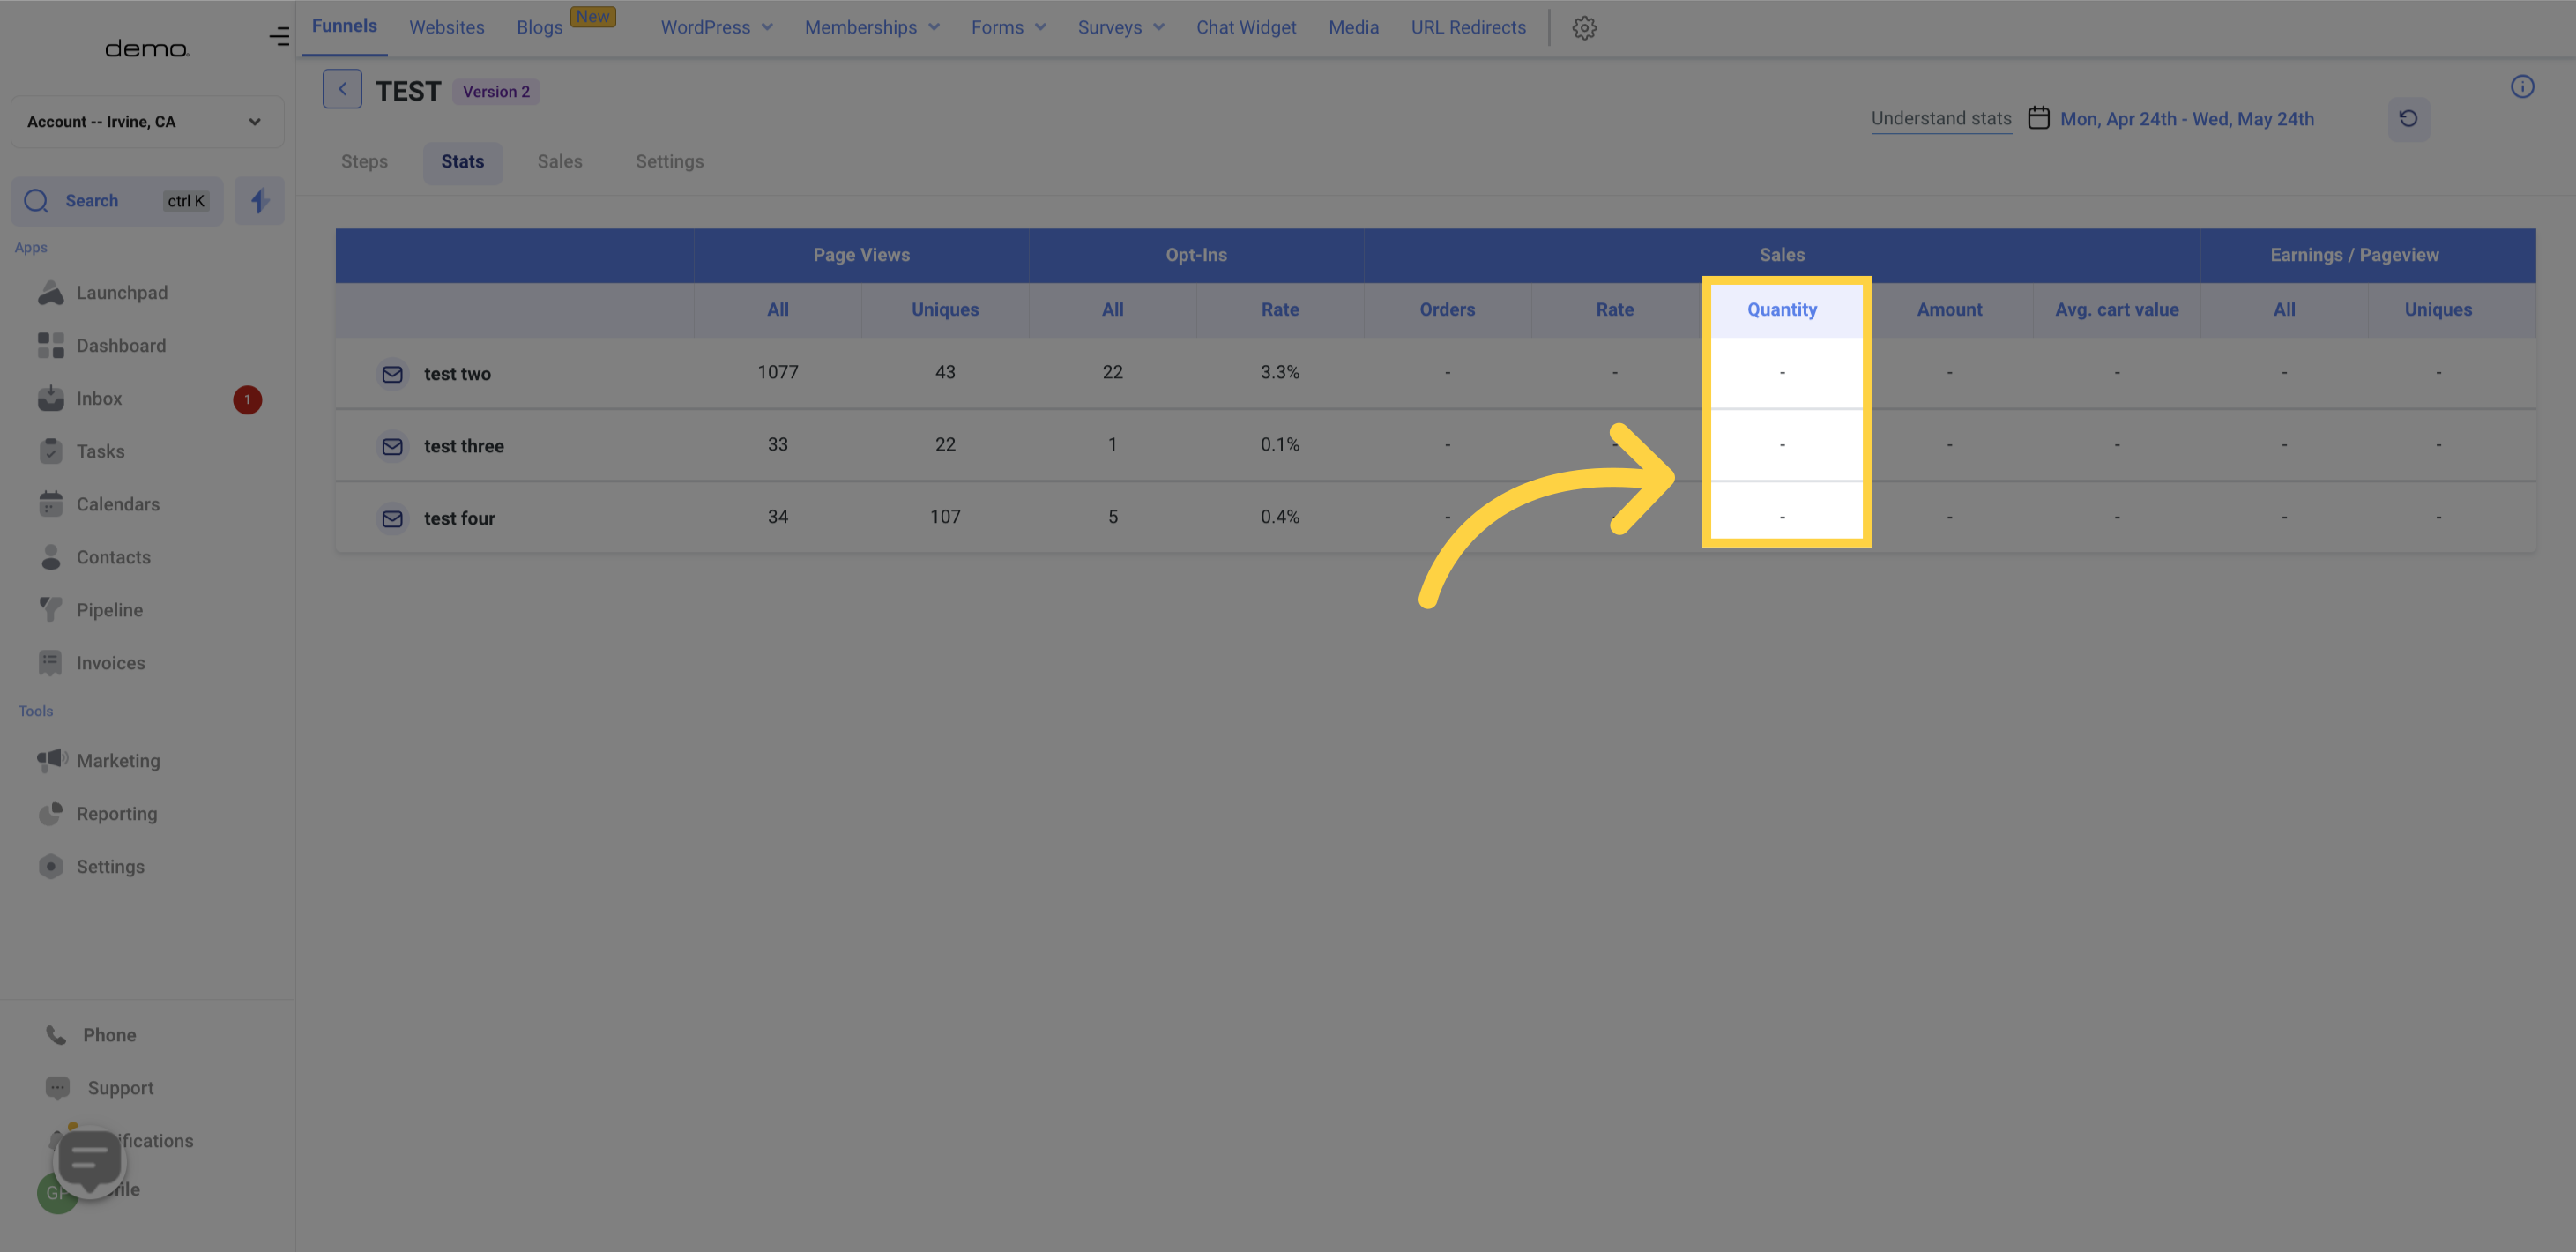
The "Quantity" metric, at the Funnel step level, shows the total quantity of all products purchased in that particular funnel step. At the product level, this metric displays the total amount of the specific product bought in that step.
The "Amount" metric, at the Funnel step level, displays the total value of all the products purchased in that particular step. At the product level, it shows the total sale value of a specific product in that funnel step.

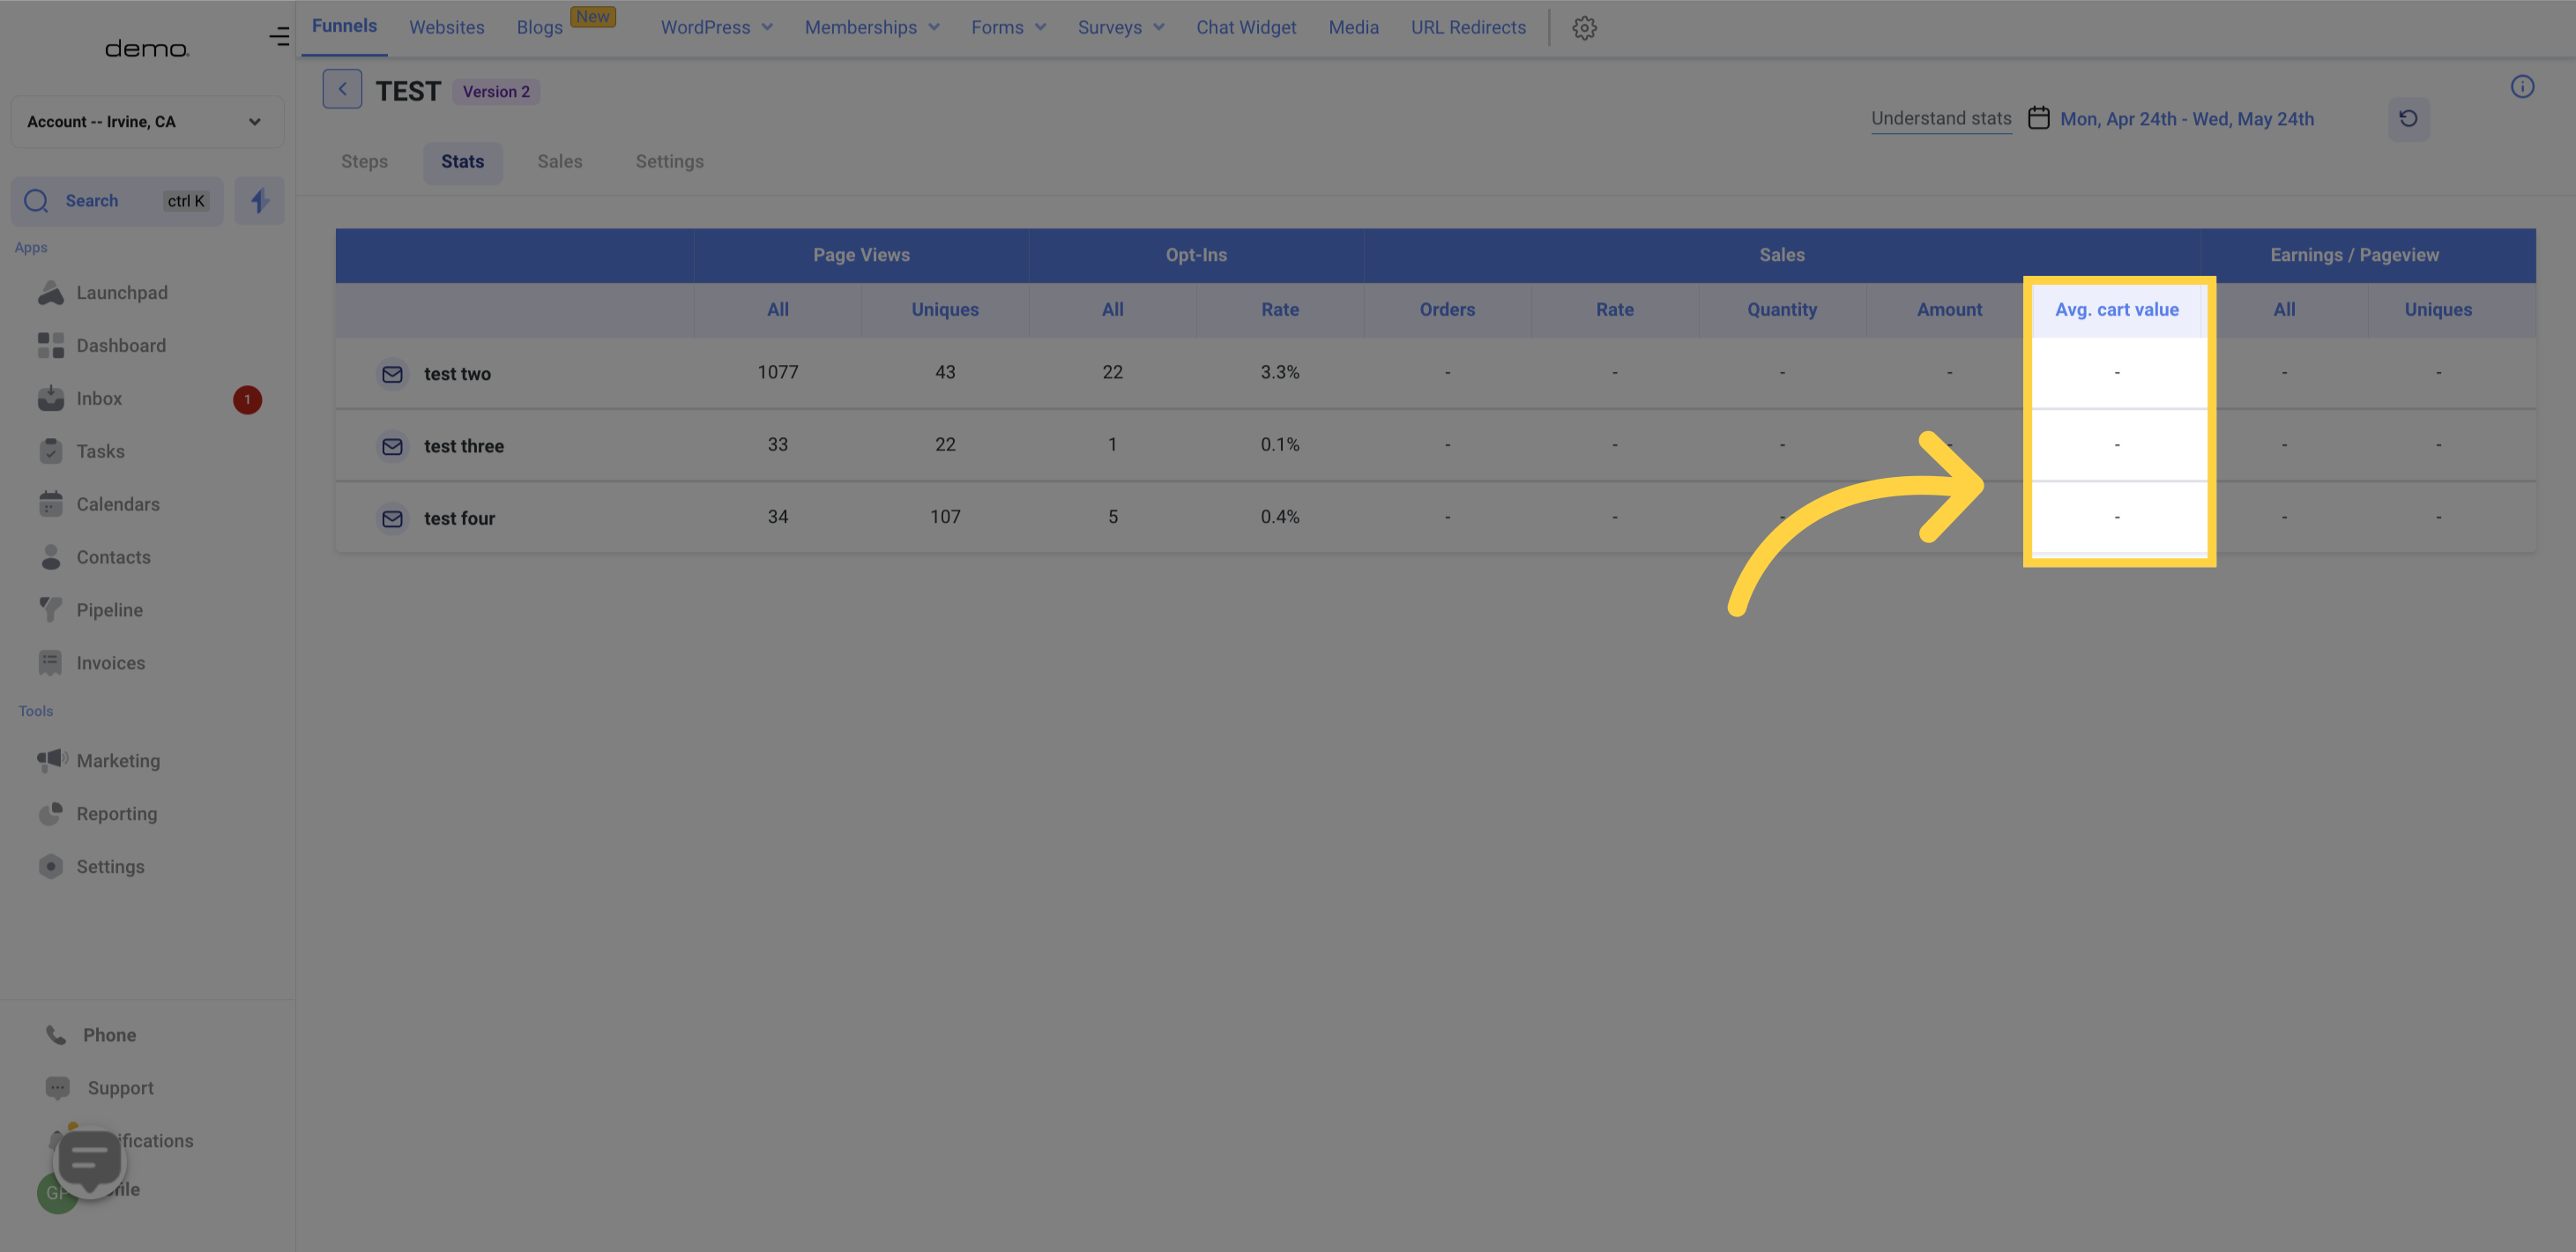
The "Average Cart Value" column displays the total amount or total orders
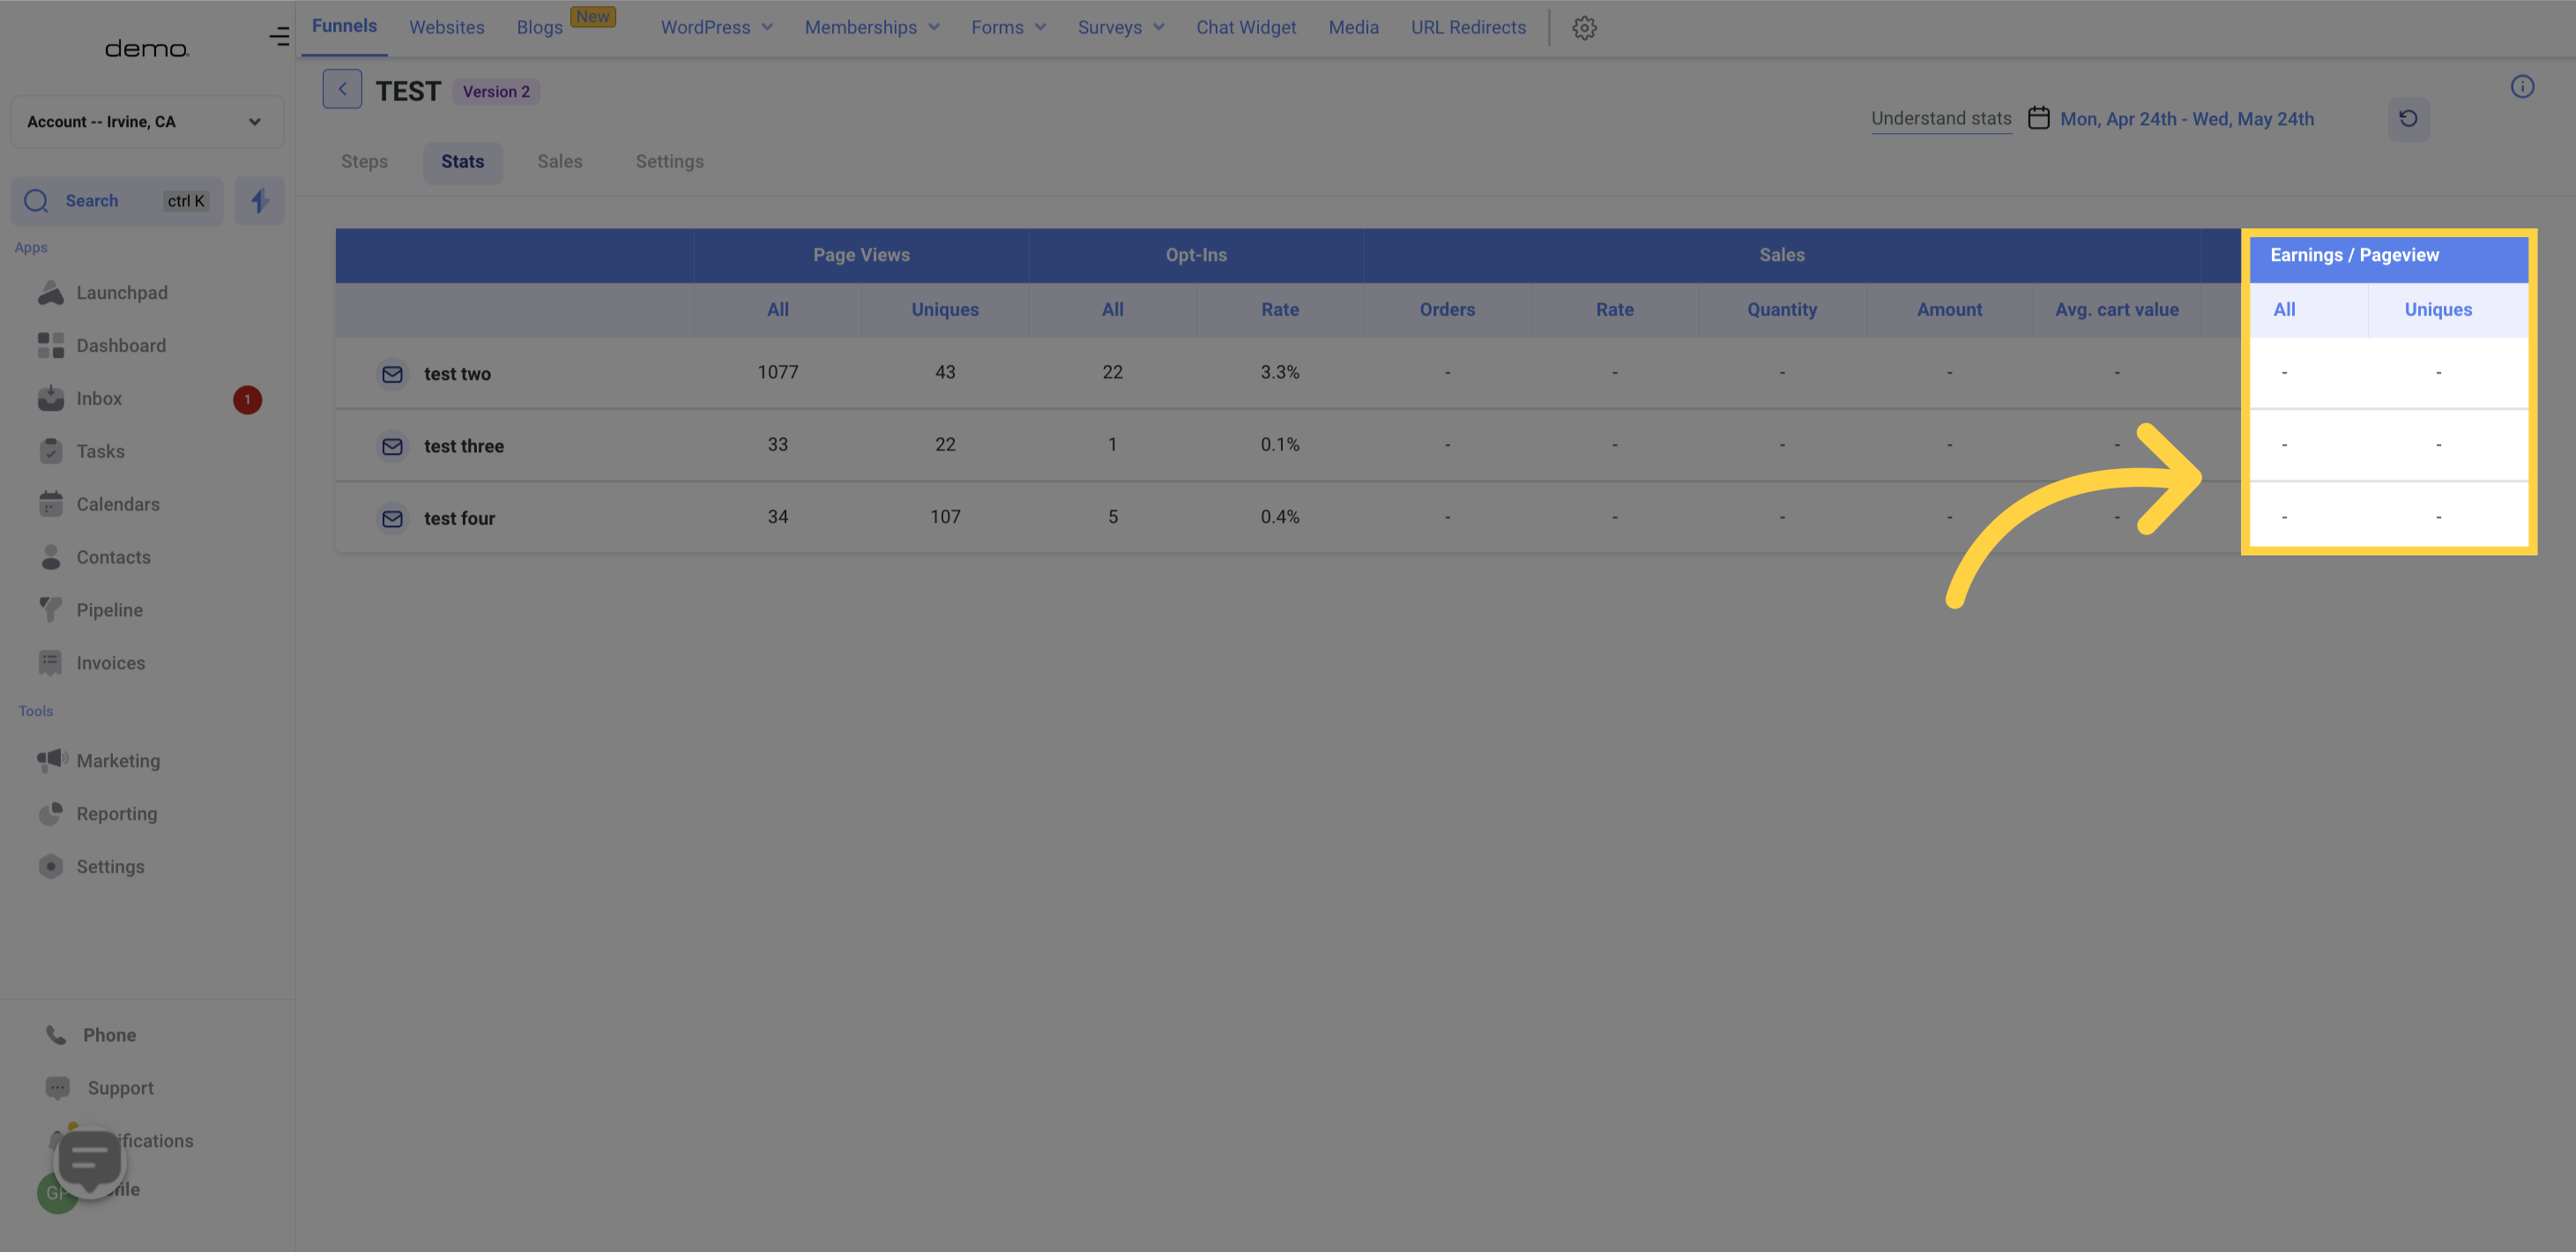
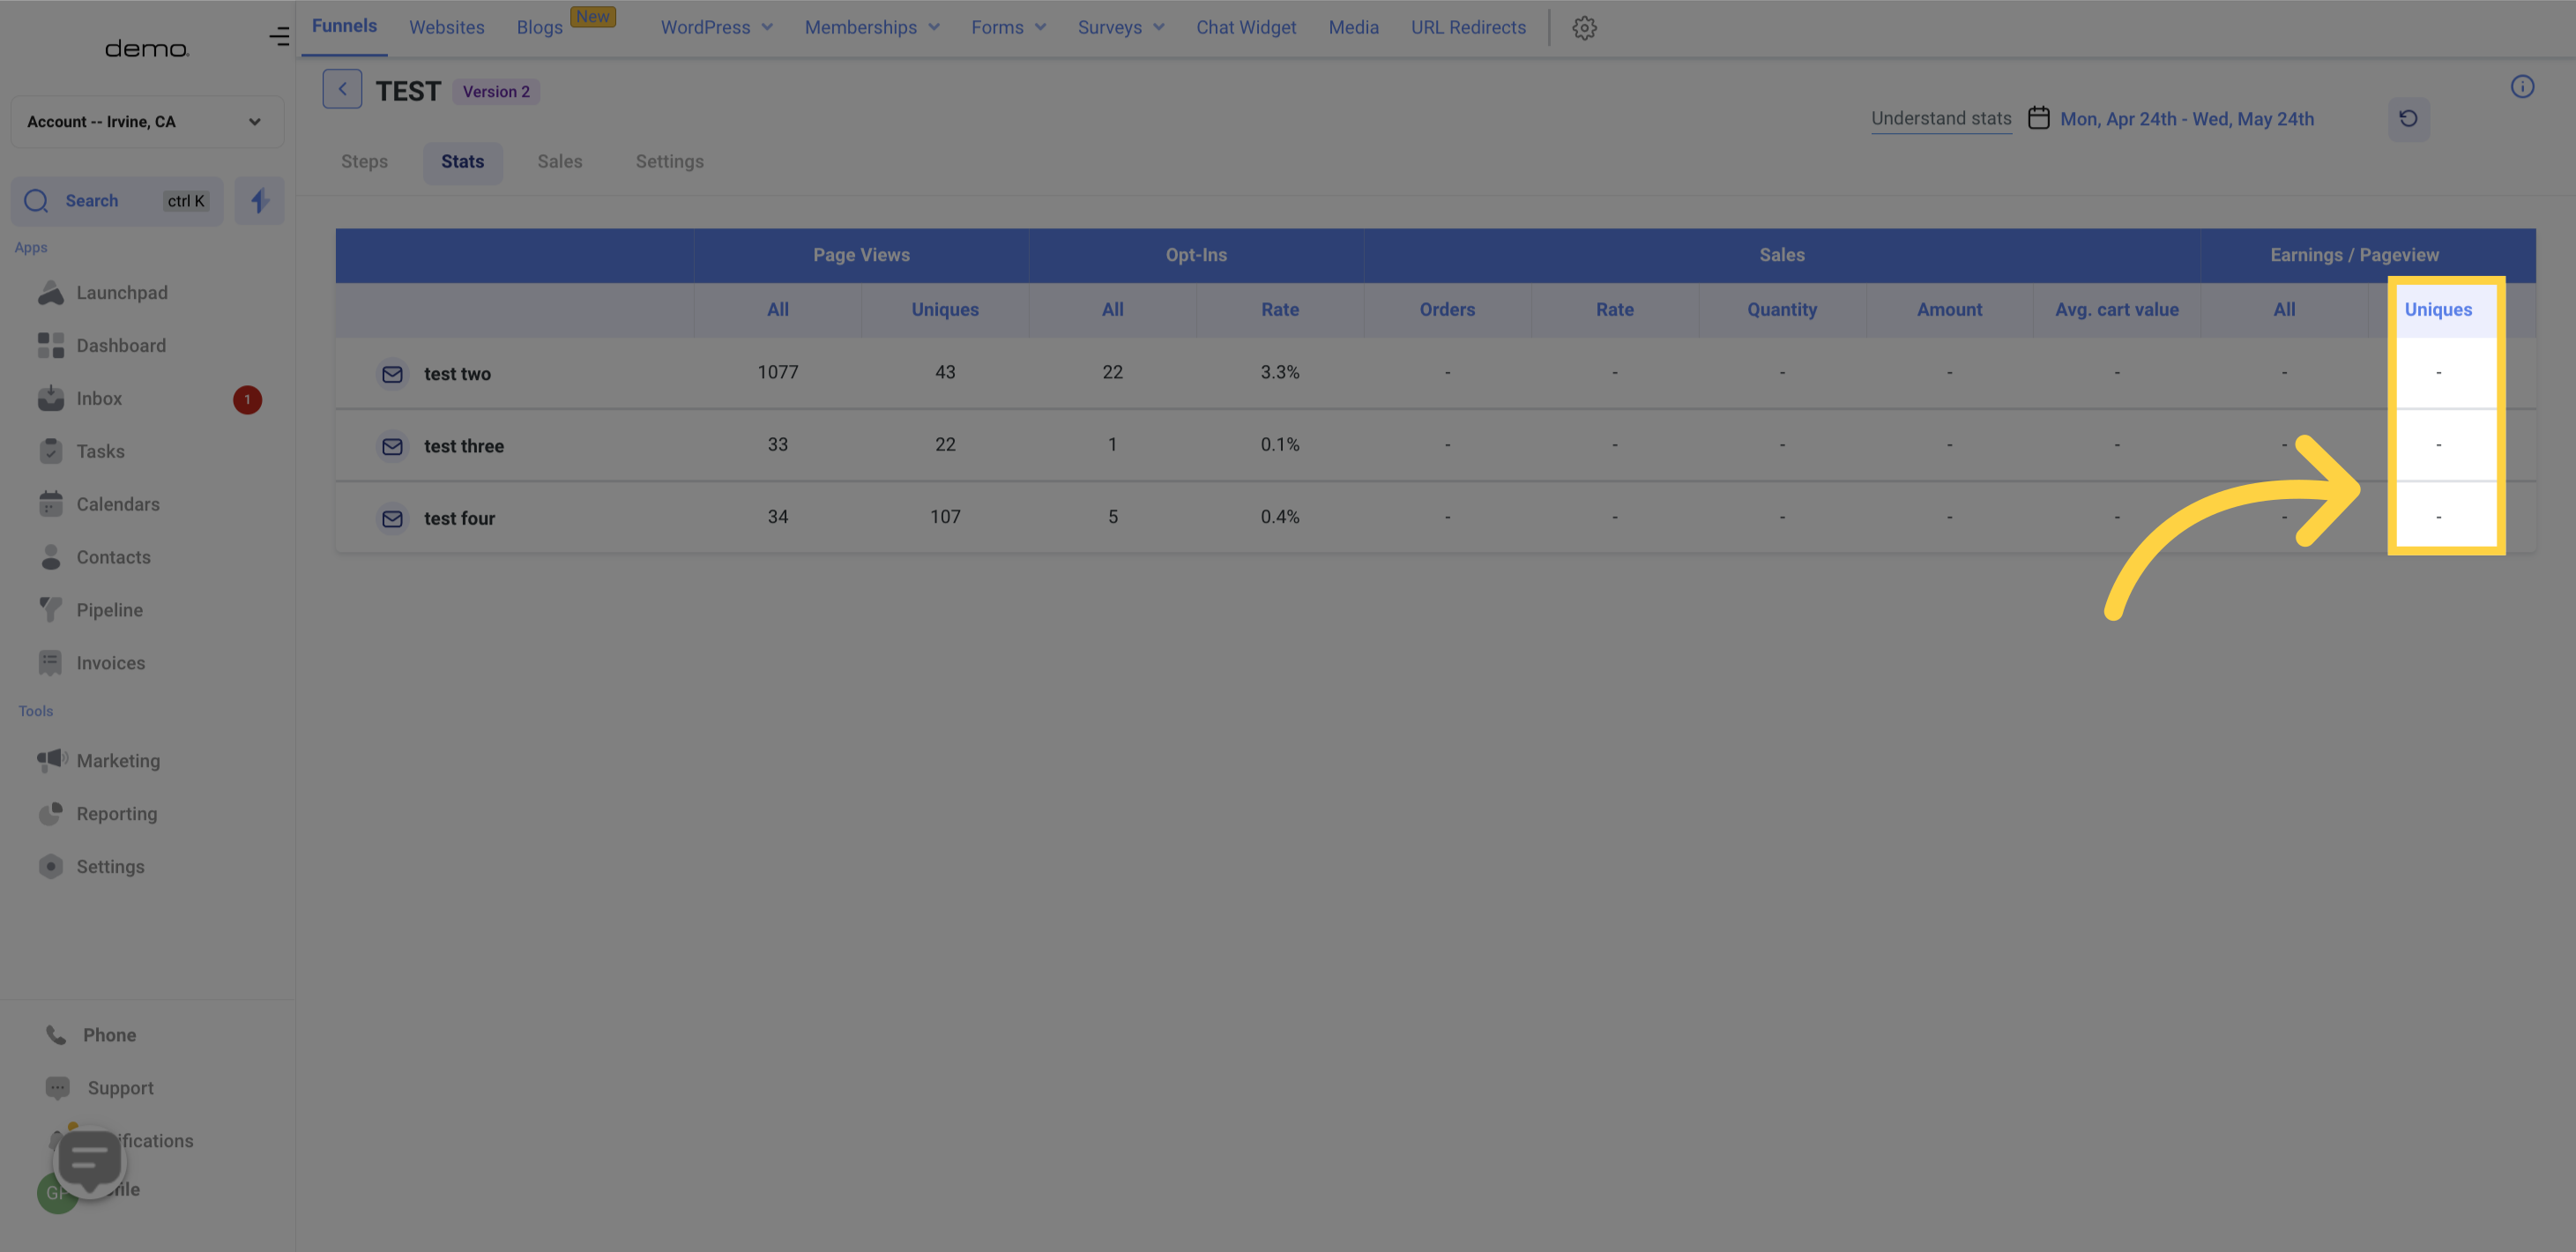
The "All" column displays the total amount of earnings generated per page view for both new and returning visitors. To calculate this value, divide the total Sales Value by the number of "All" page views.
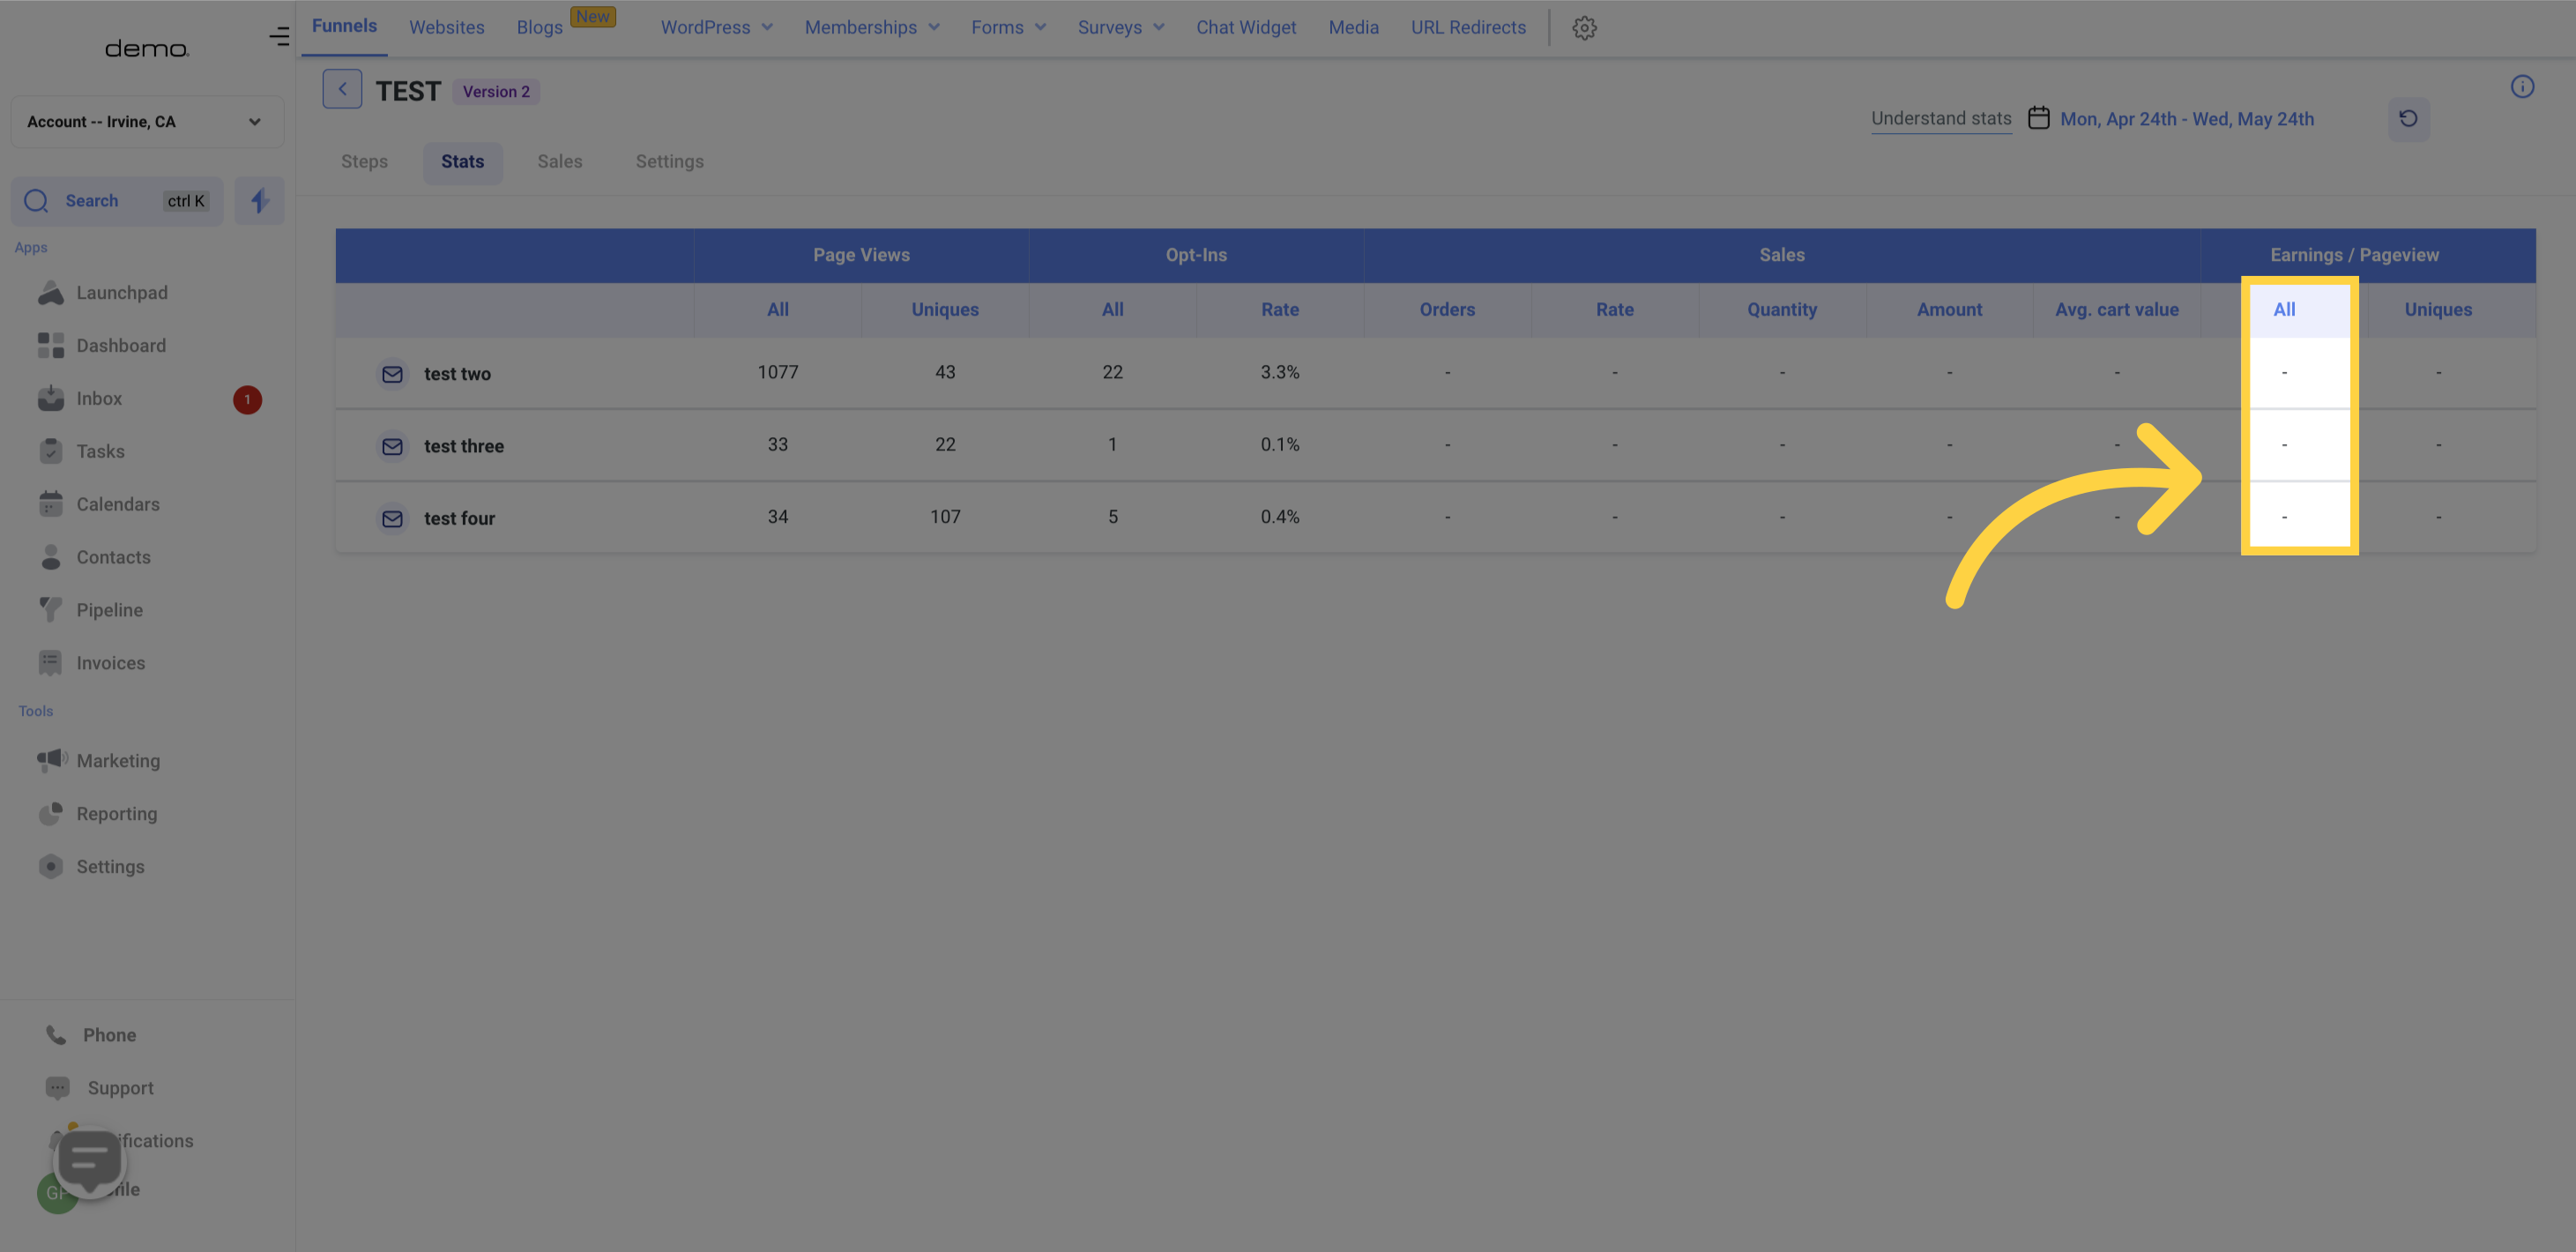
The "Unique" column, on the other hand, shows the total earnings per page view for only new visitors. To calculate this value, divide the total earnings by the number of Unique Page views.