Facebook Ads Reporting gives you a single view of how your Facebook ad campaigns are performing, from the moment an ad is shown all the way through to a booked patient and closed revenue. You can find it under Reporting > Facebook Ads Reporting in Aesthetix CRM. The same underlying ad data also feeds Ads Manager > Ad Reporting, so you can review campaign performance from either location.
This guide walks through every metric on the Facebook Ads Reporting dashboard, what it measures, and how it is calculated, so you can read your reports with confidence and know exactly where to focus your ad budget.
An impression is counted every time your ad is displayed to someone on Facebook or across the Facebook advertising network, whether or not they interact with it. This metric measures visibility and reach: how often your campaign is actually being seen.
A click is counted whenever someone clicks on your ad, whether that is the headline, an image, a call-to-action button, or a phone number on a text-style ad. A higher click count generally signals stronger interest and engagement with your ad creative.
A conversion is any interaction where a visitor completes an action you have defined as valuable, such as viewing a specific page, downloading a resource, signing up for your newsletter, submitting a form, or booking a consult. You decide what counts as a conversion based on your practice's goals. The purpose of tracking conversions is to see how well your ads turn visitors into leads and, ultimately, patients.
Client Spend is the total cost of running the ad campaign, including any additional management fees configured on your account. Only authorized users can adjust this setting, which keeps your spend reporting accurate and consistent.
Average CPC is the average amount you pay for each click on your ad. The higher the CPC, the more expensive it is to run that ad. CPC can vary based on several factors, including:
Your advertising budget
The number of impressions your ad receives
The location and time of day the ad runs
The type of content the ad appears alongside
Cost Per Conversion, also called Cost per Acquisition, measures the average cost of acquiring one new lead or patient. It is calculated as:
Cost Per Conversion = Total Ad Spend ÷ Number of Conversions
Use this metric to gauge whether a campaign is cost-effective at generating meaningful actions, not just clicks.
CPS measures how much you spend, on average, to generate a single completed sale (an opportunity marked as Won). It is calculated as:
CPS = Total Campaign Cost ÷ Number of Sales
This helps you evaluate how efficiently a campaign converts leads into paying patients.
CPL measures how much it costs to generate a single lead. It is calculated as:
CPL = Total Campaign Cost ÷ Total Leads
A lower CPL means your campaign is generating leads more efficiently.
Conversion Rate is the percentage of ad interactions that result in a conversion. It is calculated as:
Conversion Rate = (Conversions ÷ Total Interactions) × 100
For example, if a campaign had 50 conversions from 1,000 total interactions, the conversion rate would be 5%, since 50 ÷ 1,000 = 5%.
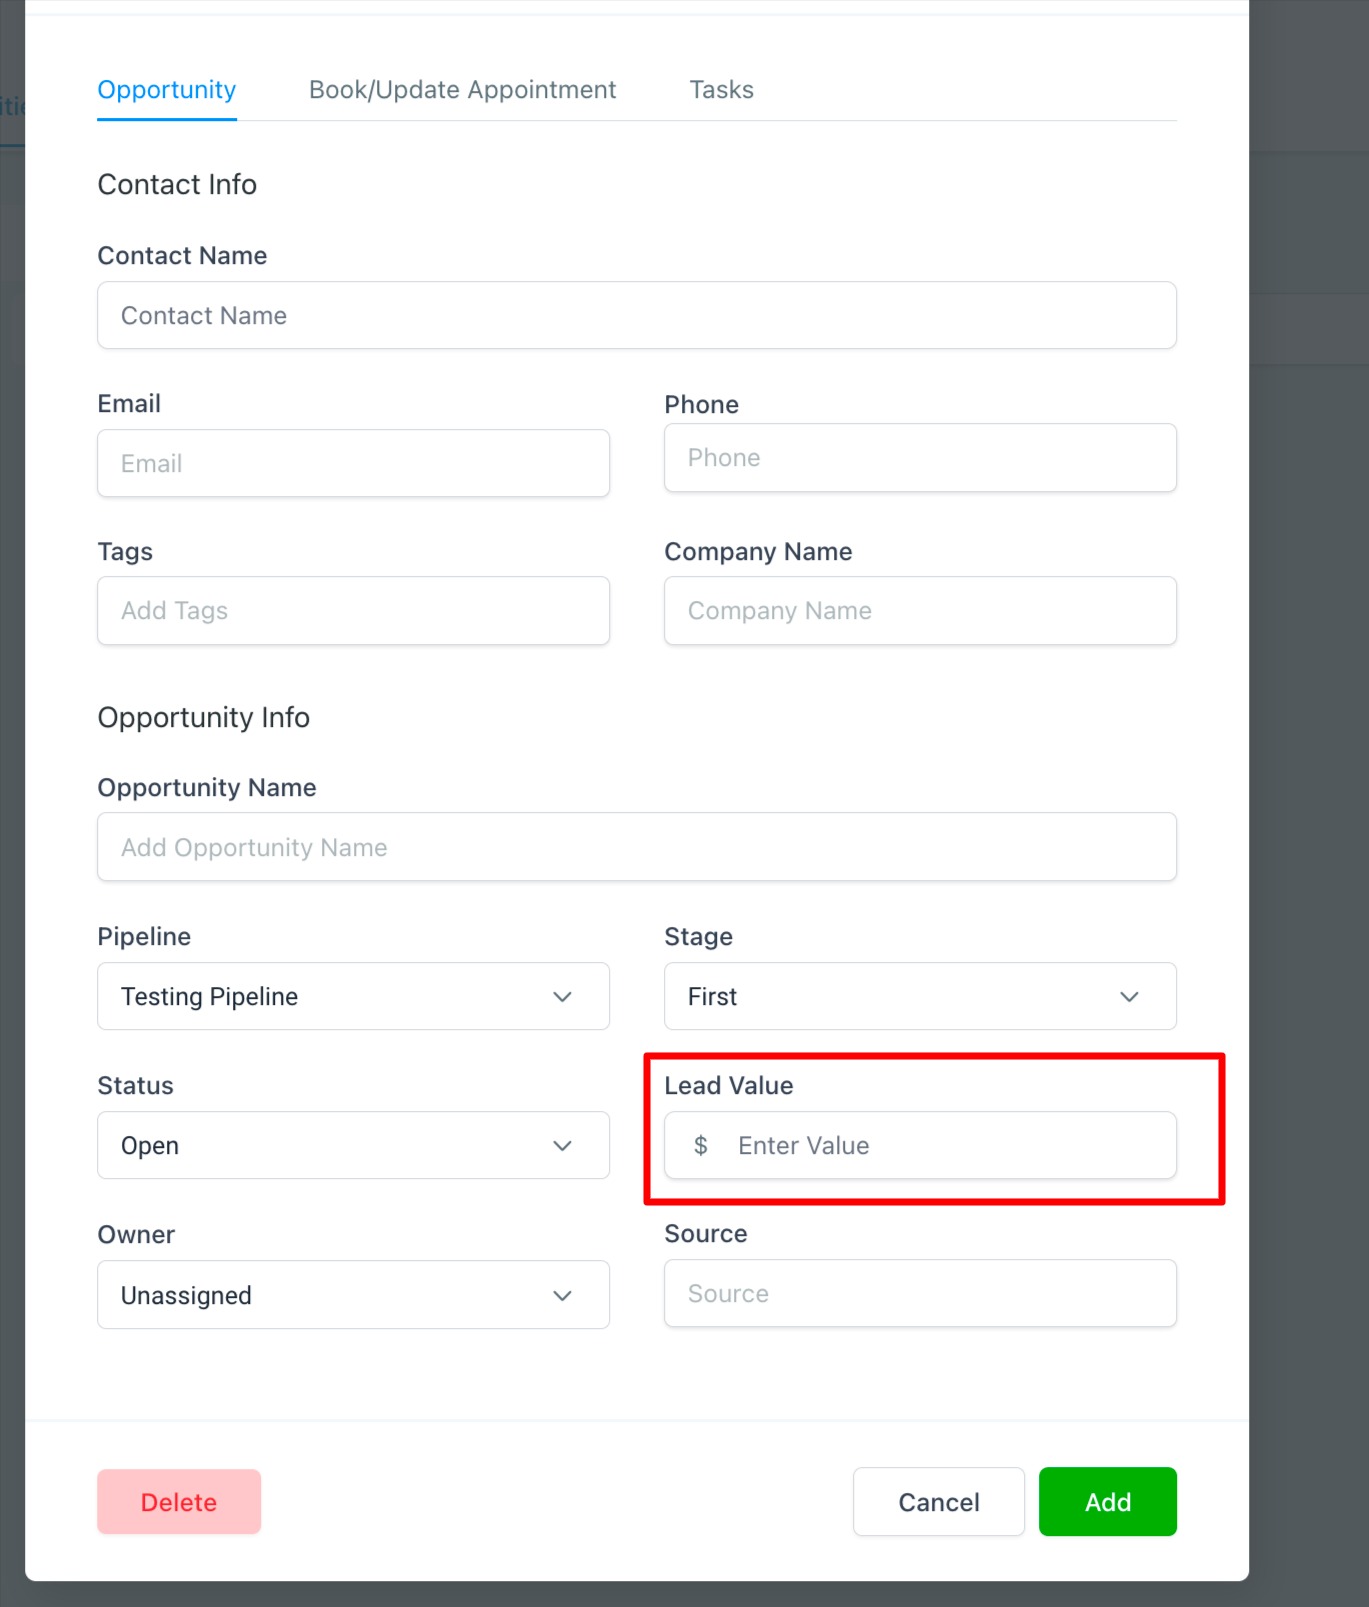
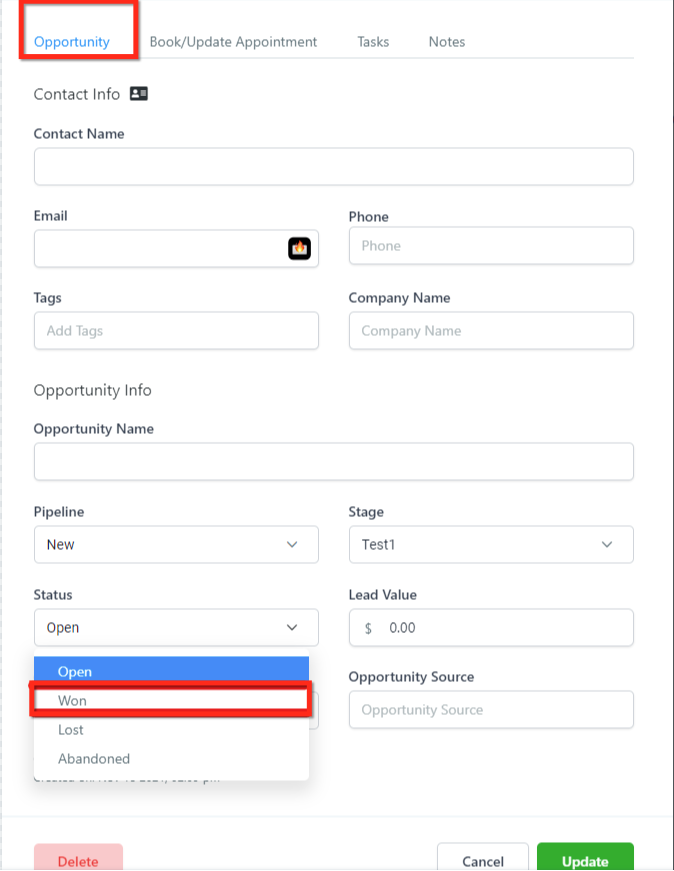
Revenue is the total dollar value of every opportunity marked as Won that is attributed to a specific Facebook ad campaign. When you mark an opportunity as won, you assign it a monetary lead value, and the report sums those values for every won opportunity tied to that campaign.
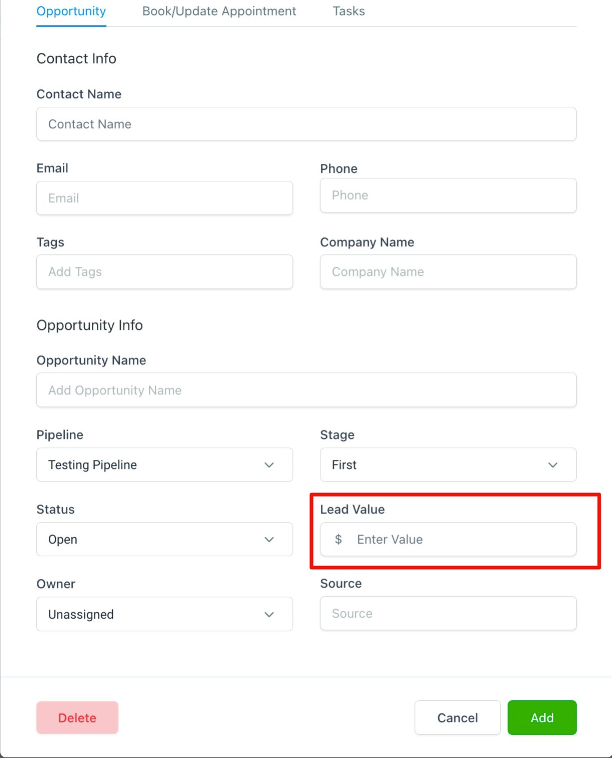
When entering a lead or opportunity value, use whole numbers only. You do not need to add a dollar sign, since the field already accounts for currency formatting.
ROI measures the overall profitability of a campaign by comparing the revenue it generated to what it cost to run. It is calculated as:
ROI = (Revenue – Ad Spend) ÷ Ad Spend × 100
A positive ROI means the campaign is profitable; a negative ROI flags a campaign that needs optimization. ROI can be viewed at the individual ad level or rolled up across an entire page.
Sales refers to the leads or opportunities that have been marked as Won for a given campaign.
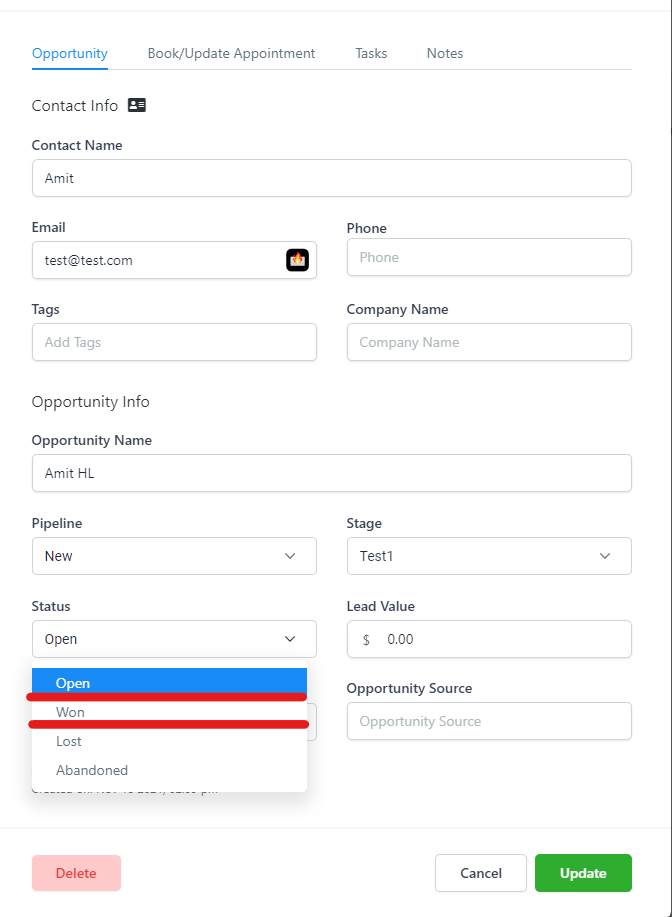
Leads refers to the leads or opportunities that are currently open, meaning they were recorded through a form submission, a reply via the chat widget, or an inbound phone call, but have not yet been marked as won or lost.
No single metric tells the whole story. Impressions and Clicks show you reach and interest, CPC and CPA show cost efficiency, and Conversion Rate, Revenue, ROI, Sales, CPS, Leads, and CPL show how well that interest turns into booked patients and closed revenue. Reviewing them together helps you decide where to shift ad budget, which campaigns to scale, and which need creative or targeting changes.
Why are some metrics missing or showing zero? This usually means your Facebook ad account is not fully connected to Aesthetix CRM, or the campaign data has not synced yet. Check your ad account connection and give it time to refresh.
How often does the reporting data update? Most metrics update in near real time, though some figures may take a little longer to process depending on Facebook's own reporting delays.
Why does Client Spend appear higher than I expected? Client Spend includes both the ad cost billed by Facebook and any additional management fees configured on your account, so it can be higher than the raw ad spend shown inside Facebook itself.
What is the difference between CPL and CPS? CPL measures the cost to generate a single lead, while CPS measures the cost to generate a single completed sale. CPL tells you how efficiently you are filling the top of your funnel; CPS tells you how efficiently that funnel closes into revenue.
Why do I need to enter revenue as a whole number? The Revenue and lead value fields already account for currency formatting, so entering a dollar sign or decimal symbol can cause the value to record incorrectly. Enter numeric values only.
Are these metrics the same as what I see inside Facebook Ads Manager directly? The underlying data is the same, but Aesthetix CRM's reporting is organized to connect ad performance directly to your leads, opportunities, and revenue, which makes it easier to see the full patient journey from click to booked treatment.
Where else can I see this ad data? The same Facebook ad performance data is also available in Ads Manager > Ad Reporting, which gives you another view alongside your other ad channels.
Why does ROI look different from CPA even though they both involve cost? CPA tells you the cost of a single conversion, while ROI compares total campaign revenue to total campaign cost. A campaign can have a high CPA but still deliver a strong ROI if each conversion is worth a lot in booked revenue, and vice versa.
