Google Ad Reporting gives your practice live reporting and analysis for Google ad campaigns connected to Aesthetix CRM. It pulls impressions, clicks, spend, leads, and closed sales into one view so you can see, at a glance, how well an ad campaign is turning ad spend into booked patients and revenue.
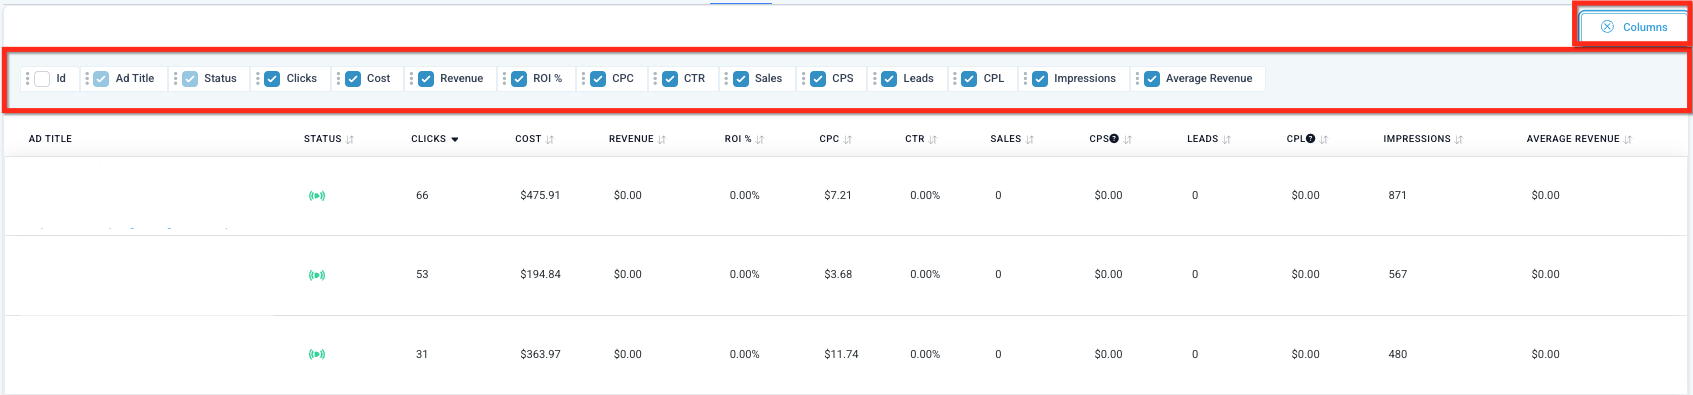
This guide defines every metric you'll see in Google Ads reporting: what it means, how it's calculated, and how to use it when reviewing campaign performance. For the reporting screens themselves and how to set up ad reporting, see Ads Manager > Ad Reporting.
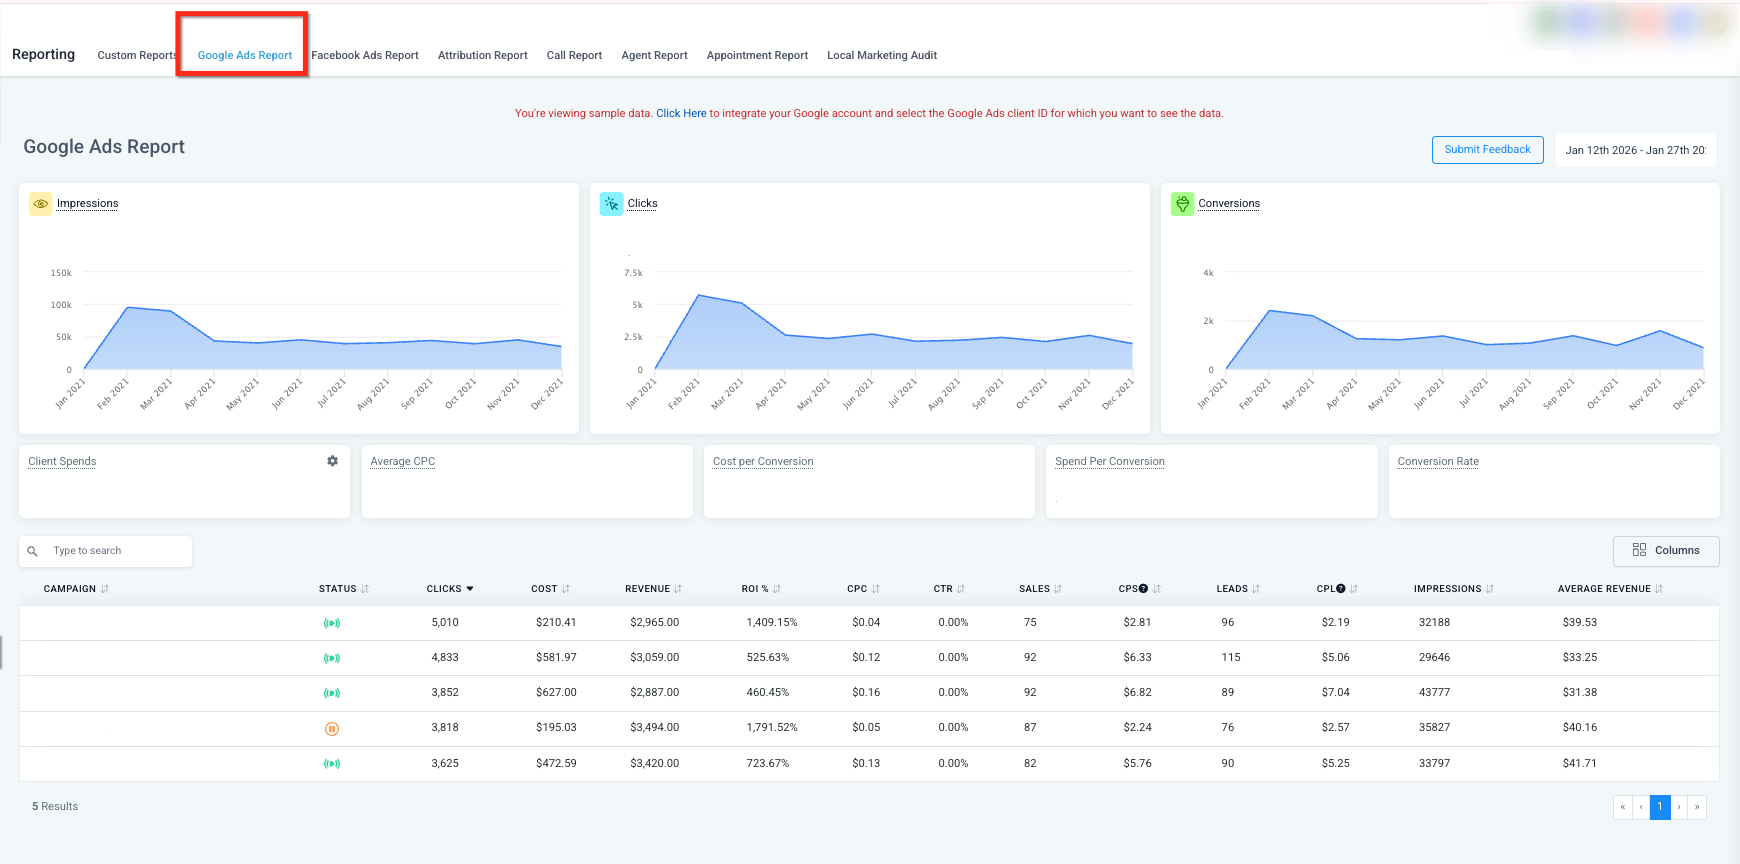
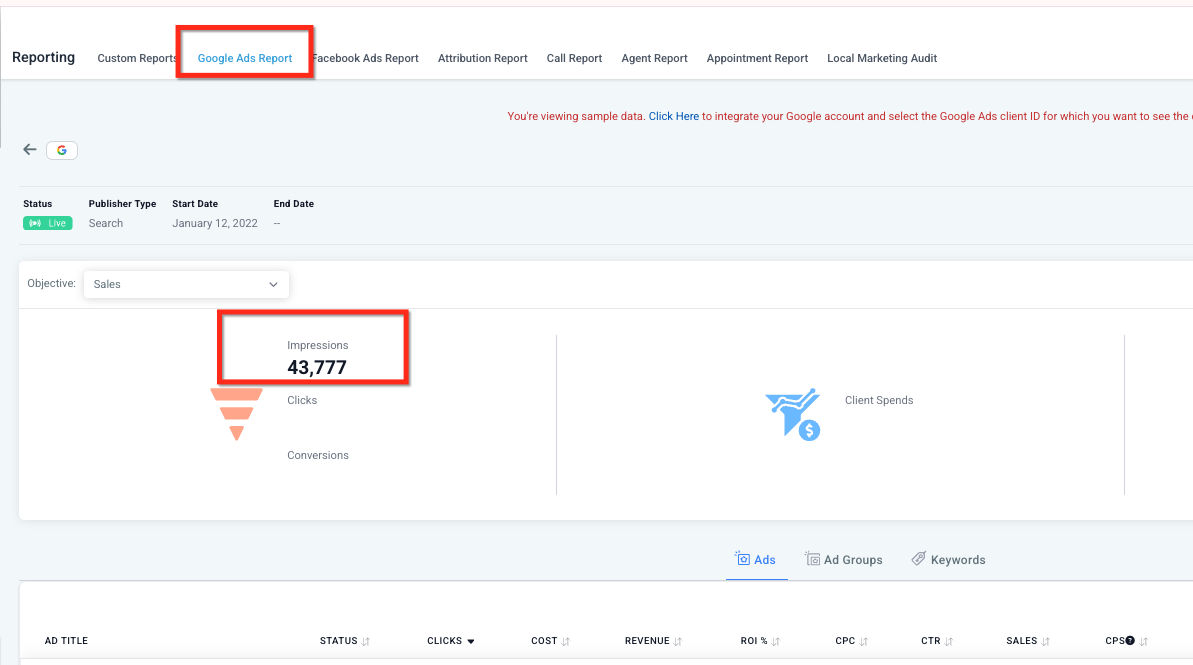
An impression is the number of times your ad was displayed to a user on a search results page or another site within the Google network.
A higher impression count generally means your ad is eligible to show more often based on your targeting, bids, and budget.
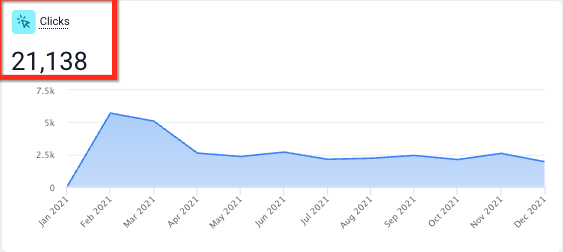
A click is counted whenever someone interacts with your ad, such as tapping the blue headline or the phone number on a text ad. Clicks are a quick indicator of how compelling your ad copy and offer are to the people seeing it.
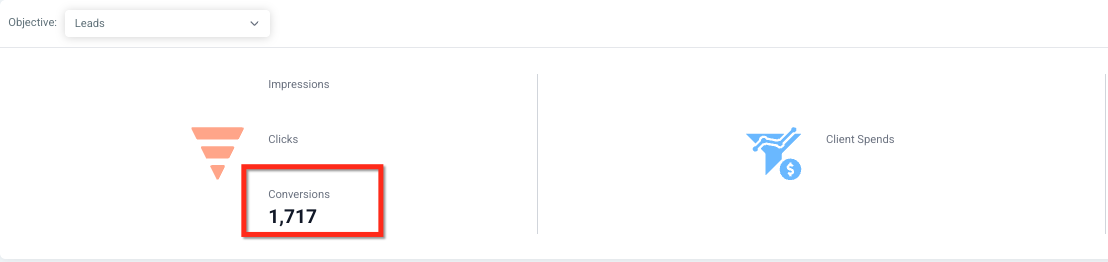
A conversion is any interaction with your website or landing page that you've defined as valuable, such as:
Submitting a form to request a consult
Calling your practice from the ad
Downloading a guide or offer
Signing up for your newsletter
Booking an appointment online
The goal of tracking conversions is to see how many ad clicks actually turn into prospective patients taking action, not just visiting a page.
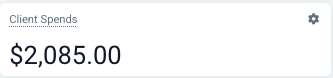
Client Spend is the total cost of running the ad campaign, plus any management fees configured for the account. This figure may be restricted based on your user permissions and isn't visible to every role.
Average CPC is the average amount paid for each click on your ad.
Formula: Total Ad Spend ÷ Total Clicks
CPC can vary based on several factors:
Your advertising budget
The number of impressions your ad receives
The location and time of day the ad shows
The type of content the ad appears alongside
A higher CPC generally means you're competing in a more expensive market or targeting a more competitive audience.
Cost Per Conversion, also called Cost per Acquisition (CPA), measures the average cost of generating one conversion.
Formula: Total Ad Spend ÷ Total Conversions
Use CPA to evaluate how efficiently a campaign turns ad spend into meaningful patient actions, like a booked consult or a submitted form.
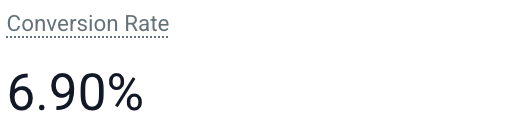
Conversion Rate is the percentage of ad interactions that resulted in a conversion.
Formula: (Conversions ÷ Clicks) × 100
Example: 50 conversions from 1,000 clicks = a 5% conversion rate (50 ÷ 1,000 = 0.05).
A higher conversion rate usually points to stronger ad messaging and a landing page or form that matches what the ad promised.
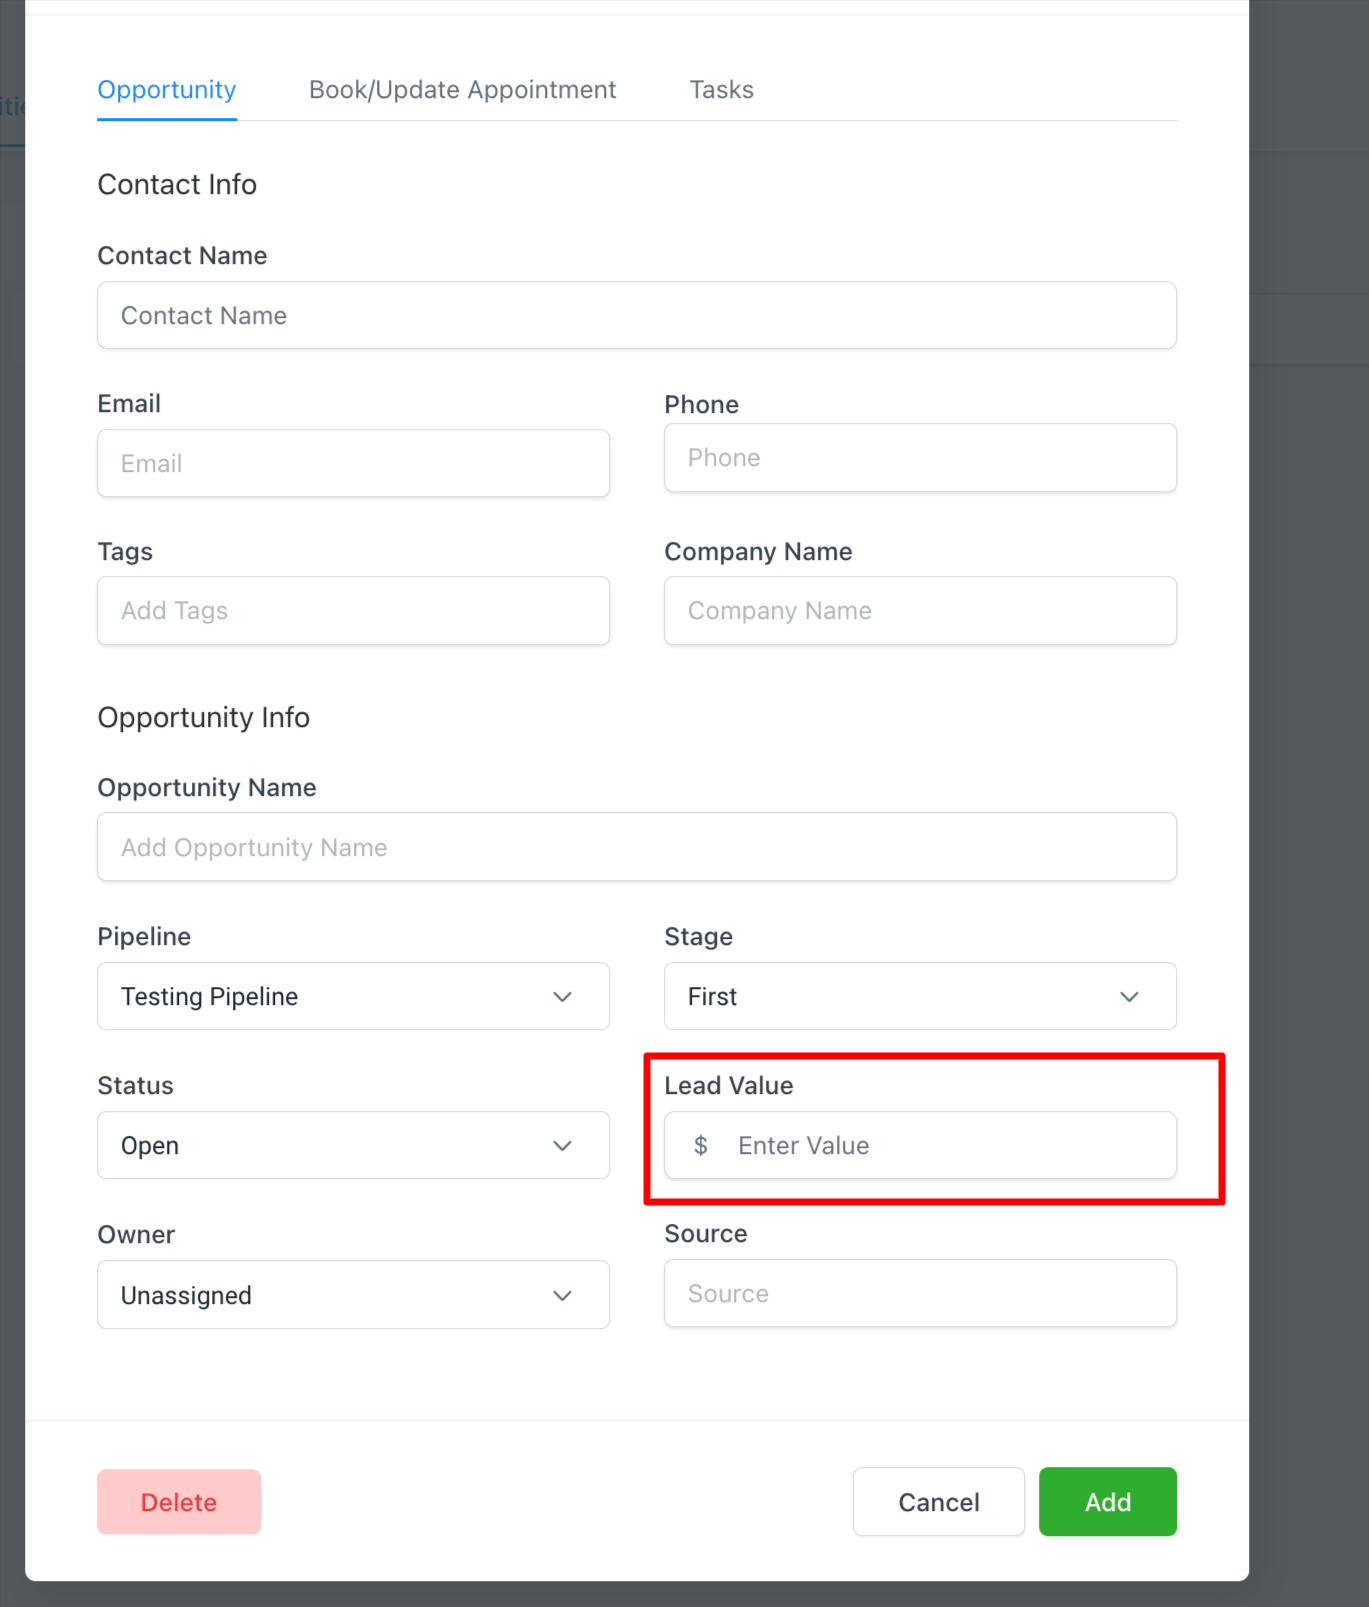
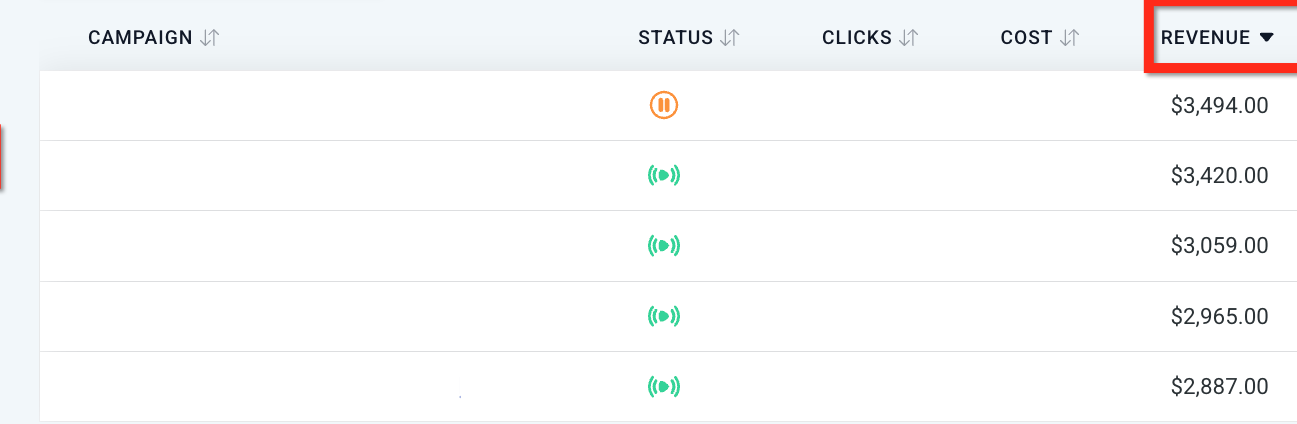
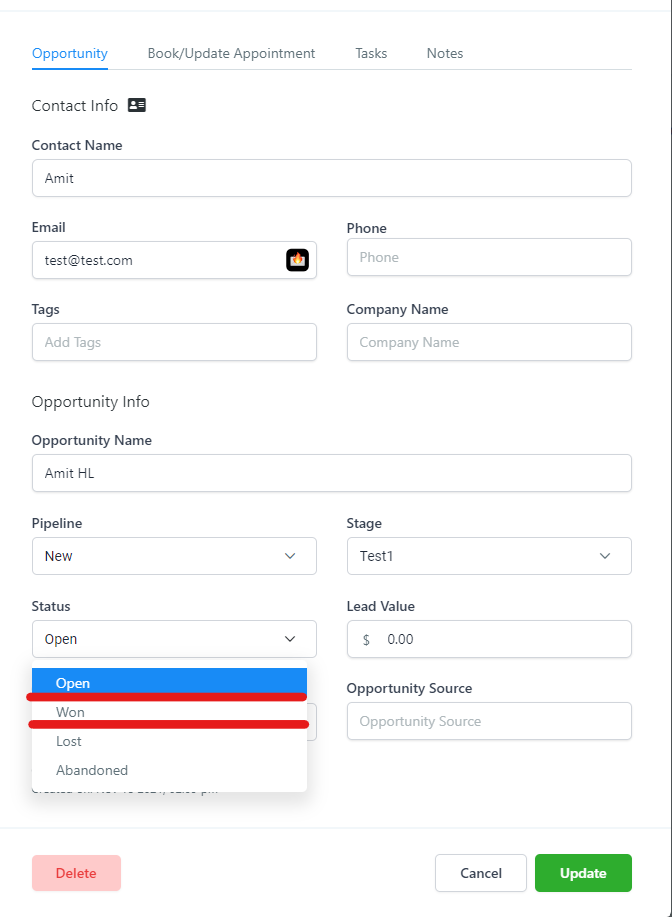
Revenue is the total value of opportunities marked Won that are attributed to a specific Google ad campaign. When an opportunity is marked Won, it carries a lead value (a monetary amount) that rolls up into this total.
When entering a lead value, use whole numbers only. You don't need to add a dollar sign since the field already accounts for currency.
ROI measures how profitable your advertising efforts are by comparing what a campaign cost against the revenue it generated.
Common formula: (Revenue − Ad Spend) ÷ Ad Spend
You can review ROI at the overall account level or broken down by individual campaign.
Sales refers to the leads and opportunities that have been marked Won, connecting your ad performance directly to booked, paying patients.
CPS shows the average cost required to generate one sale.
Formula: Total Ad Spend ÷ Number of Sales (opportunities marked Won)
This metric is most reliable when your pipeline stages are kept up to date and opportunities are consistently marked Won or Lost.
Leads refers to the opportunities recorded as open, meaning they came in through a form submission, a chat widget response, or a phone call and haven't yet been marked Won or Lost.
CPL shows the average cost to generate one open lead.
Formula: Total Ad Spend ÷ Number of Leads (opportunities in the open stage)
CPL is useful for comparing how efficiently different campaigns or audiences are generating new prospective patients, even before those leads convert into booked appointments.

Why do my reporting numbers differ from what I see in Google Ads directly? Differences usually come down to time zones, date ranges, attribution rules, or filters. Confirm both views are using the same reporting window and settings before comparing them.
How do I make sure Revenue and ROI are accurate? Every opportunity needs a numeric lead value and must be marked Won when the patient books and pays. Revenue and ROI calculations rely entirely on those values being entered correctly.
Do I need conversion tracking set up for these metrics to work? Yes. Conversions and Conversion Rate depend on conversion tracking being correctly configured for your Google Ads account and connected to Aesthetix CRM.
Can I view these metrics by individual campaign or ad group? Yes, where the reporting view supports it. Filters and breakdowns let you review performance at the campaign, ad group, or overall account level. See Ads Manager > Ad Reporting for the reporting screens themselves.
Why are my CPL or CPS numbers high on some campaigns? High CPL or CPS usually points to spend that isn't converting into leads or sales efficiently. Review your targeting, ad messaging, landing page experience, and tracking accuracy for that campaign.
What's the difference between Leads and Sales? Leads are opportunities still in the open stage, meaning the prospective patient hasn't been booked or closed yet. Sales are opportunities that have already been marked Won.
Does Client Spend include my ad platform's actual billing, or just what shows in reporting? Client Spend reflects the cost of running the ad plus any configured management fees. Always cross-check against your Google Ads billing if you need the exact platform charge.
Where do these metrics come from if I also run ads on other networks? This glossary covers Google Ads reporting specifically. Other ad networks report through Ads Manager > Ad Reporting using the same underlying lead, opportunity, and revenue data from your account.
