Site Analytics gives you a real-time view of how visitors interact with your practice's funnels, websites, and webinars before they ever become a lead. You'll find it under Sites > Analytics in Aesthetix CRM. Use it to see how many people are landing on your pages, how long they stay, and where they drop off, then use Advanced Filters to narrow that traffic down to the exact segment you want to study, such as visitors from a specific city or device type.
This guide covers site-wide traffic metrics (page views, time on site, session duration, bounce rate) and how to build Advanced Filters. Per-funnel conversion metrics like opt-ins, sales, QR code scans, and webinar attendance are covered in the Funnels and Websites analytics guides, since those numbers are tied to individual funnel steps and offers rather than overall site traffic.
These metrics describe how visitors move through your practice's web presence, independent of any specific offer or funnel step.
Tracks how many times your funnel, website, or webinar pages are visited.
Type | Description |
|---|---|
All | All page views, including every individual visit and repeat visits from the same person. |
Unique | Unique visitors who visited the page at least once. |
Example: If one prospective patient visits the same page twice, All = 2 and Unique = 1.
Tracks the average amount of time visitors spend on your site during the selected date range.
Calculation: Total time spent by all visitors divided by total number of sessions.
What it tells you: How long visitors typically stay engaged with your practice's site over time.
Example: If visitors spend a combined total of 2,000 minutes across 400 sessions, Average Time on Site = 5 minutes.
Tracks the average length of individual sessions across the selected date range.
Calculation: Sum of all session durations divided by total number of sessions.
What it tells you: Overall engagement on a per-session basis, which is a slightly different lens than Average Time on Site. Average Time on Site shows the overall engagement trend across your date range, while Average Session Duration shows engagement at the individual session level. Both are useful together: a rising Average Time on Site with a flat Average Session Duration usually means more repeat visits, not longer individual visits.
Example: If total session duration is 1,500 minutes across 300 sessions, Average Session Duration = 5 minutes.
Tracks how many sessions end shortly after a visitor lands on your site.
Calculation: (Sessions that ended within 30 seconds divided by total sessions) x 100.
What it tells you: Short-lived, low-engagement sessions, often caused by slow load times, irrelevant content, or a page that doesn't match what the visitor expected to find (for example, an ad promising a promotion that isn't visible on the landing page).
Example: If 45 sessions ended within 30 seconds out of 300 total sessions, Bounce Rate = 15%.
Site Analytics is the home for traffic and engagement numbers. Metrics tied to a specific offer or funnel step, such as opt-in rate, sales orders, sales amount, average cart value, QR code scans, and webinar registration and attendance stats, are documented in the Funnels and Websites analytics guides, since those are reviewed at the funnel-step level rather than site-wide. Ad-network performance (ad spend, cost per lead) lives in Ad Manager reporting, and patient review and reputation metrics live in Review Management reporting.
A few patterns are worth checking on regularly:
Growing unique visitors is generally a good sign your marketing and referral efforts are working.
A rising bounce rate or a shrinking Average Time on Site can signal a page load issue, a mismatched ad message, or content that isn't resonating with prospective patients.
Compare traffic trends against your booked-consult numbers on your Dashboard to see whether more traffic is actually converting into appointments.
Advanced Filters let you narrow your analytics data down to the traffic segments that matter most, such as visitors from a particular city, browsing on a specific device, or arriving from a particular traffic source. This makes it easier to spot trends, compare audience segments, and make decisions from your analytics dashboard without exporting data for outside analysis.
Advanced Filters let you build a targeted view of your analytics by selecting filter dimensions (such as city, state or province, country, page title, browser, device type, source, and medium) and combining them with AND/OR logic. You can also nest filters to group related conditions together when you need more precise segmentation.
Key benefits:
Segment more precisely: Narrow analytics by attributes like geography, traffic source, page title, and browser.
Analyze multiple conditions at once: Combine filters to review specific audience groups and traffic patterns together.
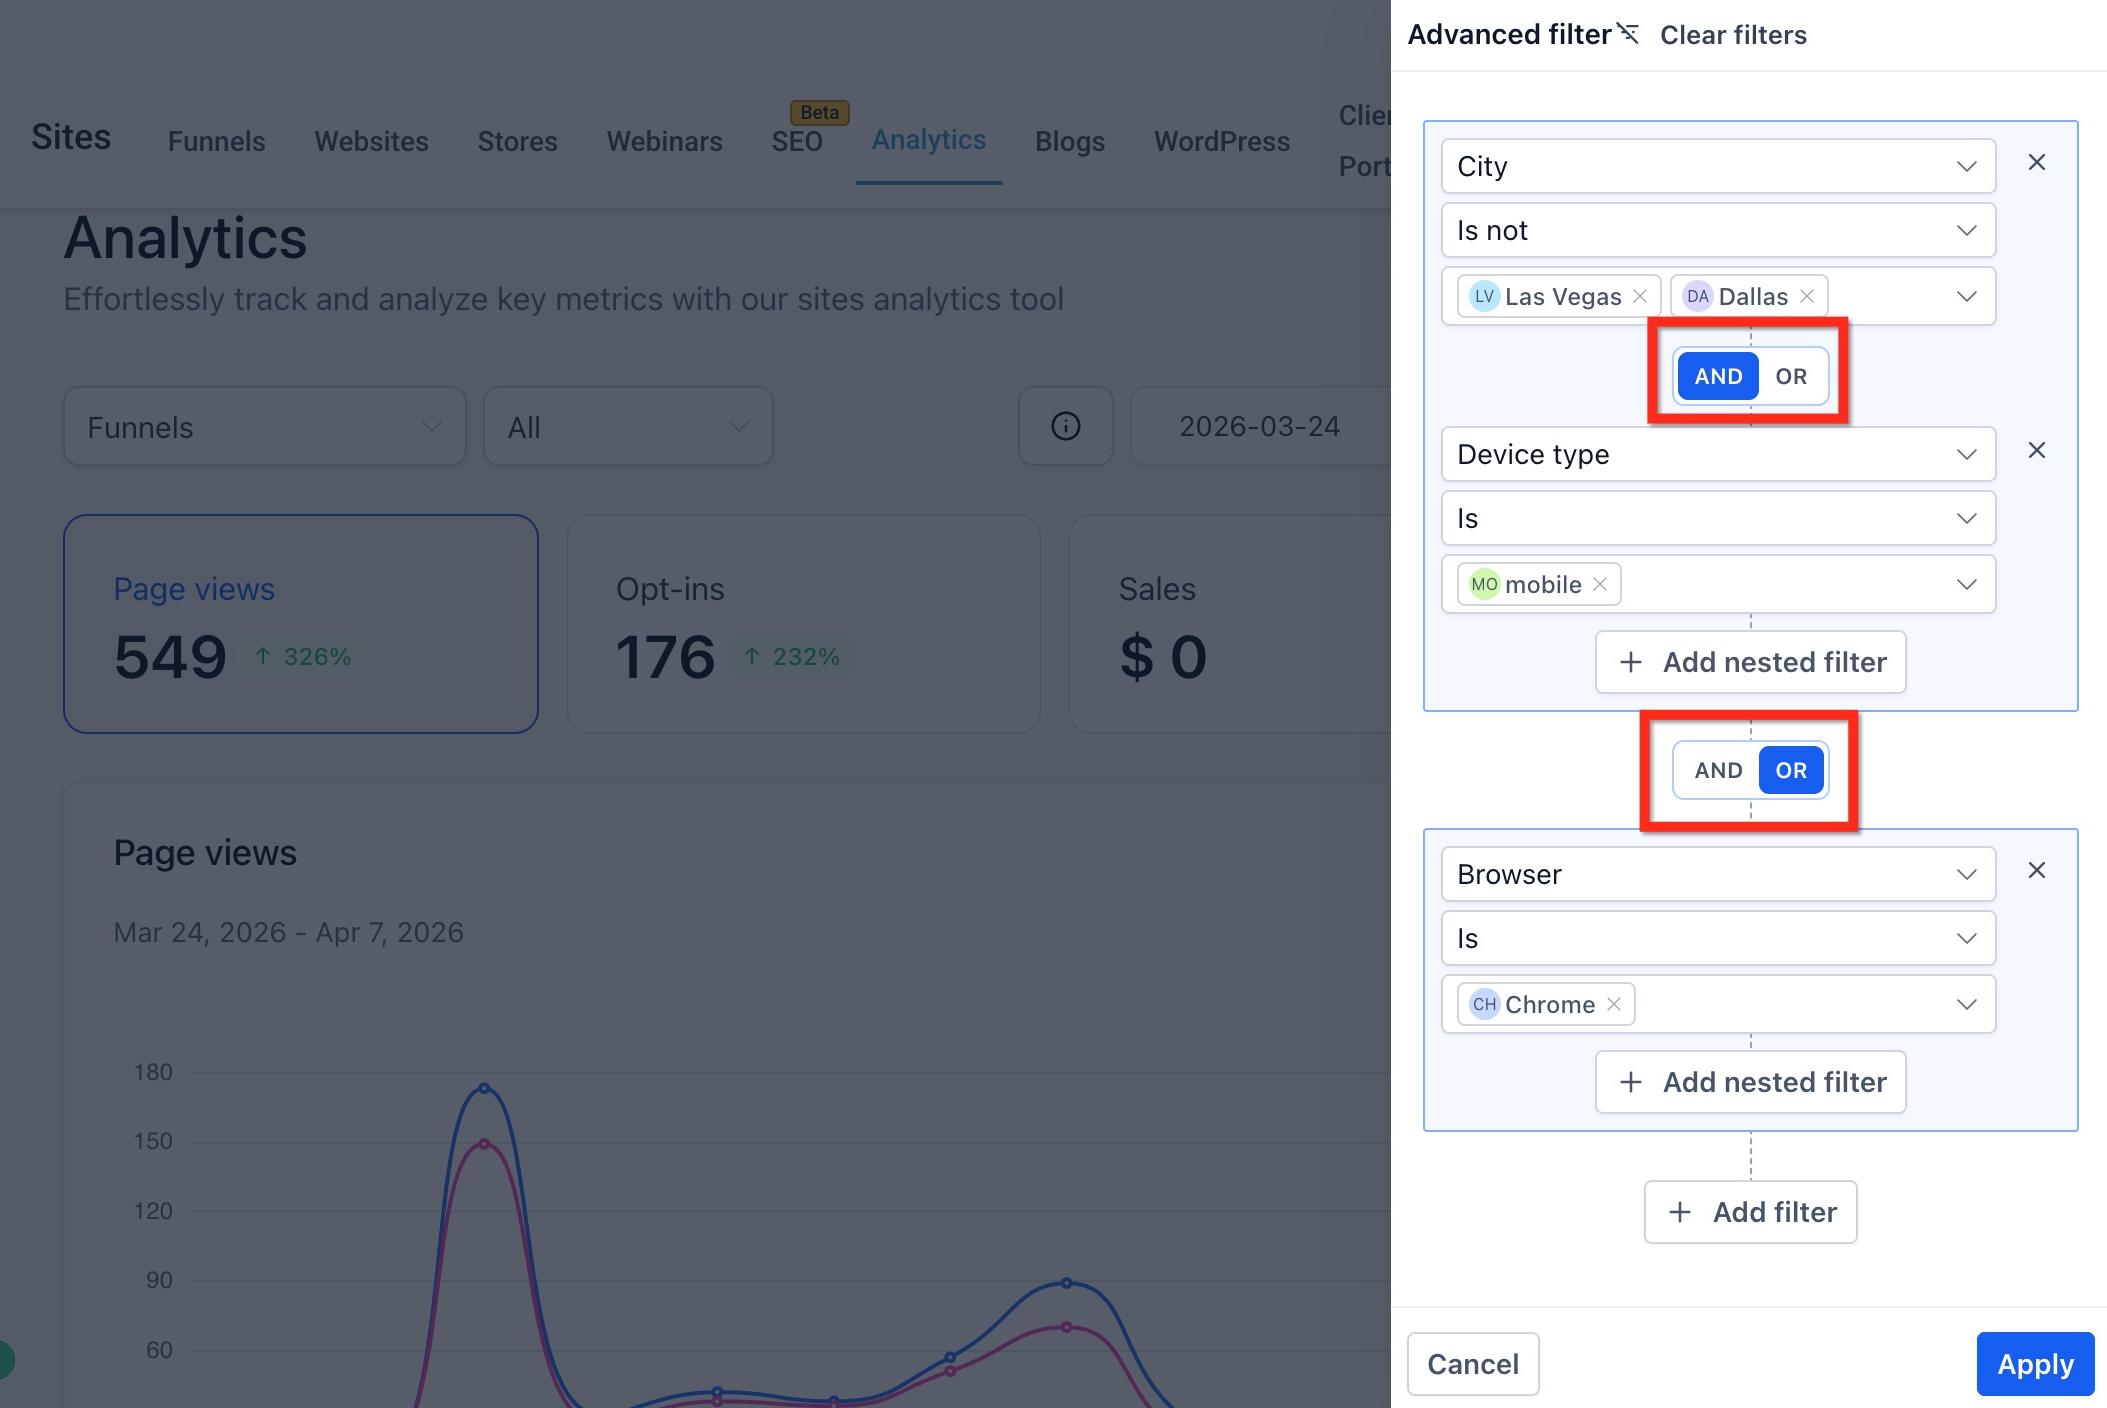
Use flexible filter logic: Apply AND and OR conditions to build accurate, layered views.
Create deeper filter groupings: Add nested filters to organize related conditions together.
Reset easily: Remove individual filters or clear all filters to start over.
You can apply Advanced Filters to:
Funnels
Websites
Webinars
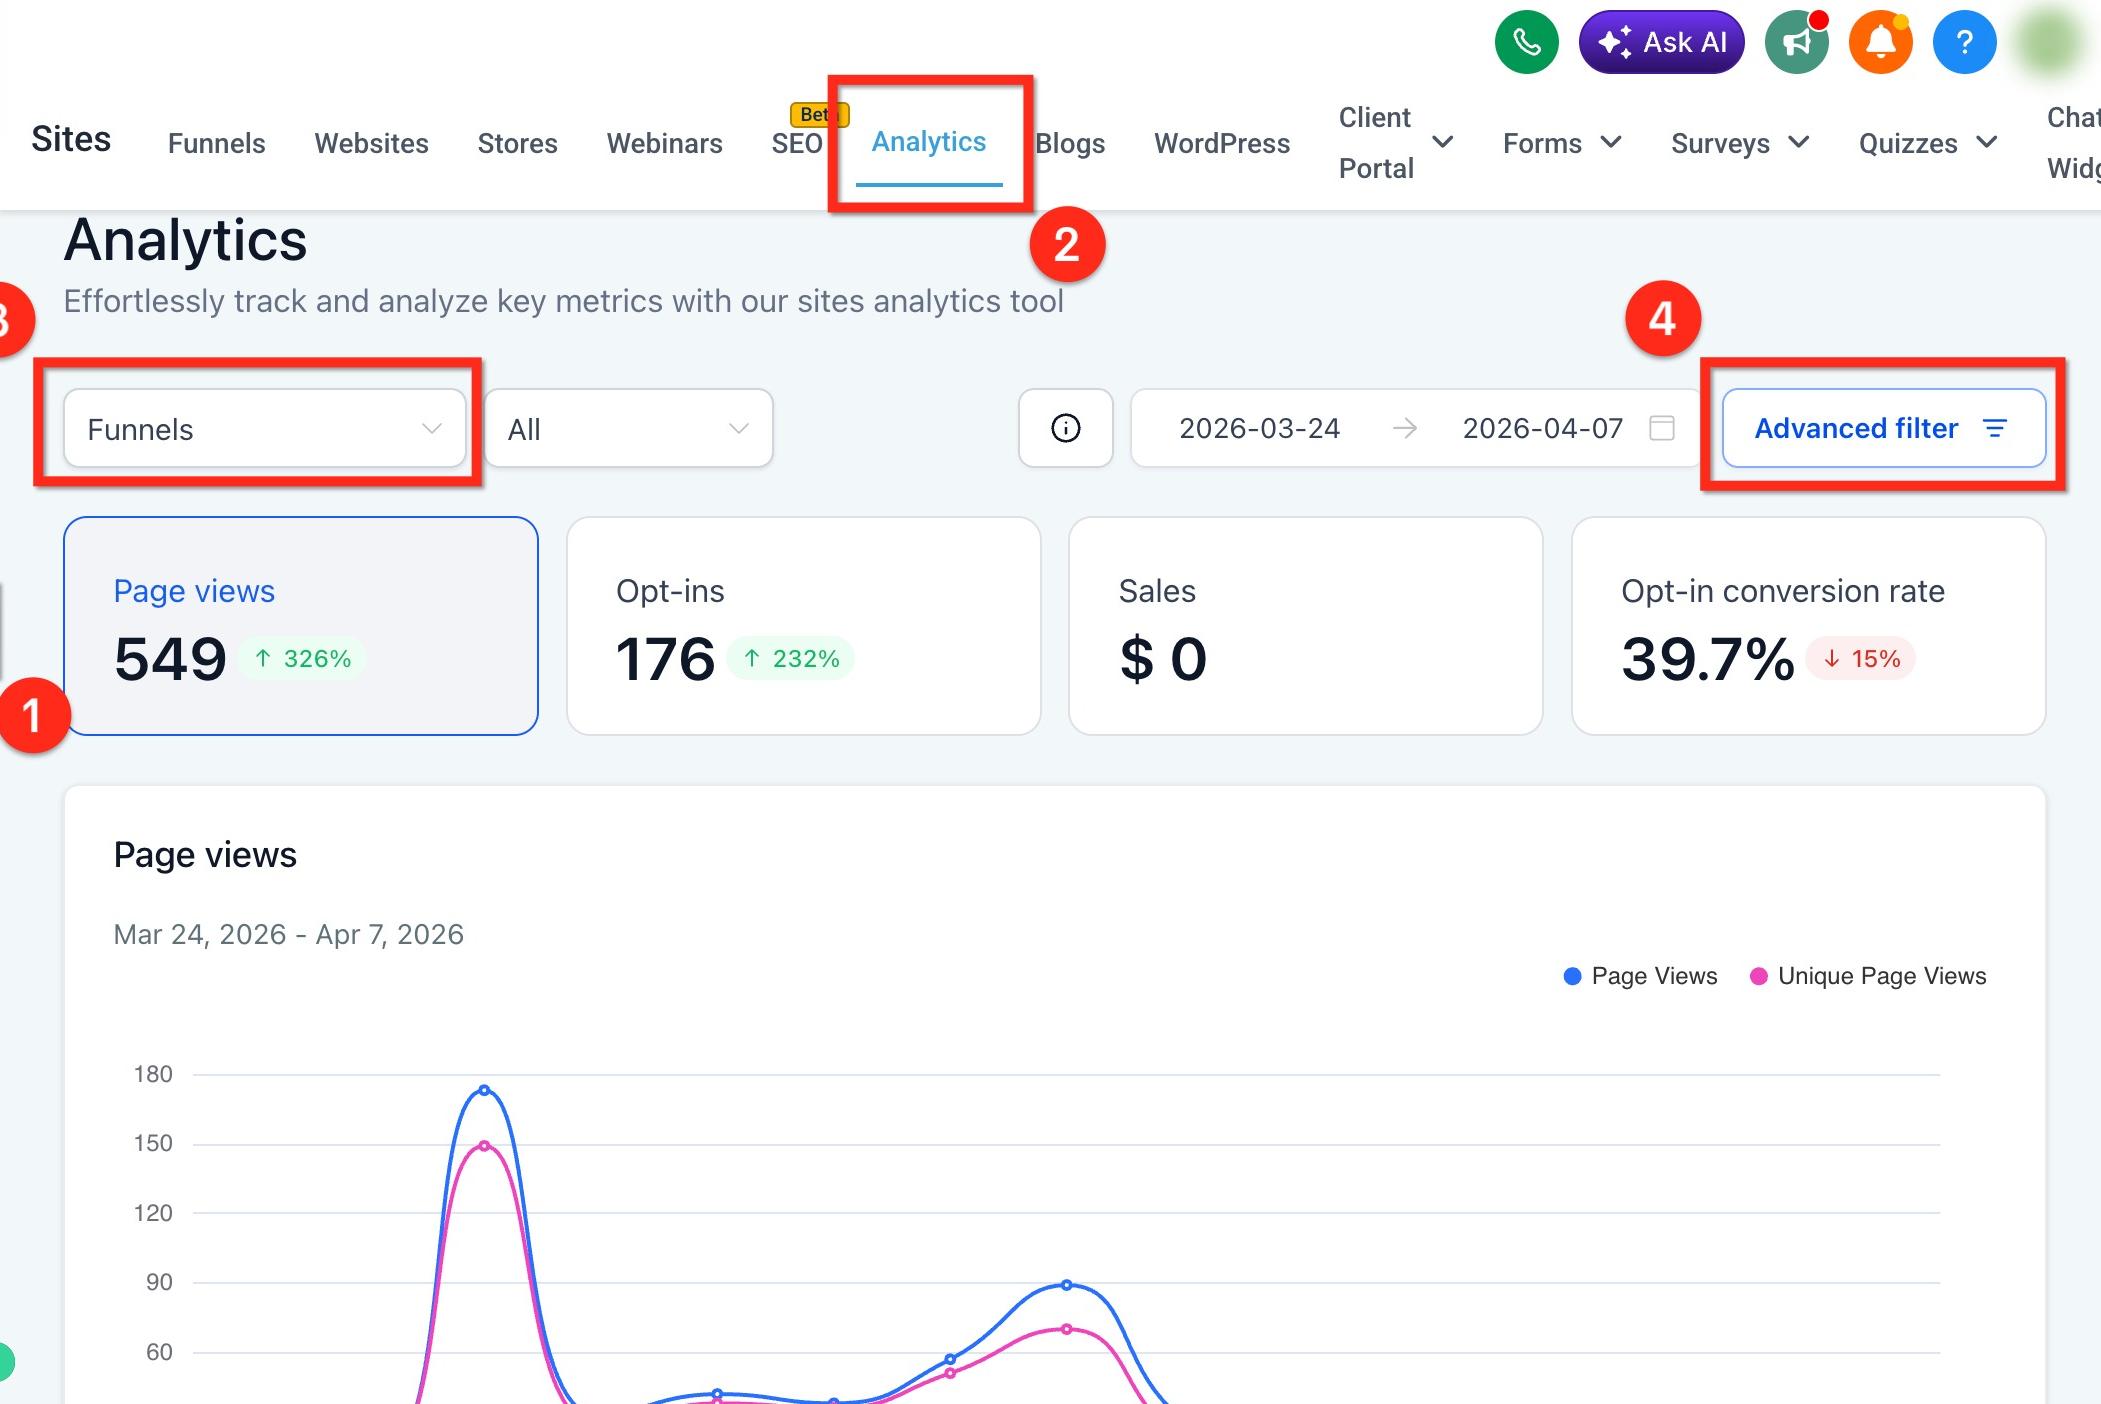
Click Sites in the left navigation menu.
Click Analytics in the top navigation bar.
Select a supported asset type (Funnels, Websites, or Webinars).
Click Advanced Filter in the top-right corner of the analytics dashboard.
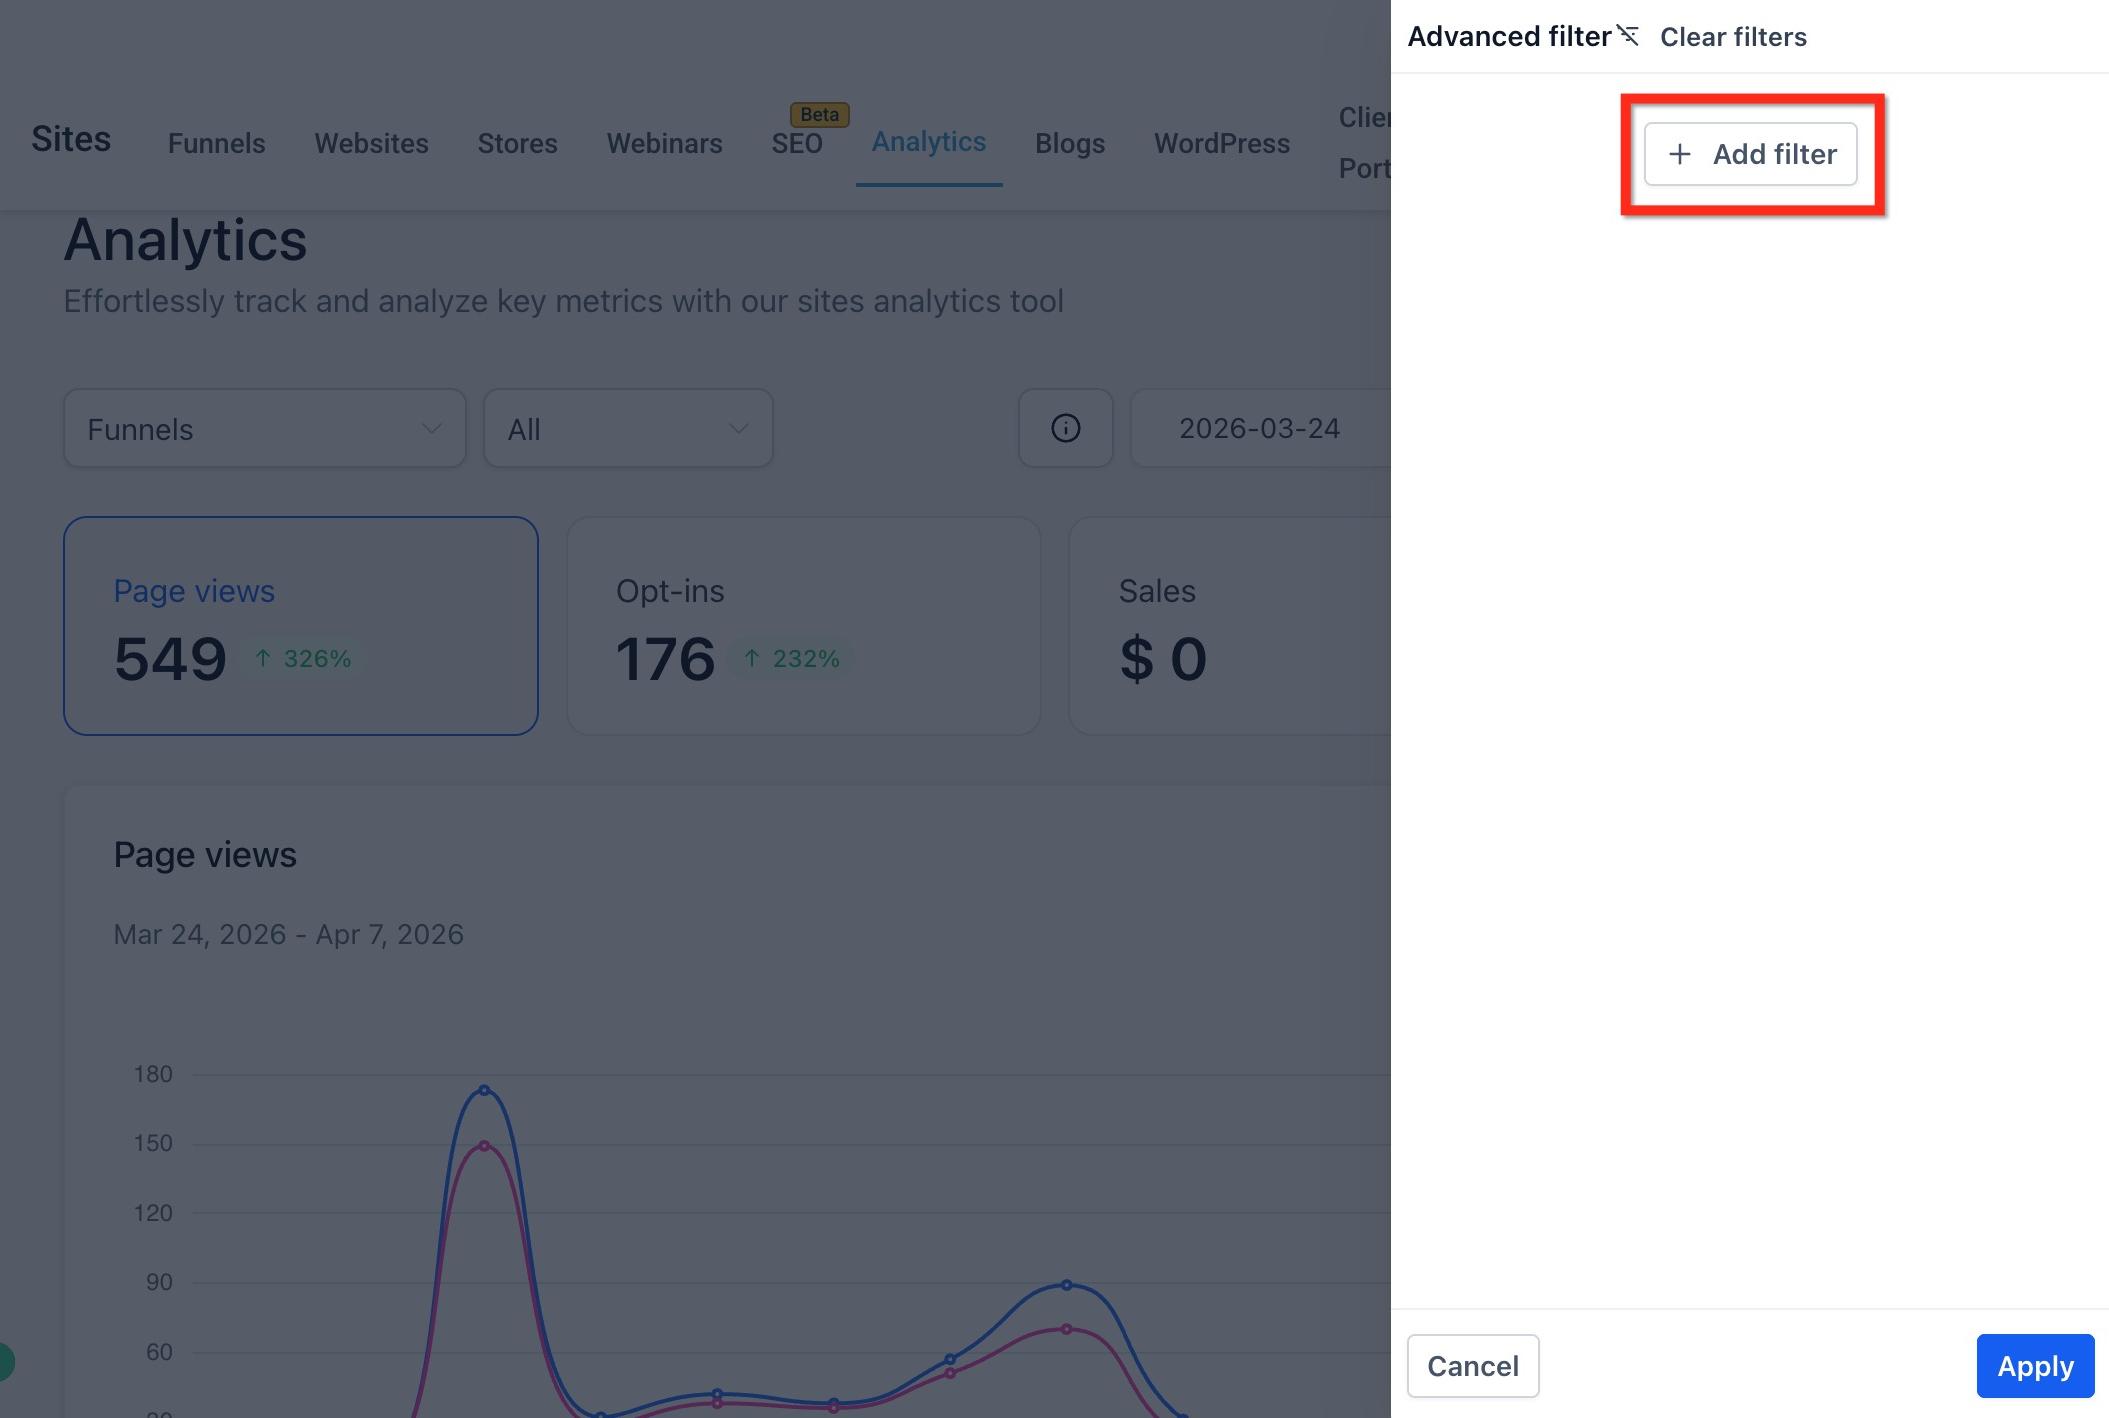
Click + Add Filter.
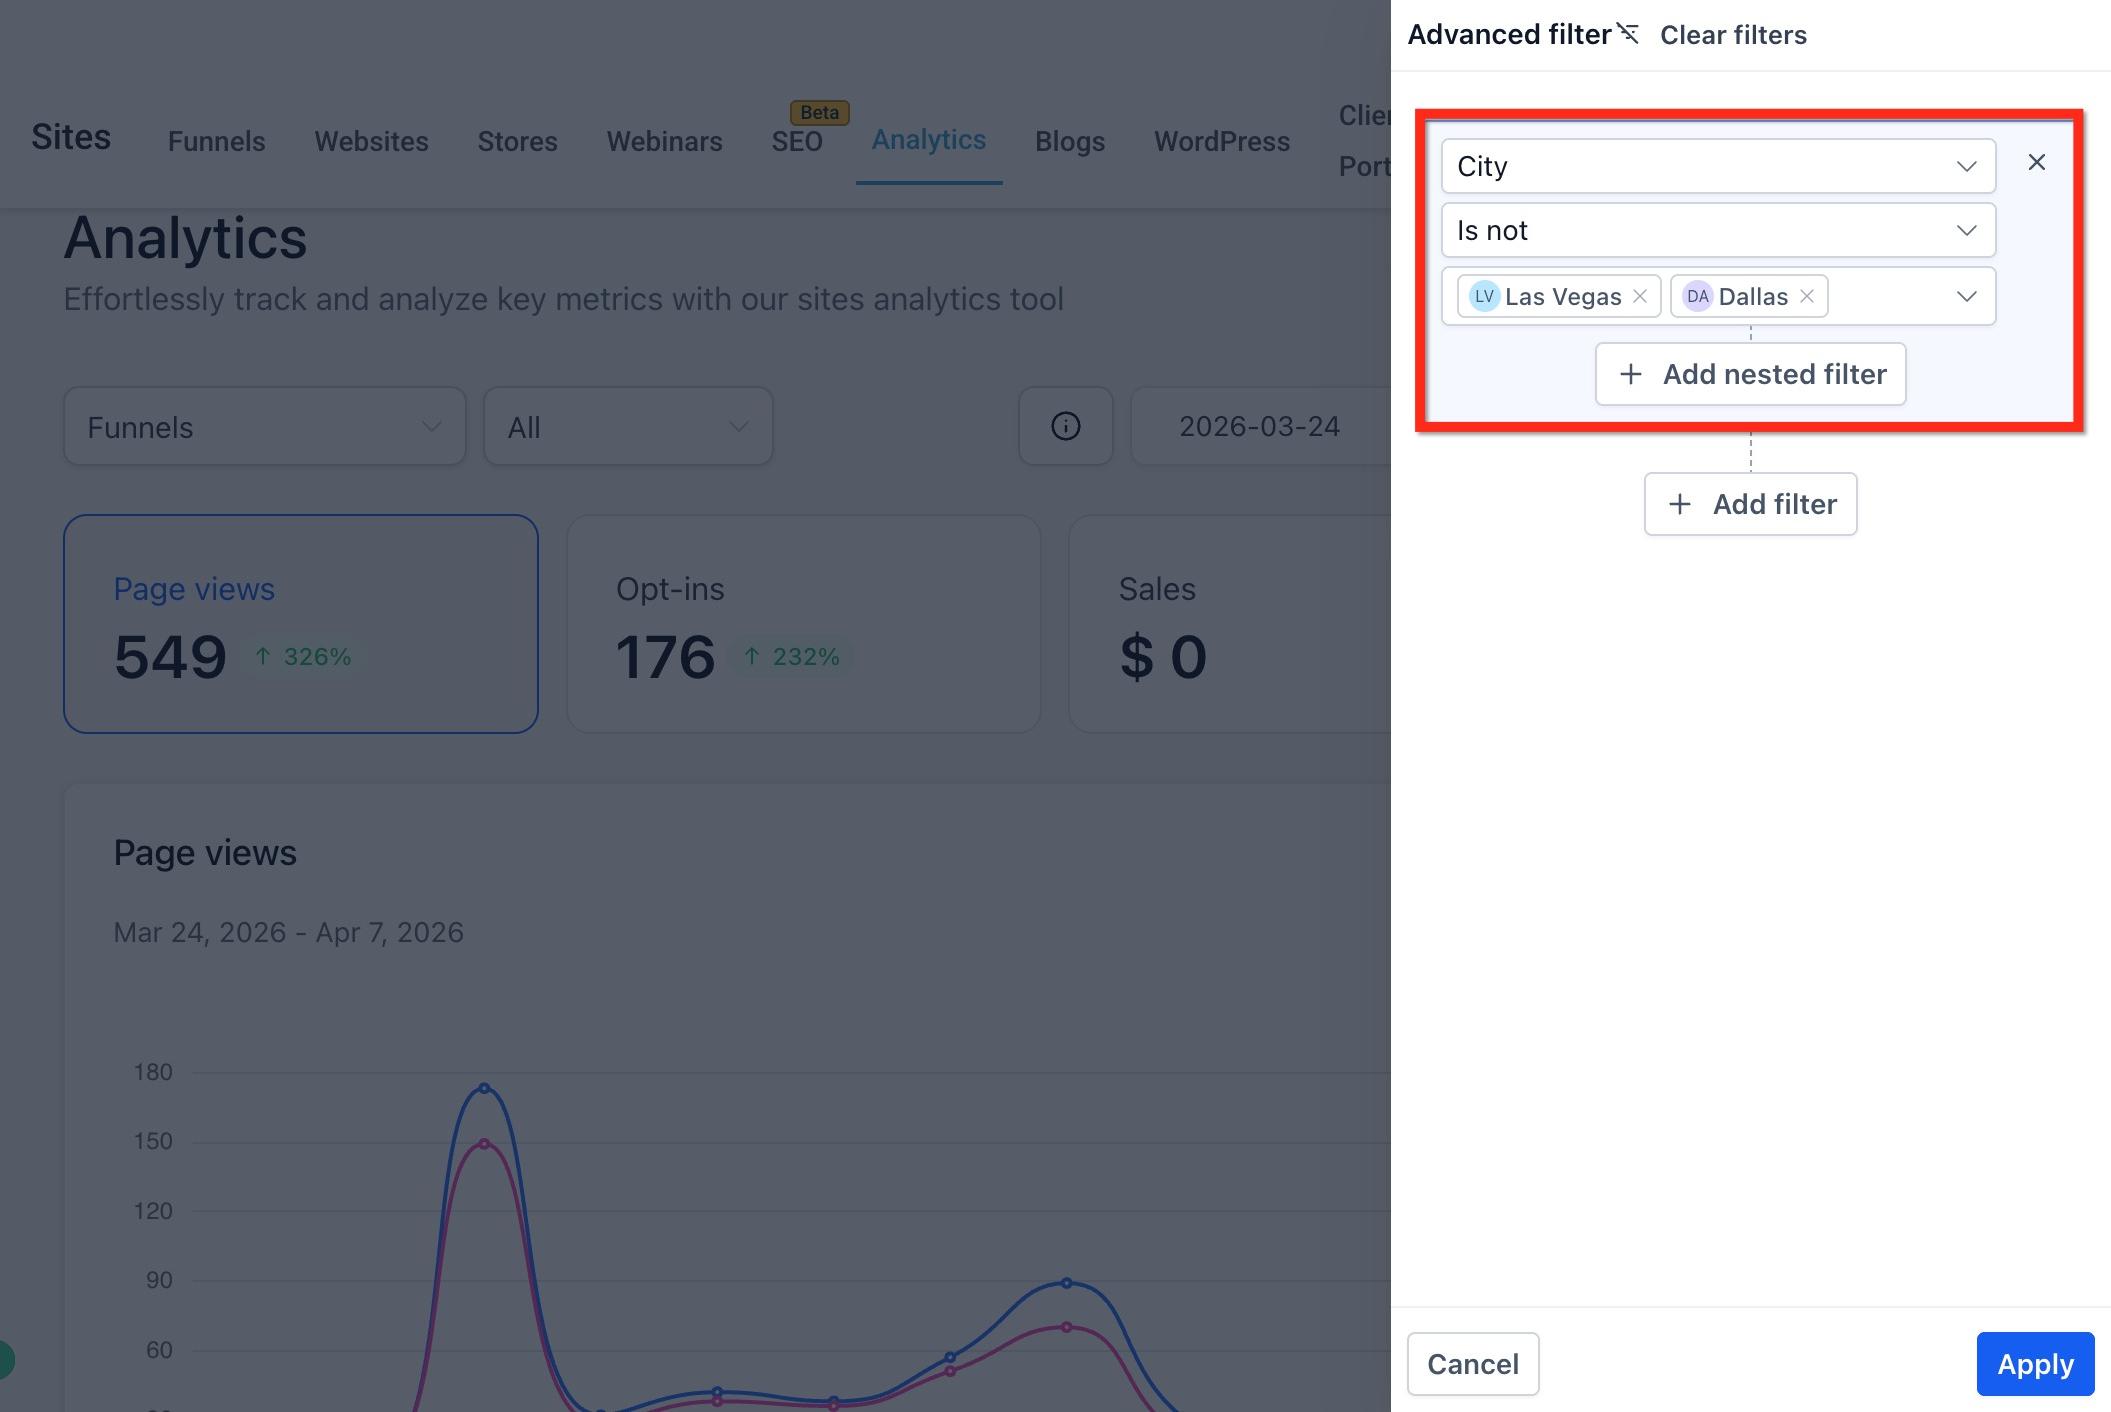
Choose the filter field you want to use, select the condition (Is or Is not), and choose one or more values to include or exclude.
Click Add Filter again to add another condition.
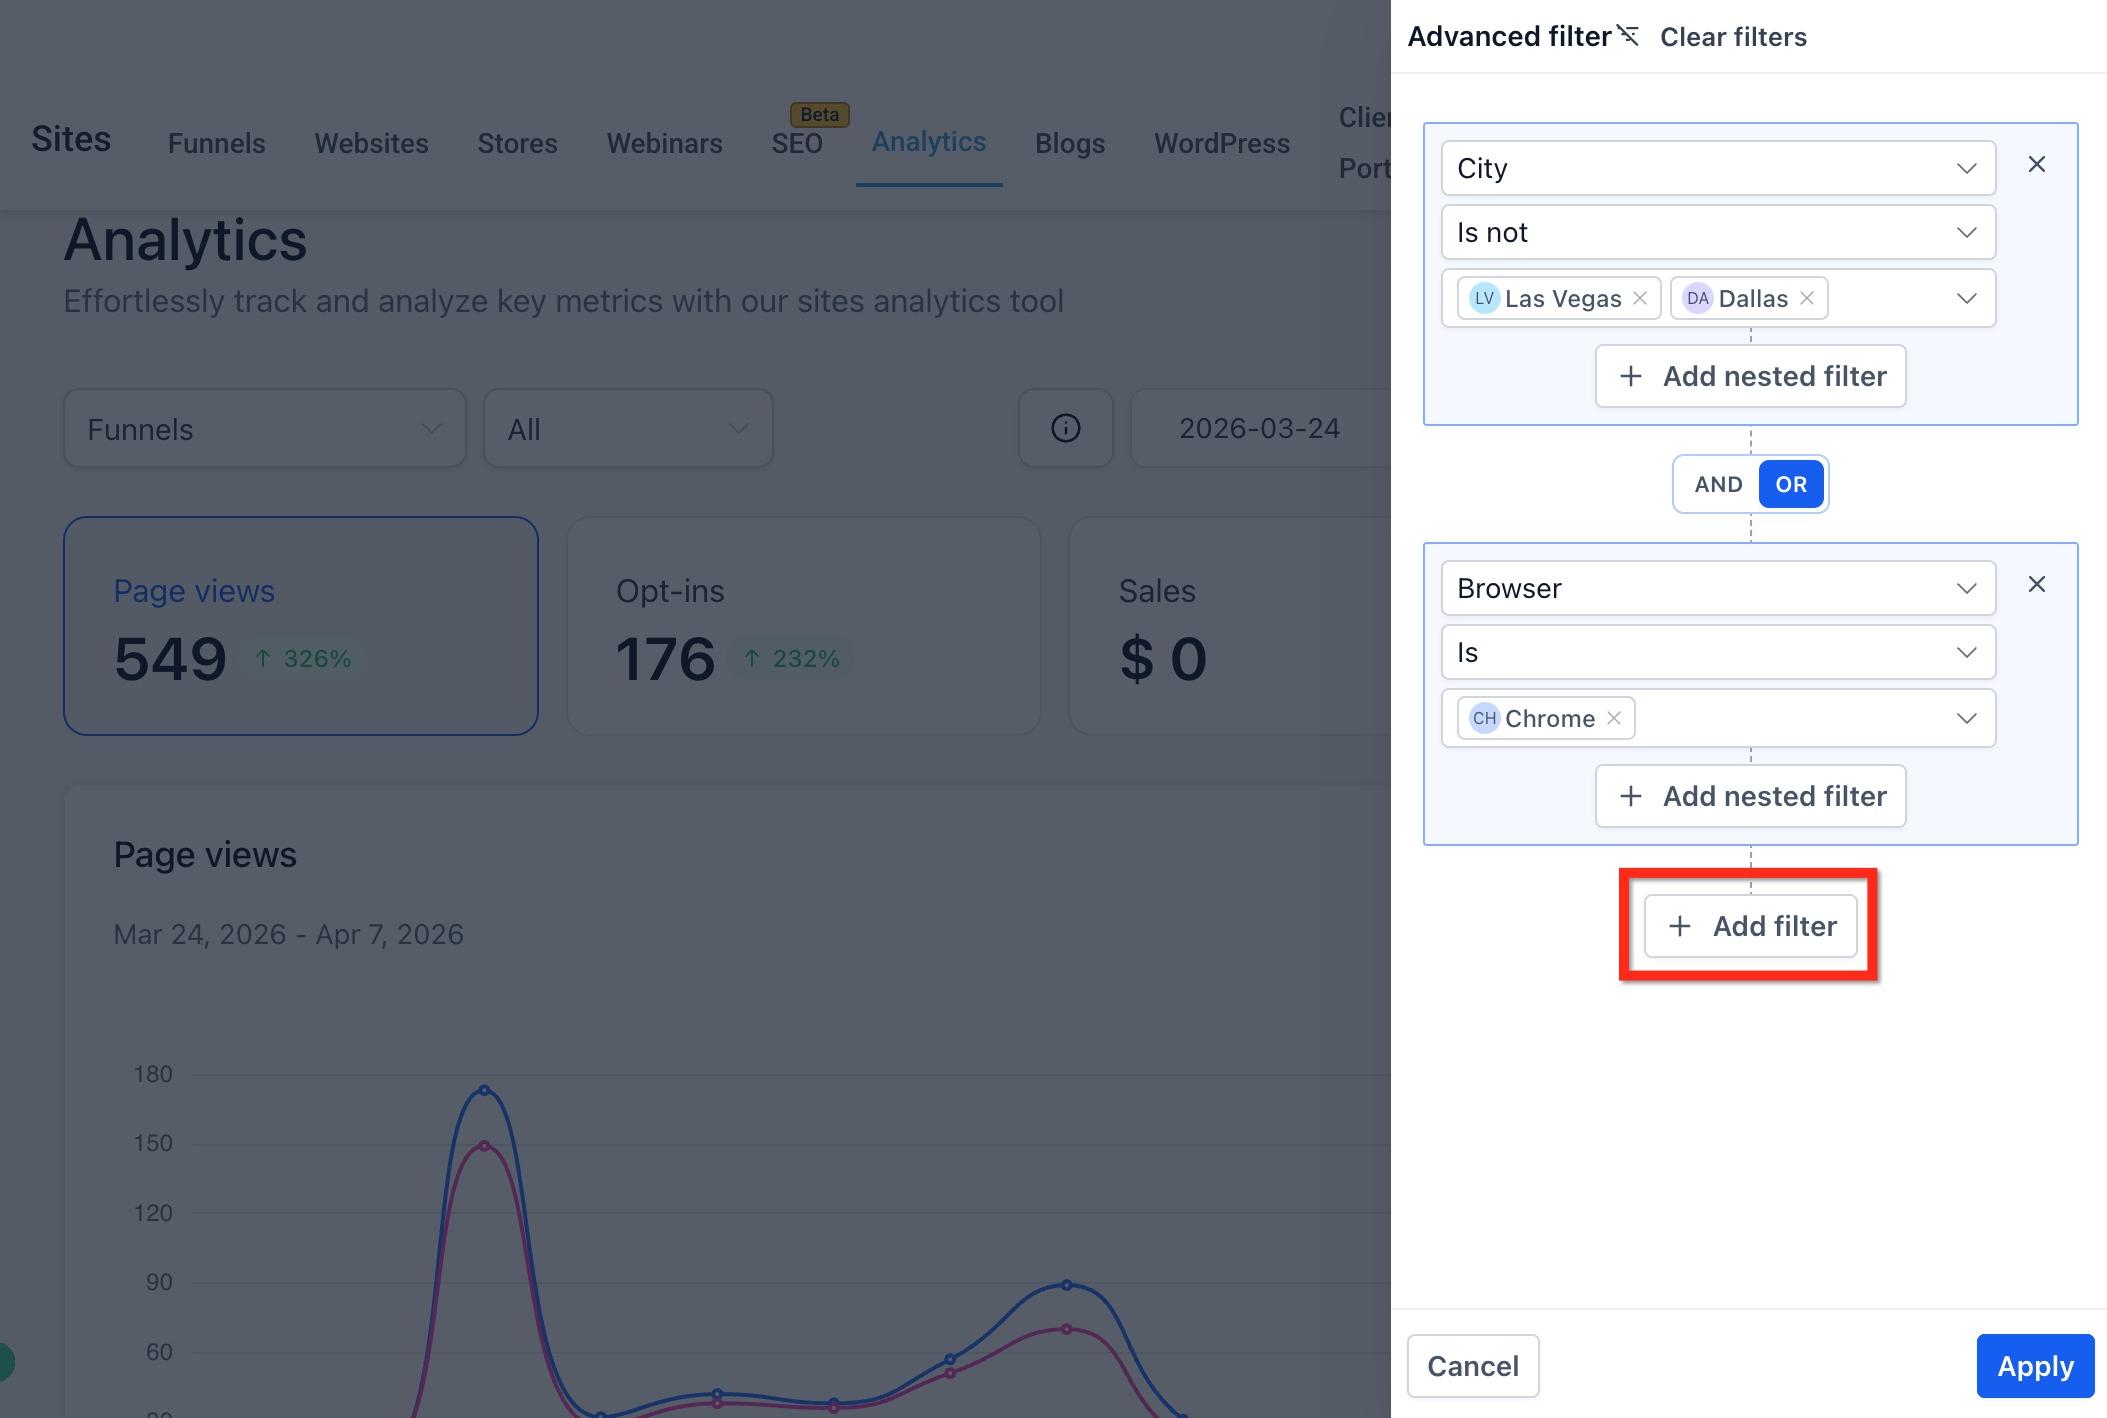
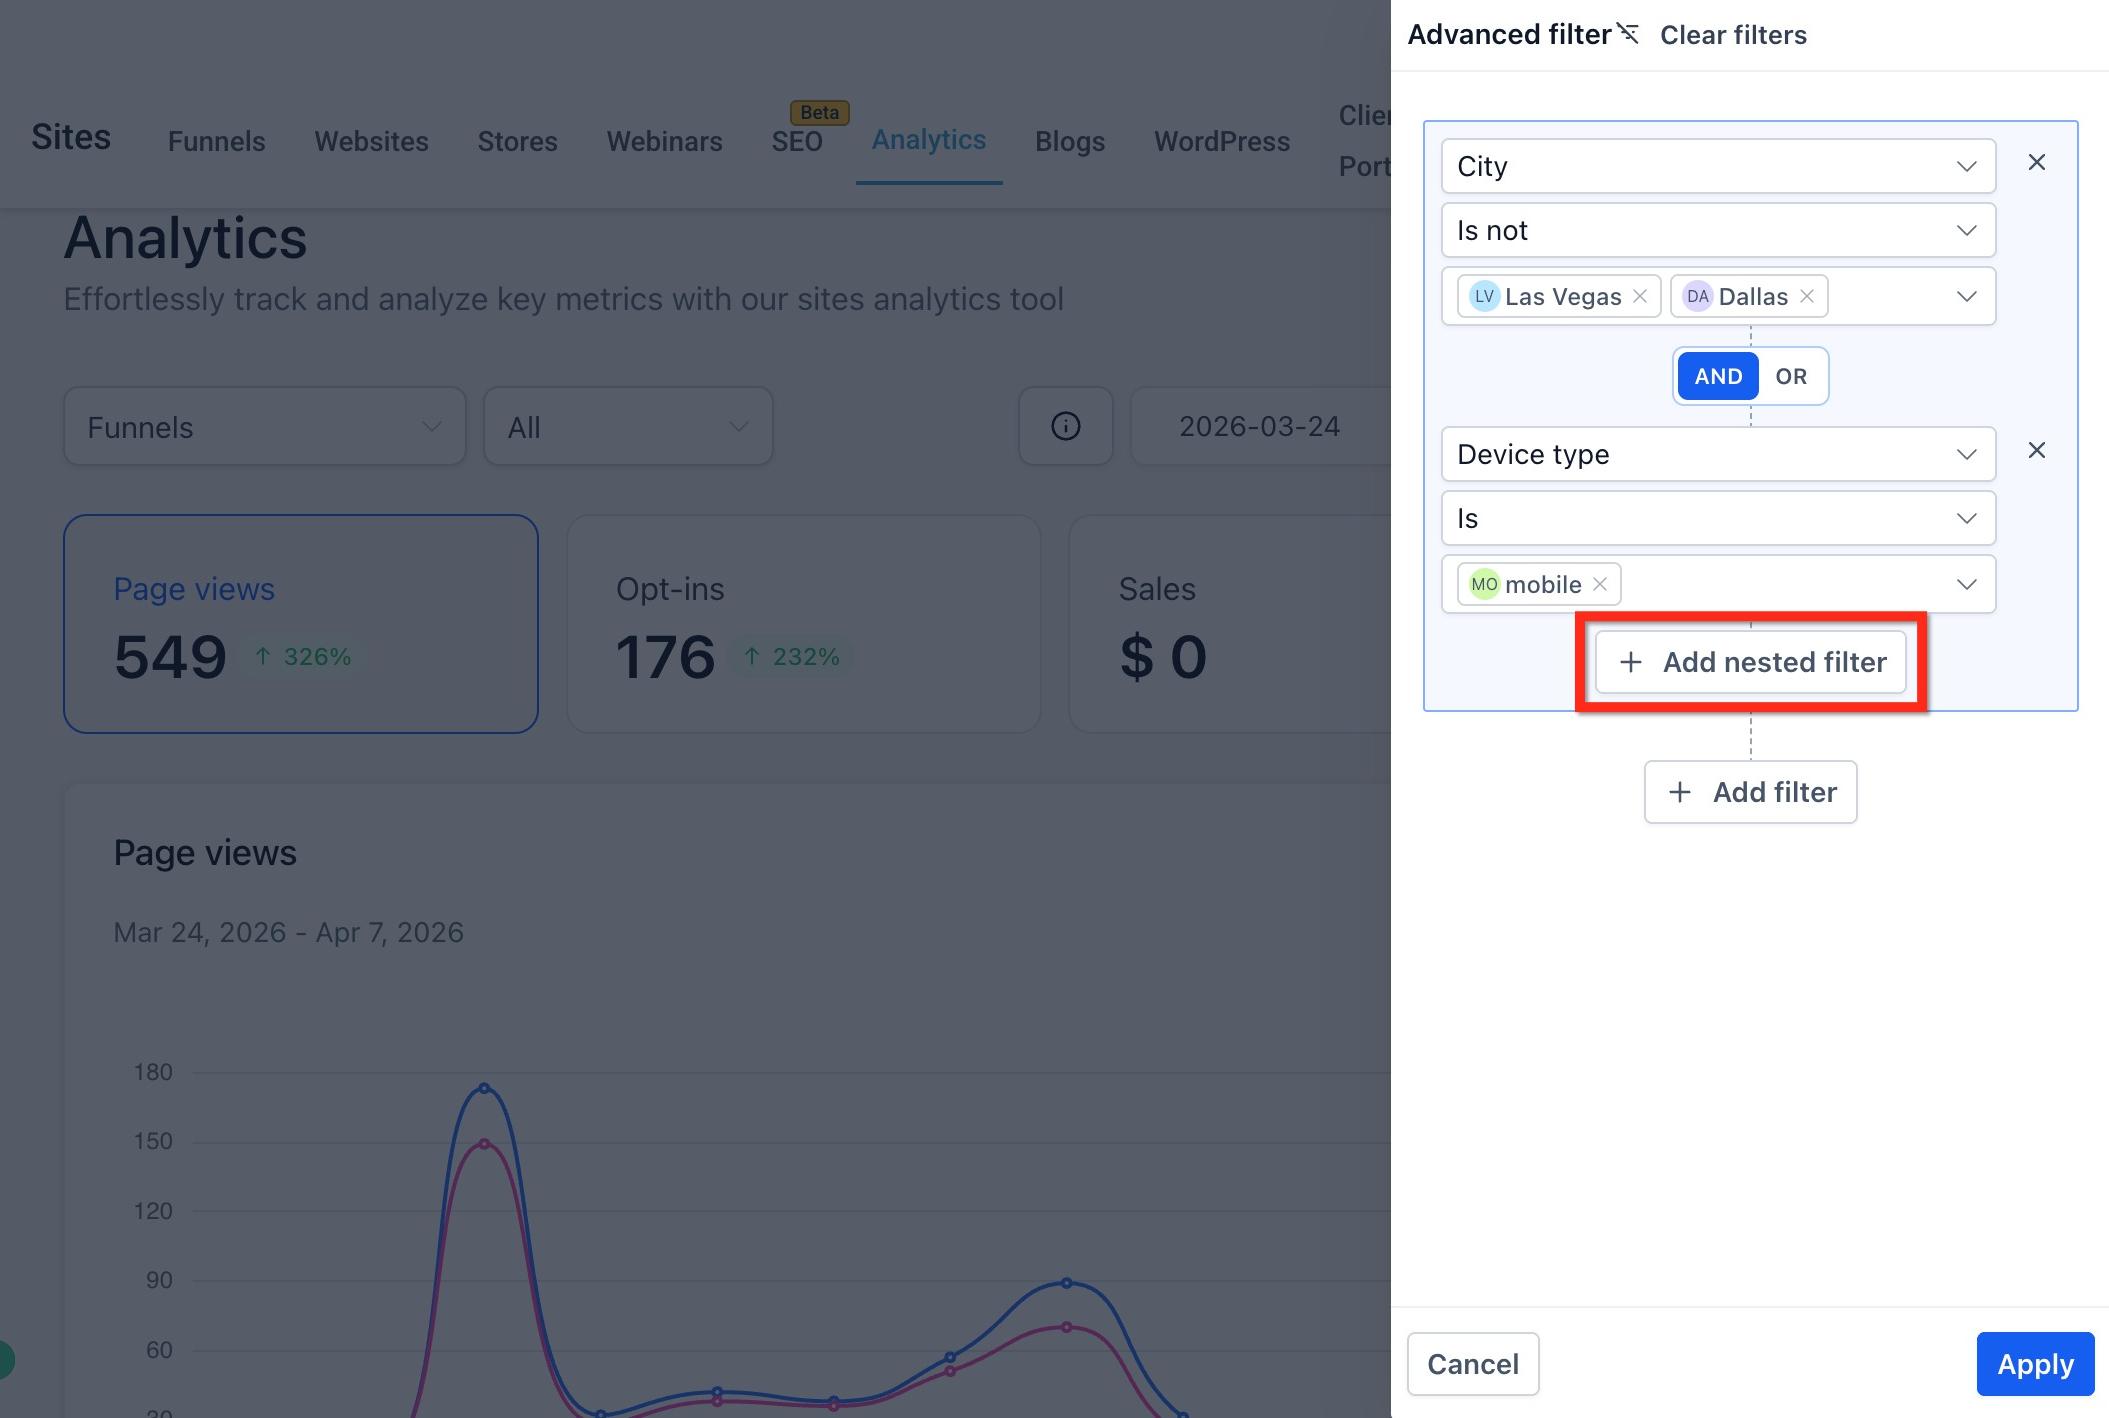
Click Add Nested Filter to create a grouped condition set inside your broader filter logic, useful when you need conditions to apply only to part of your filter setup.
Choose AND or OR to define how your filters should work together.
Click Apply to update the analytics dashboard with your filtered results.
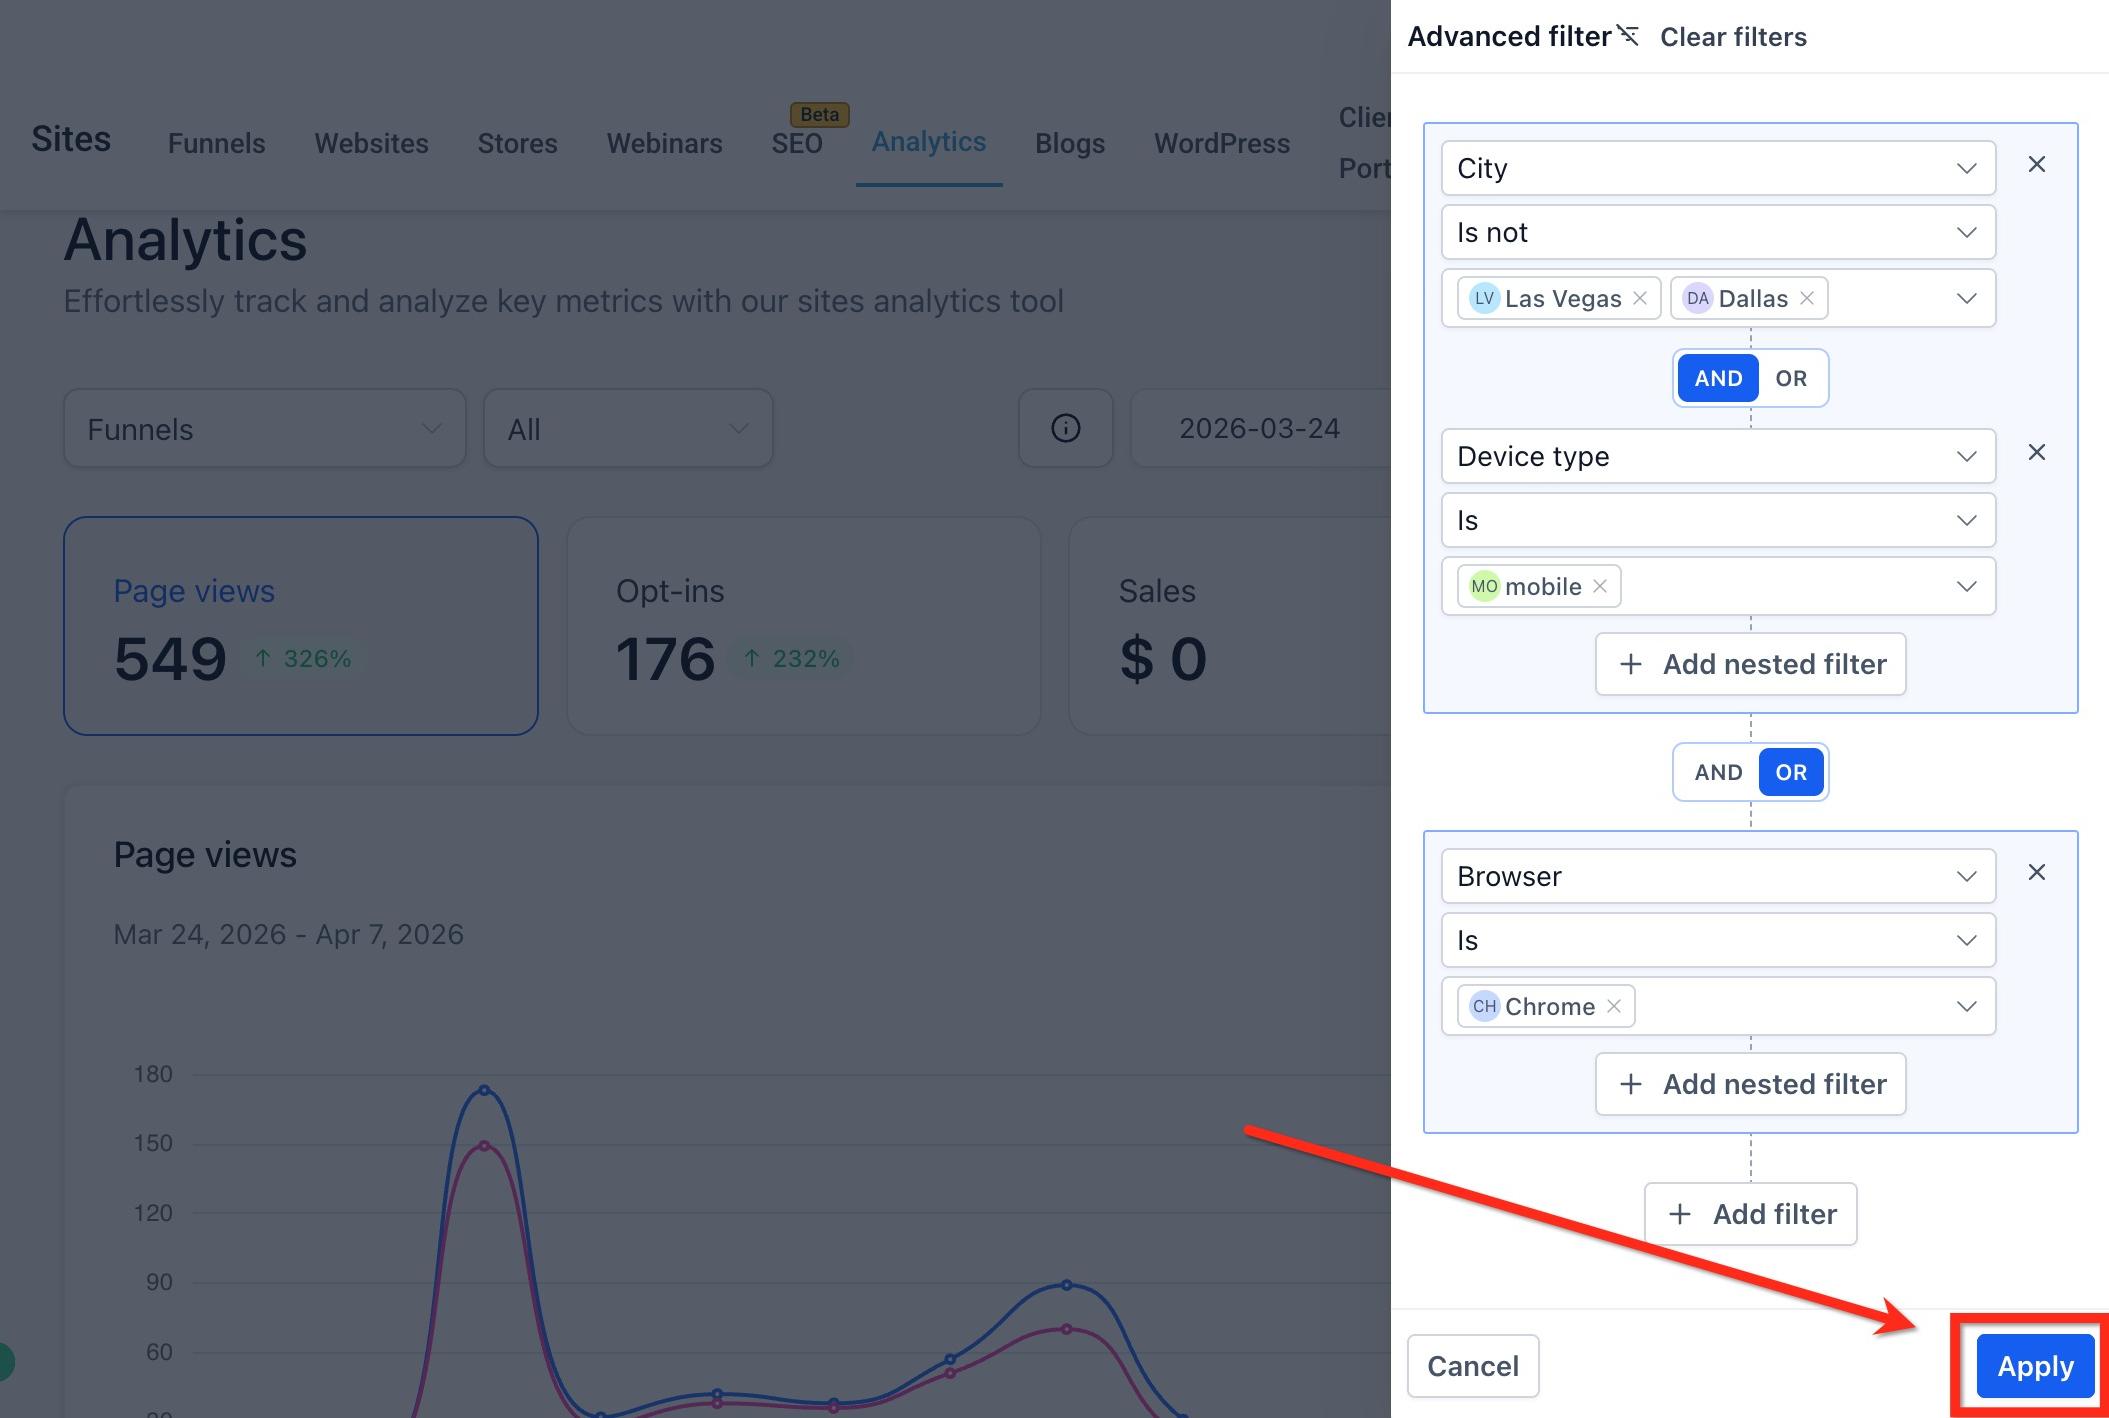
Basic filters, such as the selected asset or timeframe, still shape the dataset underneath your Advanced Filters. Advanced Filters simply narrow those results further.
Advanced Filters do not persist after a page refresh or when you navigate away from Site Analytics. If you return later, you'll need to recreate them.
What's the difference between Page Views and Unique Page Views? All page views count every visit, including repeat visits from the same person. Unique page views count each visitor only once, no matter how many times they returned.
Why do I have separate numbers for Average Time on Site and Average Session Duration? They measure engagement from two different angles. Average Time on Site reflects overall engagement trends across your date range, while Average Session Duration reflects engagement at the level of a single visit. Watching both together gives you a fuller picture of how prospective patients are interacting with your site.
What counts as a bounce? A session where the visitor leaves your site within 30 seconds of landing counts as a bounce. A high bounce rate often points to slow-loading pages or a landing page that doesn't match what brought the visitor there.
Where do I find opt-in rate, sales, and QR code scan data? Those metrics are tracked at the funnel-step level and are documented in the Funnels and Websites analytics guides, not in site-wide Site Analytics.
What's the difference between Add Filter and Add Nested Filter? Add Filter adds another condition at the current level of your filter setup. Add Nested Filter adds conditions inside a grouped filter, so you can control how those conditions interact with each other before combining them with the rest of your logic.
Can I save an Advanced Filter to reuse later? No. Advanced Filters reset once you refresh the page or leave Site Analytics, so you'll need to rebuild them each time you want to apply that same view.
Which asset types support Advanced Filters? Funnels, Websites, and Webinars all support Advanced Filters. You select the asset type first, then open the filter builder from that asset's analytics dashboard.
Can I combine multiple filter dimensions, like city and device type, in one view? Yes. Add a filter for each dimension you want, then choose AND or OR to control how they combine. Nested filters let you group related conditions together for more precise segmentation.
