Geographic Analytics is an interactive heat map that shows exactly where your website and funnel visitors are coming from, down to the state and city level. It lives inside your account's Sites area, on the Analytics tab, so you can see location data alongside your other traffic metrics without leaving the page.
The heat map visualizes traffic from country down to state down to city. As you drill down, you can spot high-interest pockets within a region, compare performance across local markets, and adjust your marketing in real time. The map and its ranked list update the moment you change the dropdown, with no manual reload needed, which makes it a great tool to pull up live during a team meeting or a screen share.
For a med spa, this means you can see whether your consult requests and page views are concentrated in the neighborhoods and cities near your practice, or whether interest is spreading to nearby towns worth targeting with local ads.
Hyper-local targeting: Identify your top-performing cities so you can run geo-focused ads and promotions around them.
Smarter budget allocation: Shift ad spend toward the states and cities generating the most engaged visits.
Campaign comparison: Measure the regional lift after you launch a location-based offer or promotion.
Faster decisions: The live refresh keeps the map and ranked list current without page reloads.
Unified view: Visitor counts, the map, and the ranked list all live in one place for easy reporting.
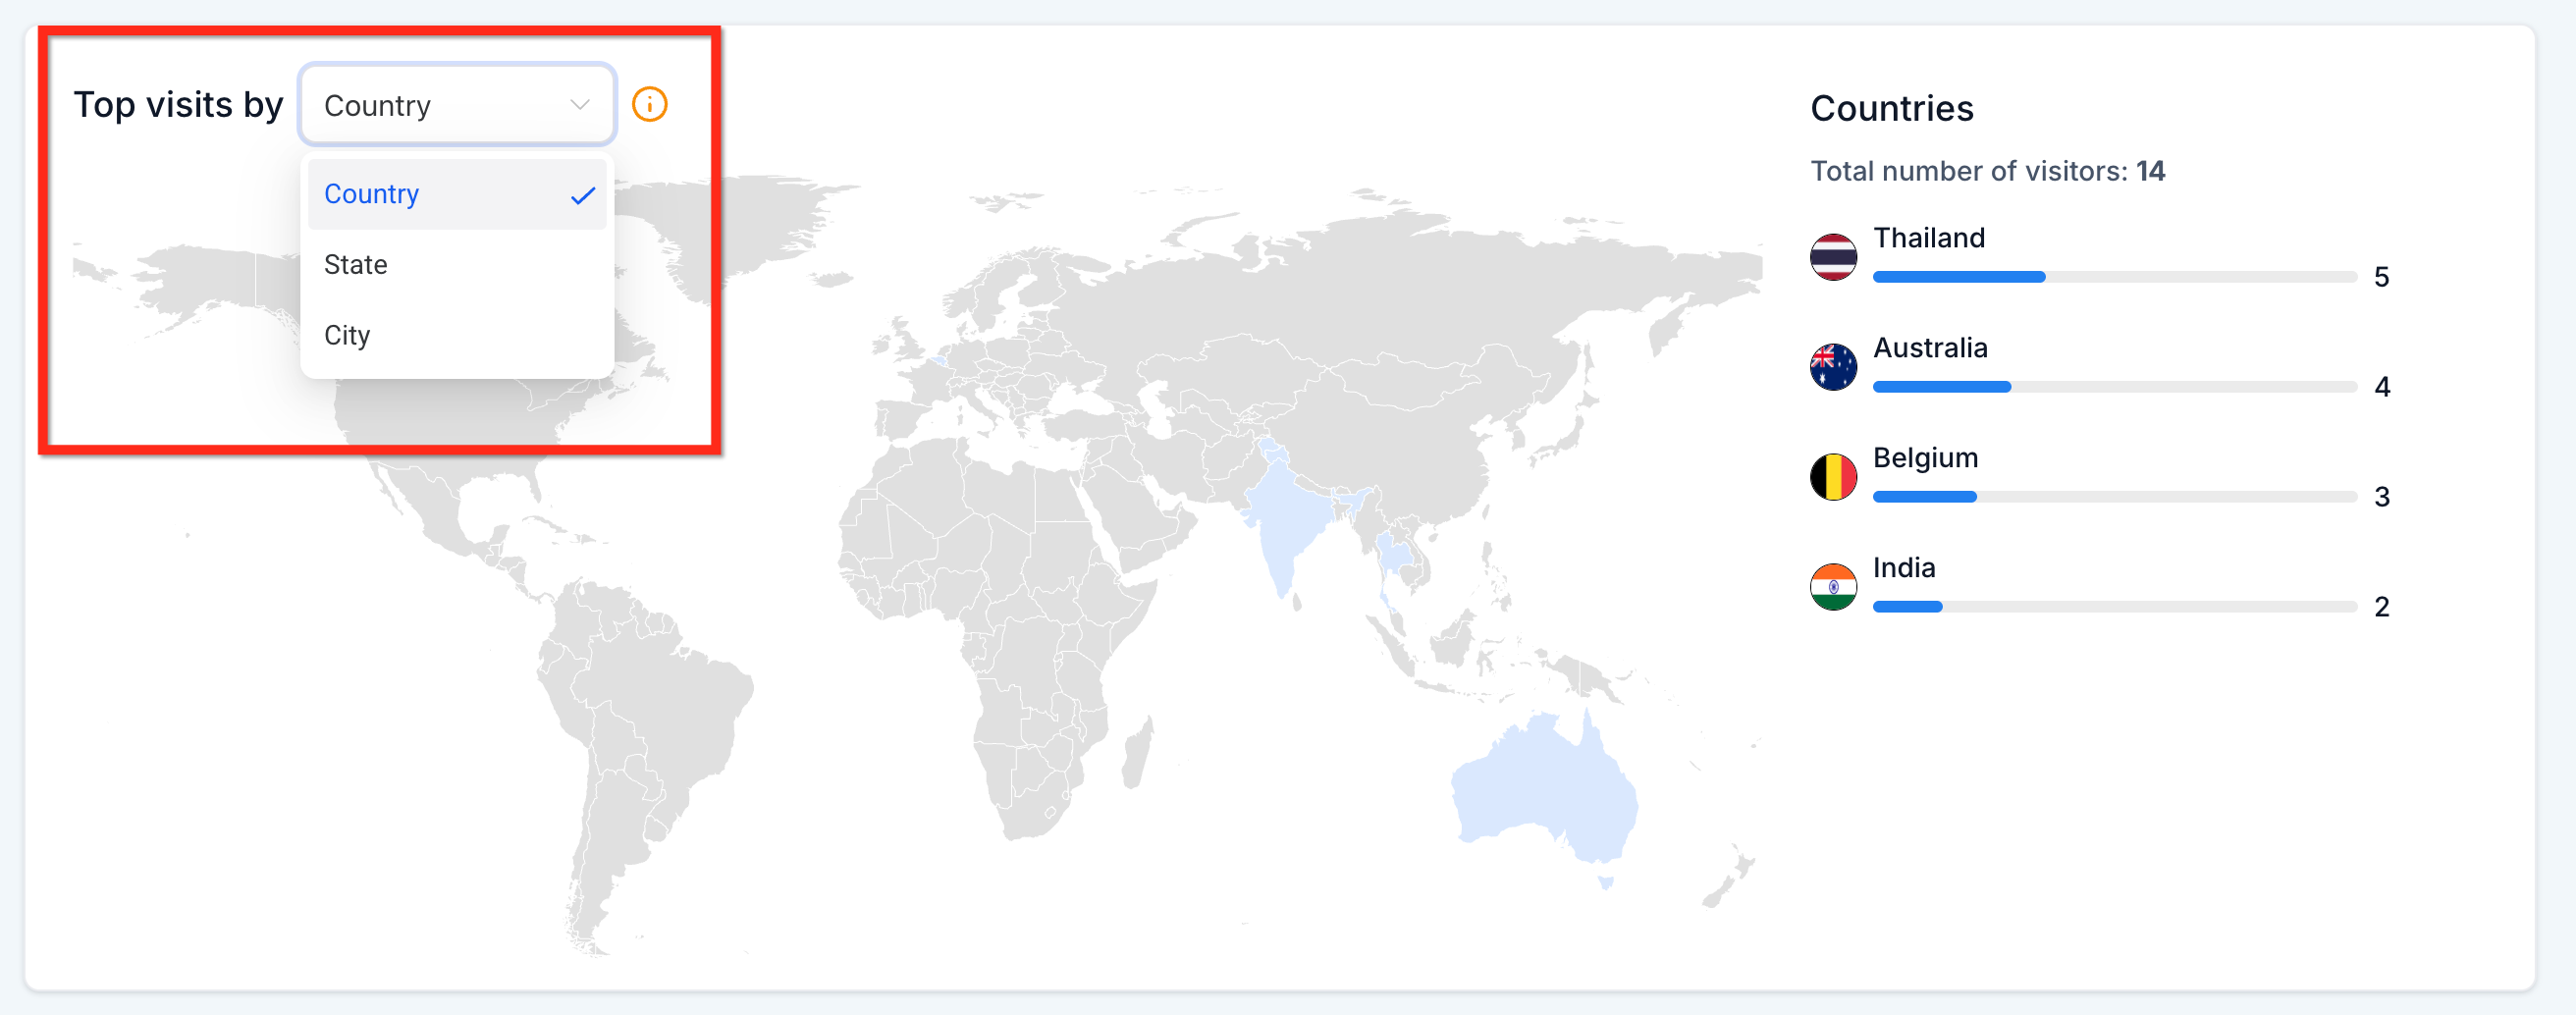
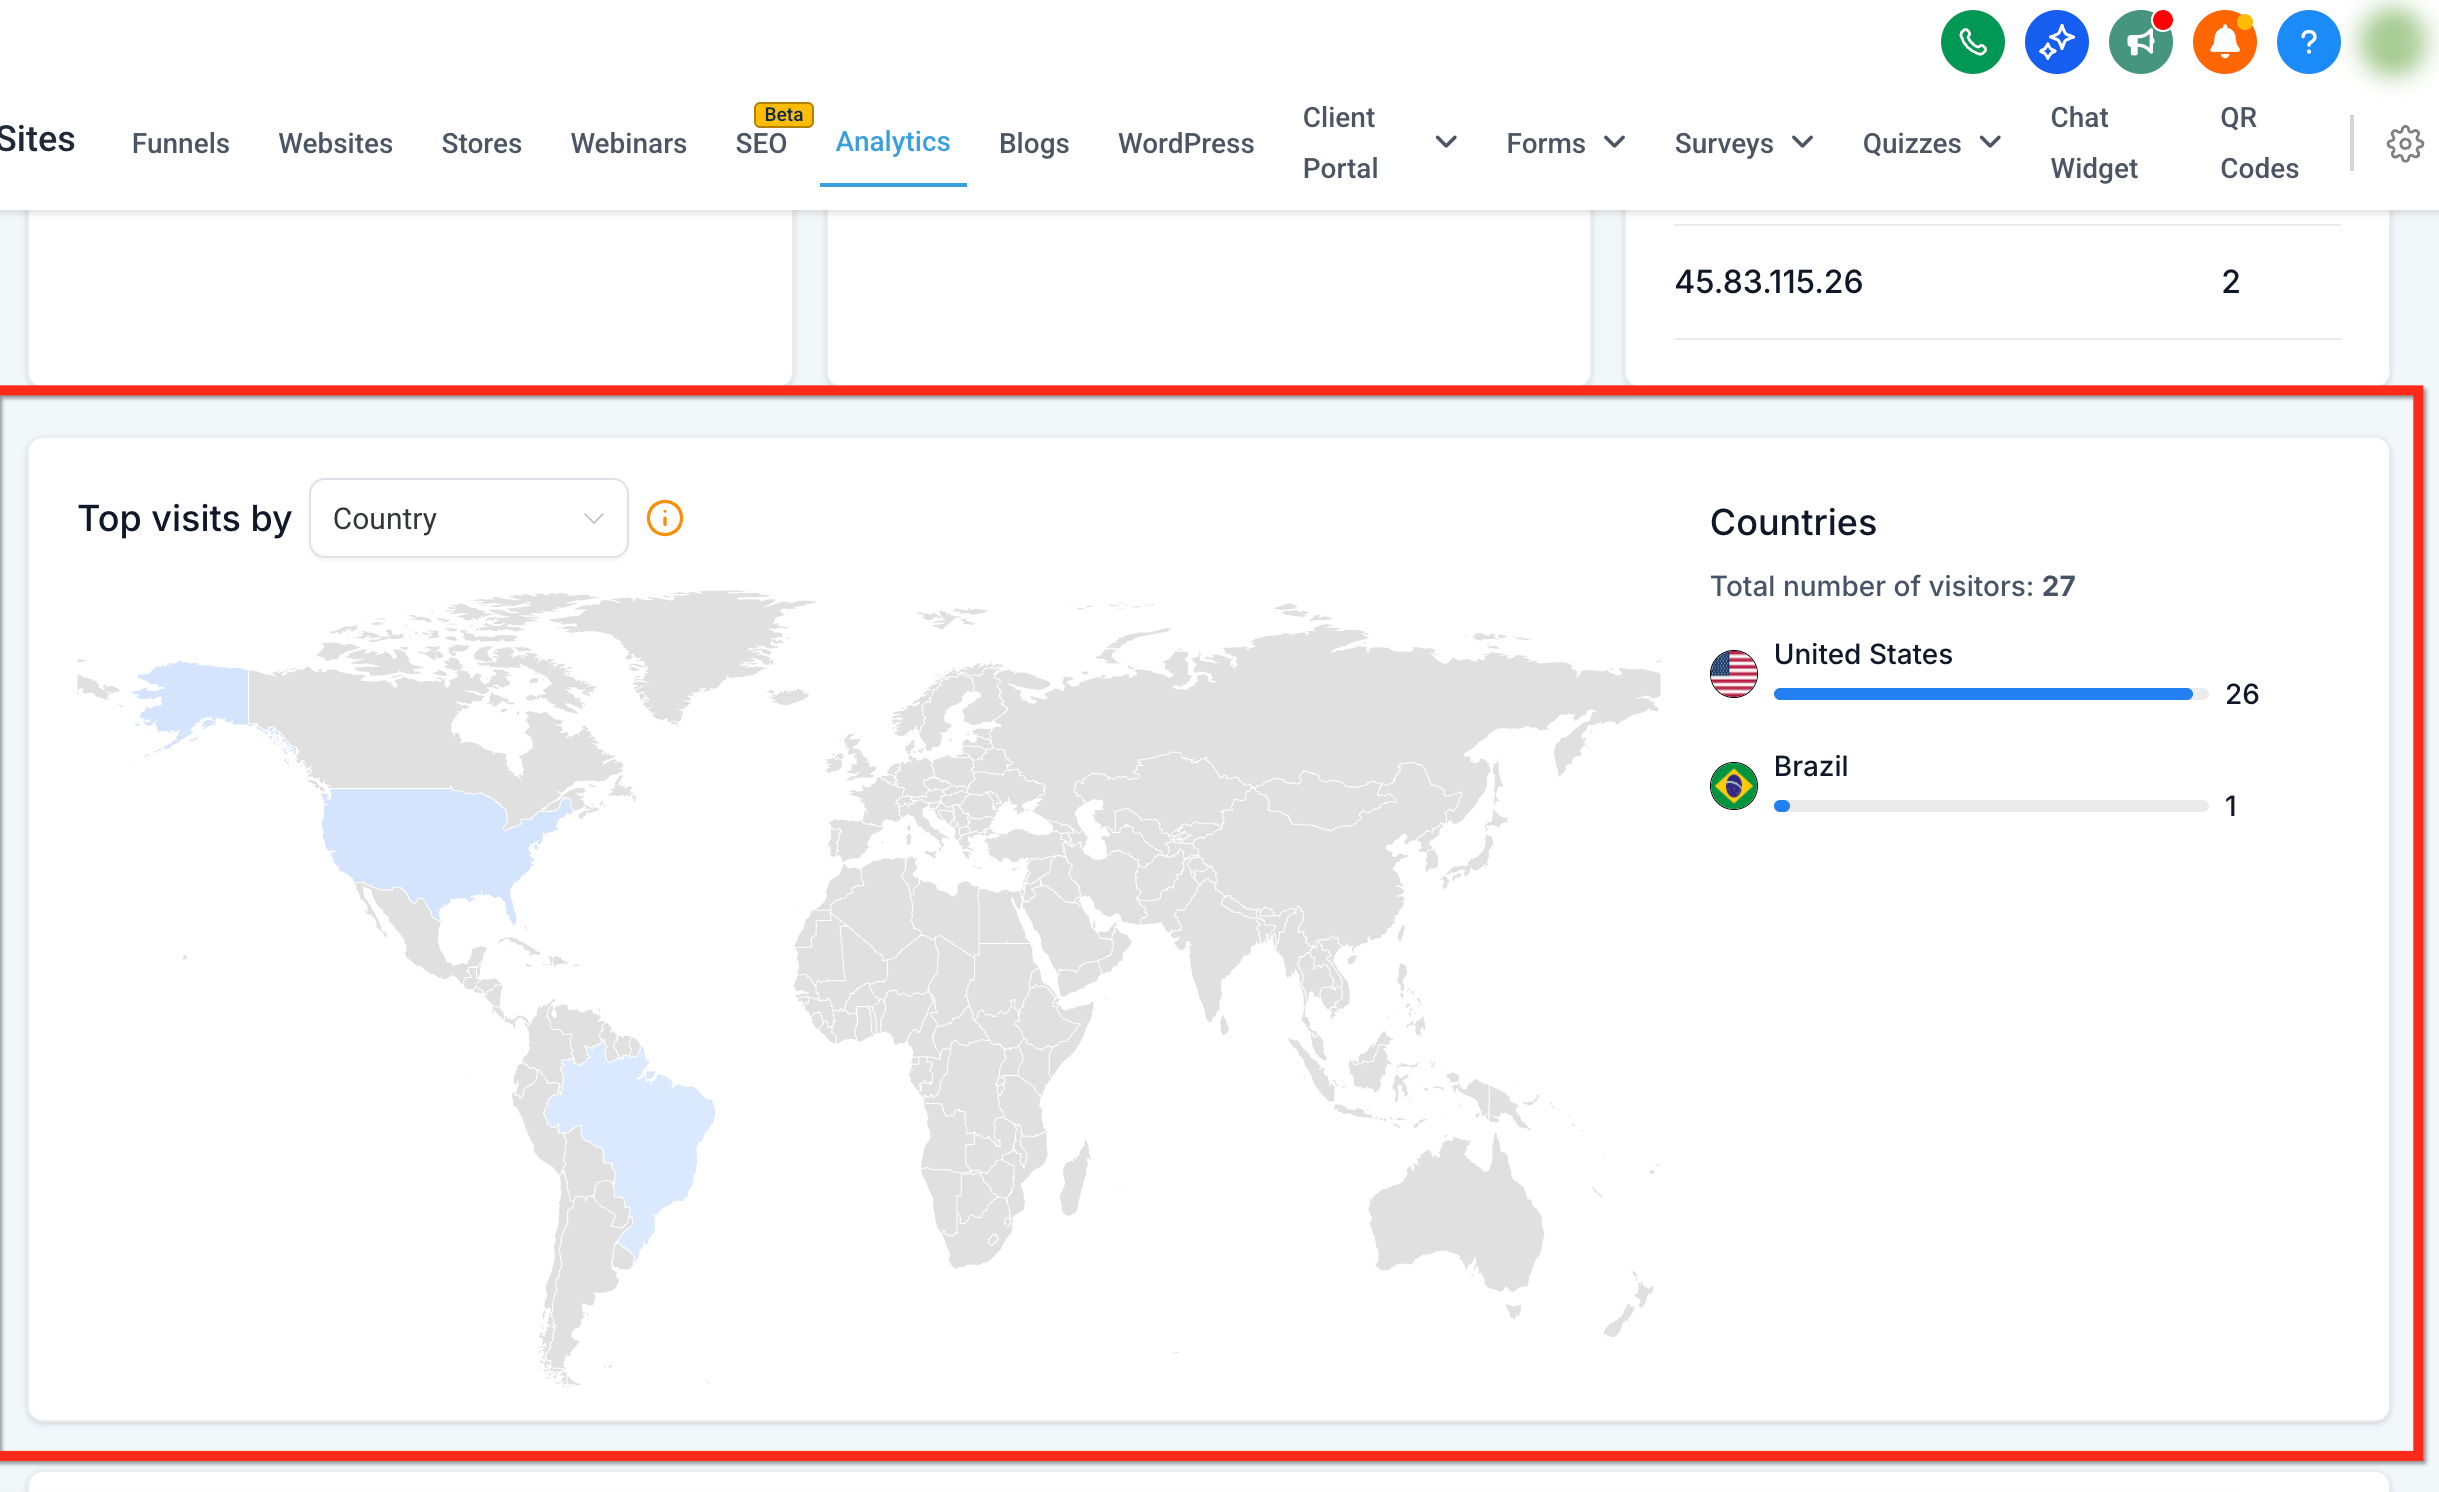
A single dropdown lets you switch between Country, State, and City. Selecting a new level instantly updates both the heat map and the ranked list beside it, so you can move through drill-down levels without extra clicks.
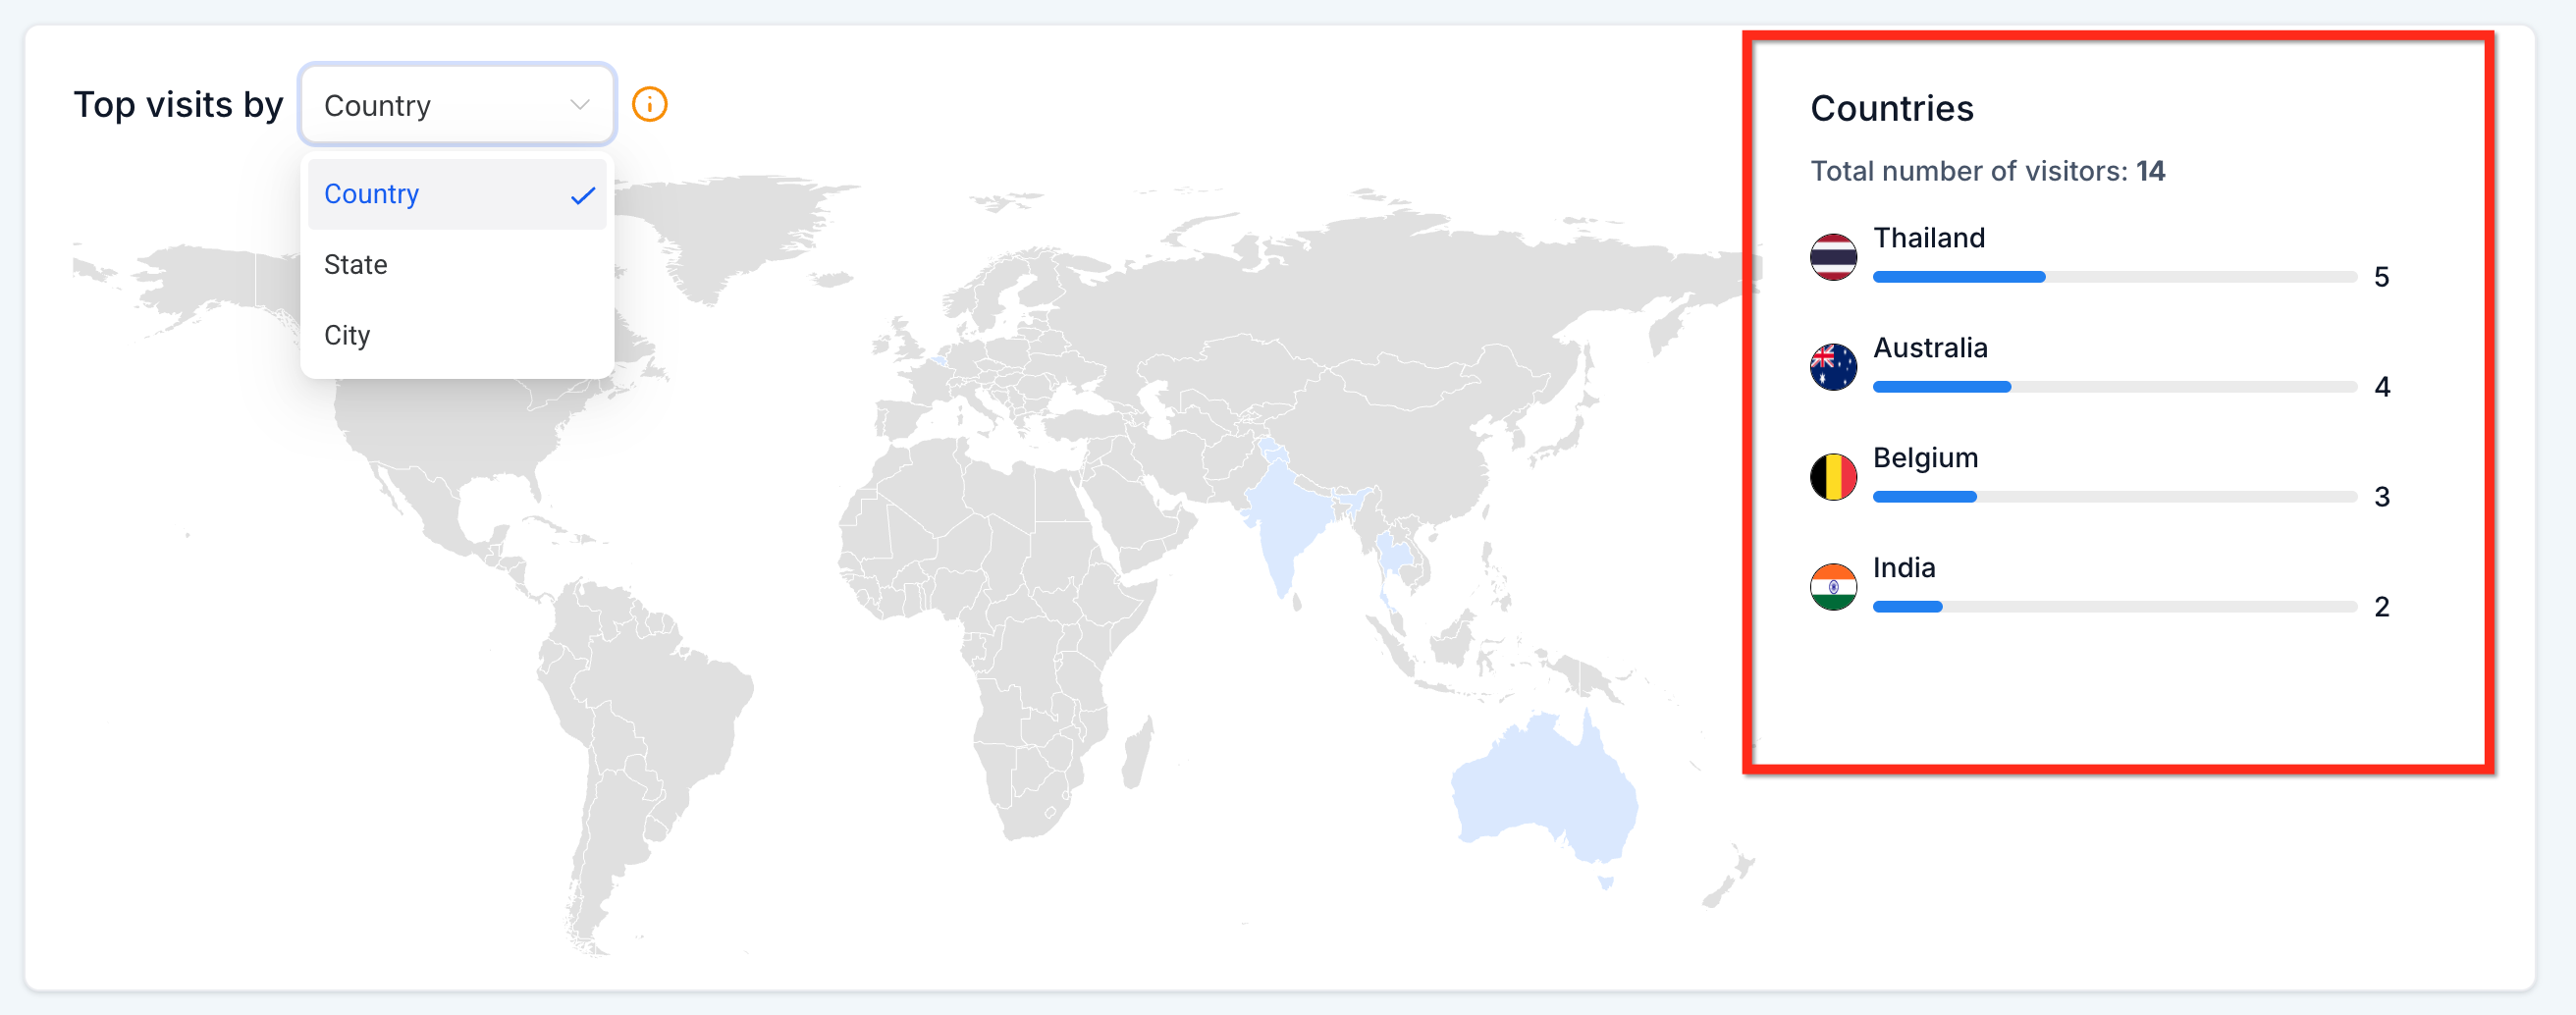
Each drill-down level includes a side-panel list that automatically ranks the top regions by visit count. The list updates in real time as you change levels, so you can spot your highest-traffic areas at a glance.
A running total of all visits for the selected drill-down level stays visible above the map. As you move from state to city, the total refreshes automatically so you always know the full audience size you are looking at.
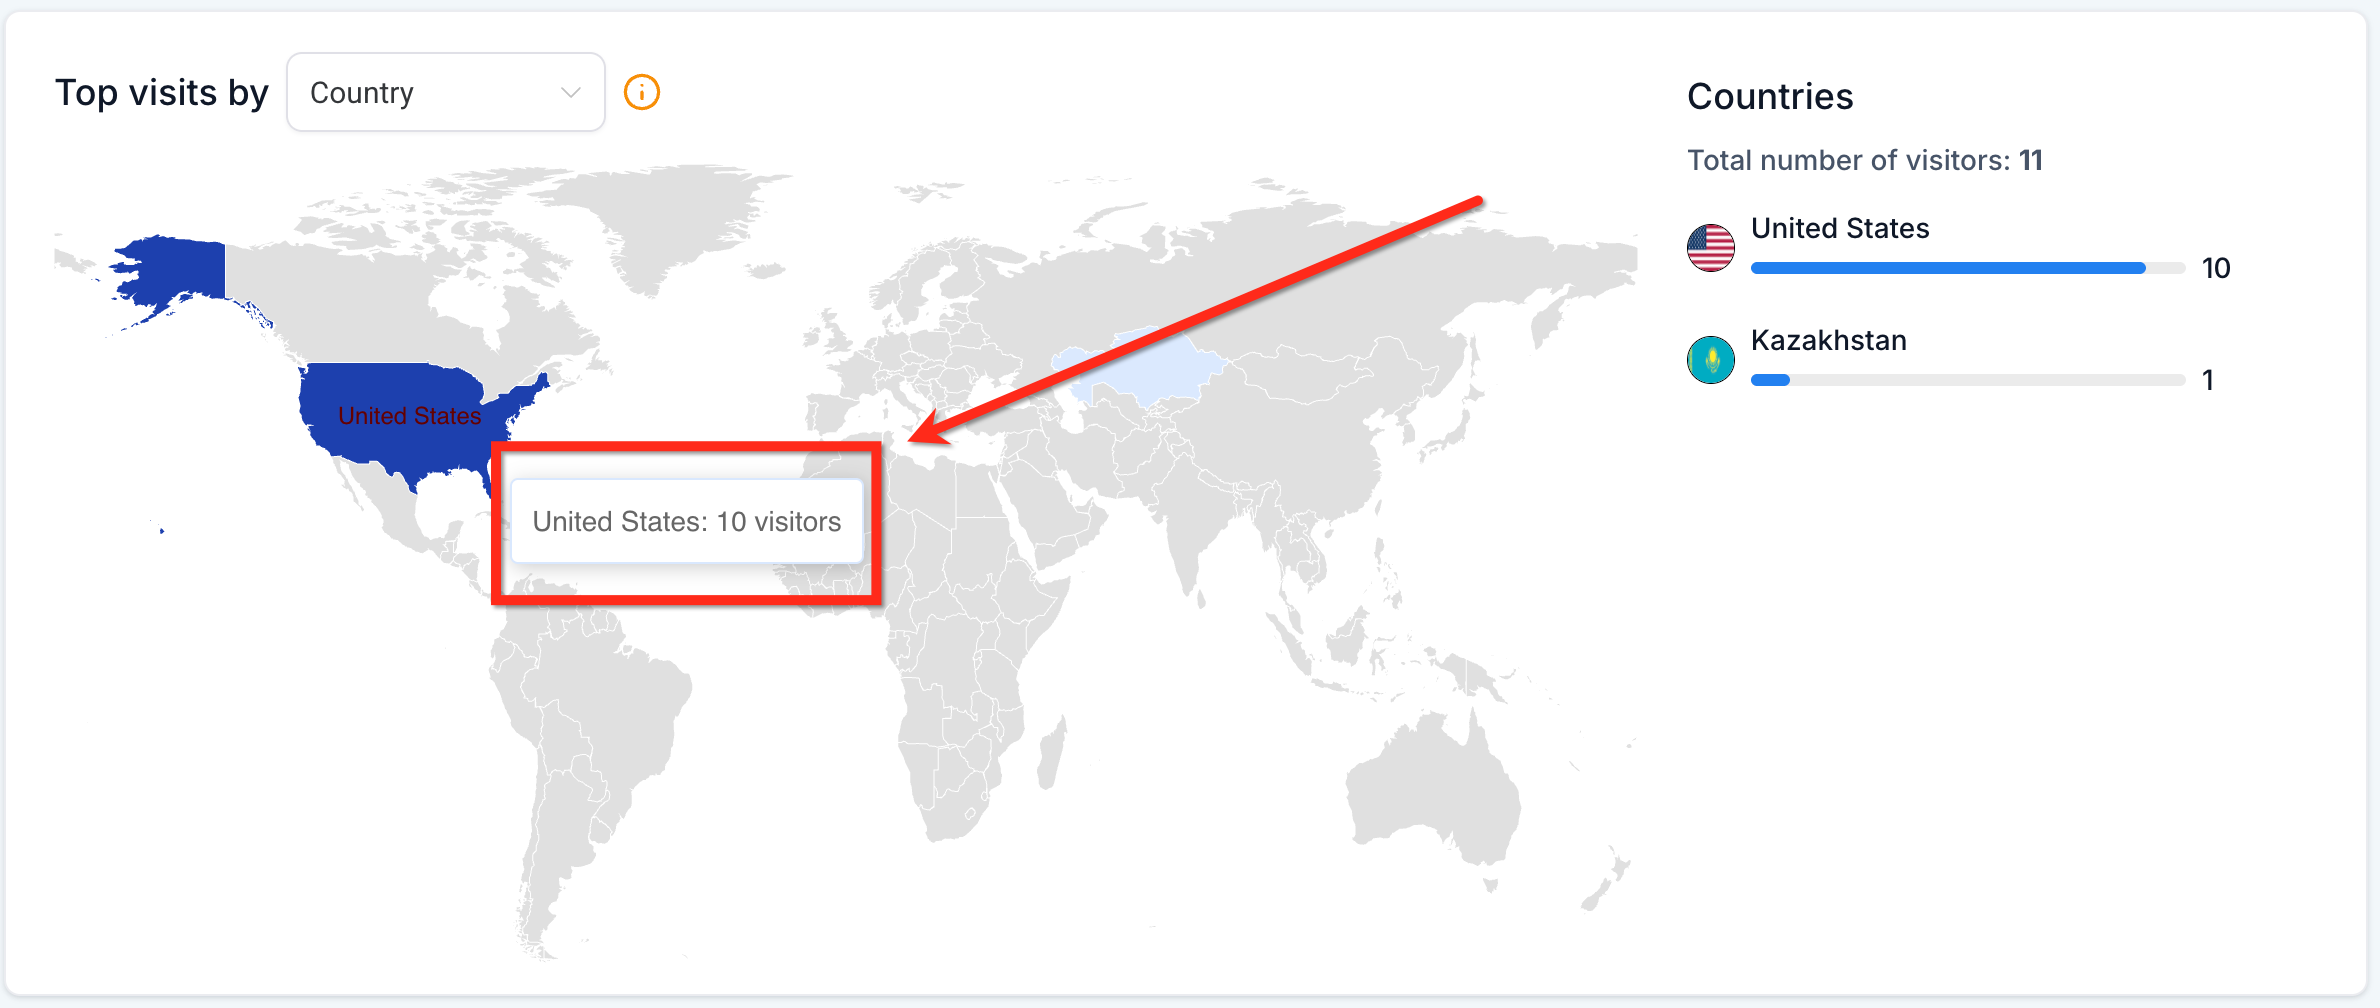
Colors on the map deepen as traffic increases, giving you a quick visual cue of hotspots without digging through spreadsheets. Move your cursor across the map to reveal the exact visitor count for any state or city. Tooltips appear immediately, so you do not need to scroll the ranked list just to check a figure.
Geographic Analytics works automatically for any account, with no extra setup or tracking scripts required.
From your account's left-side navigation, go to Sites.
Select the Analytics tab from the top navigation.
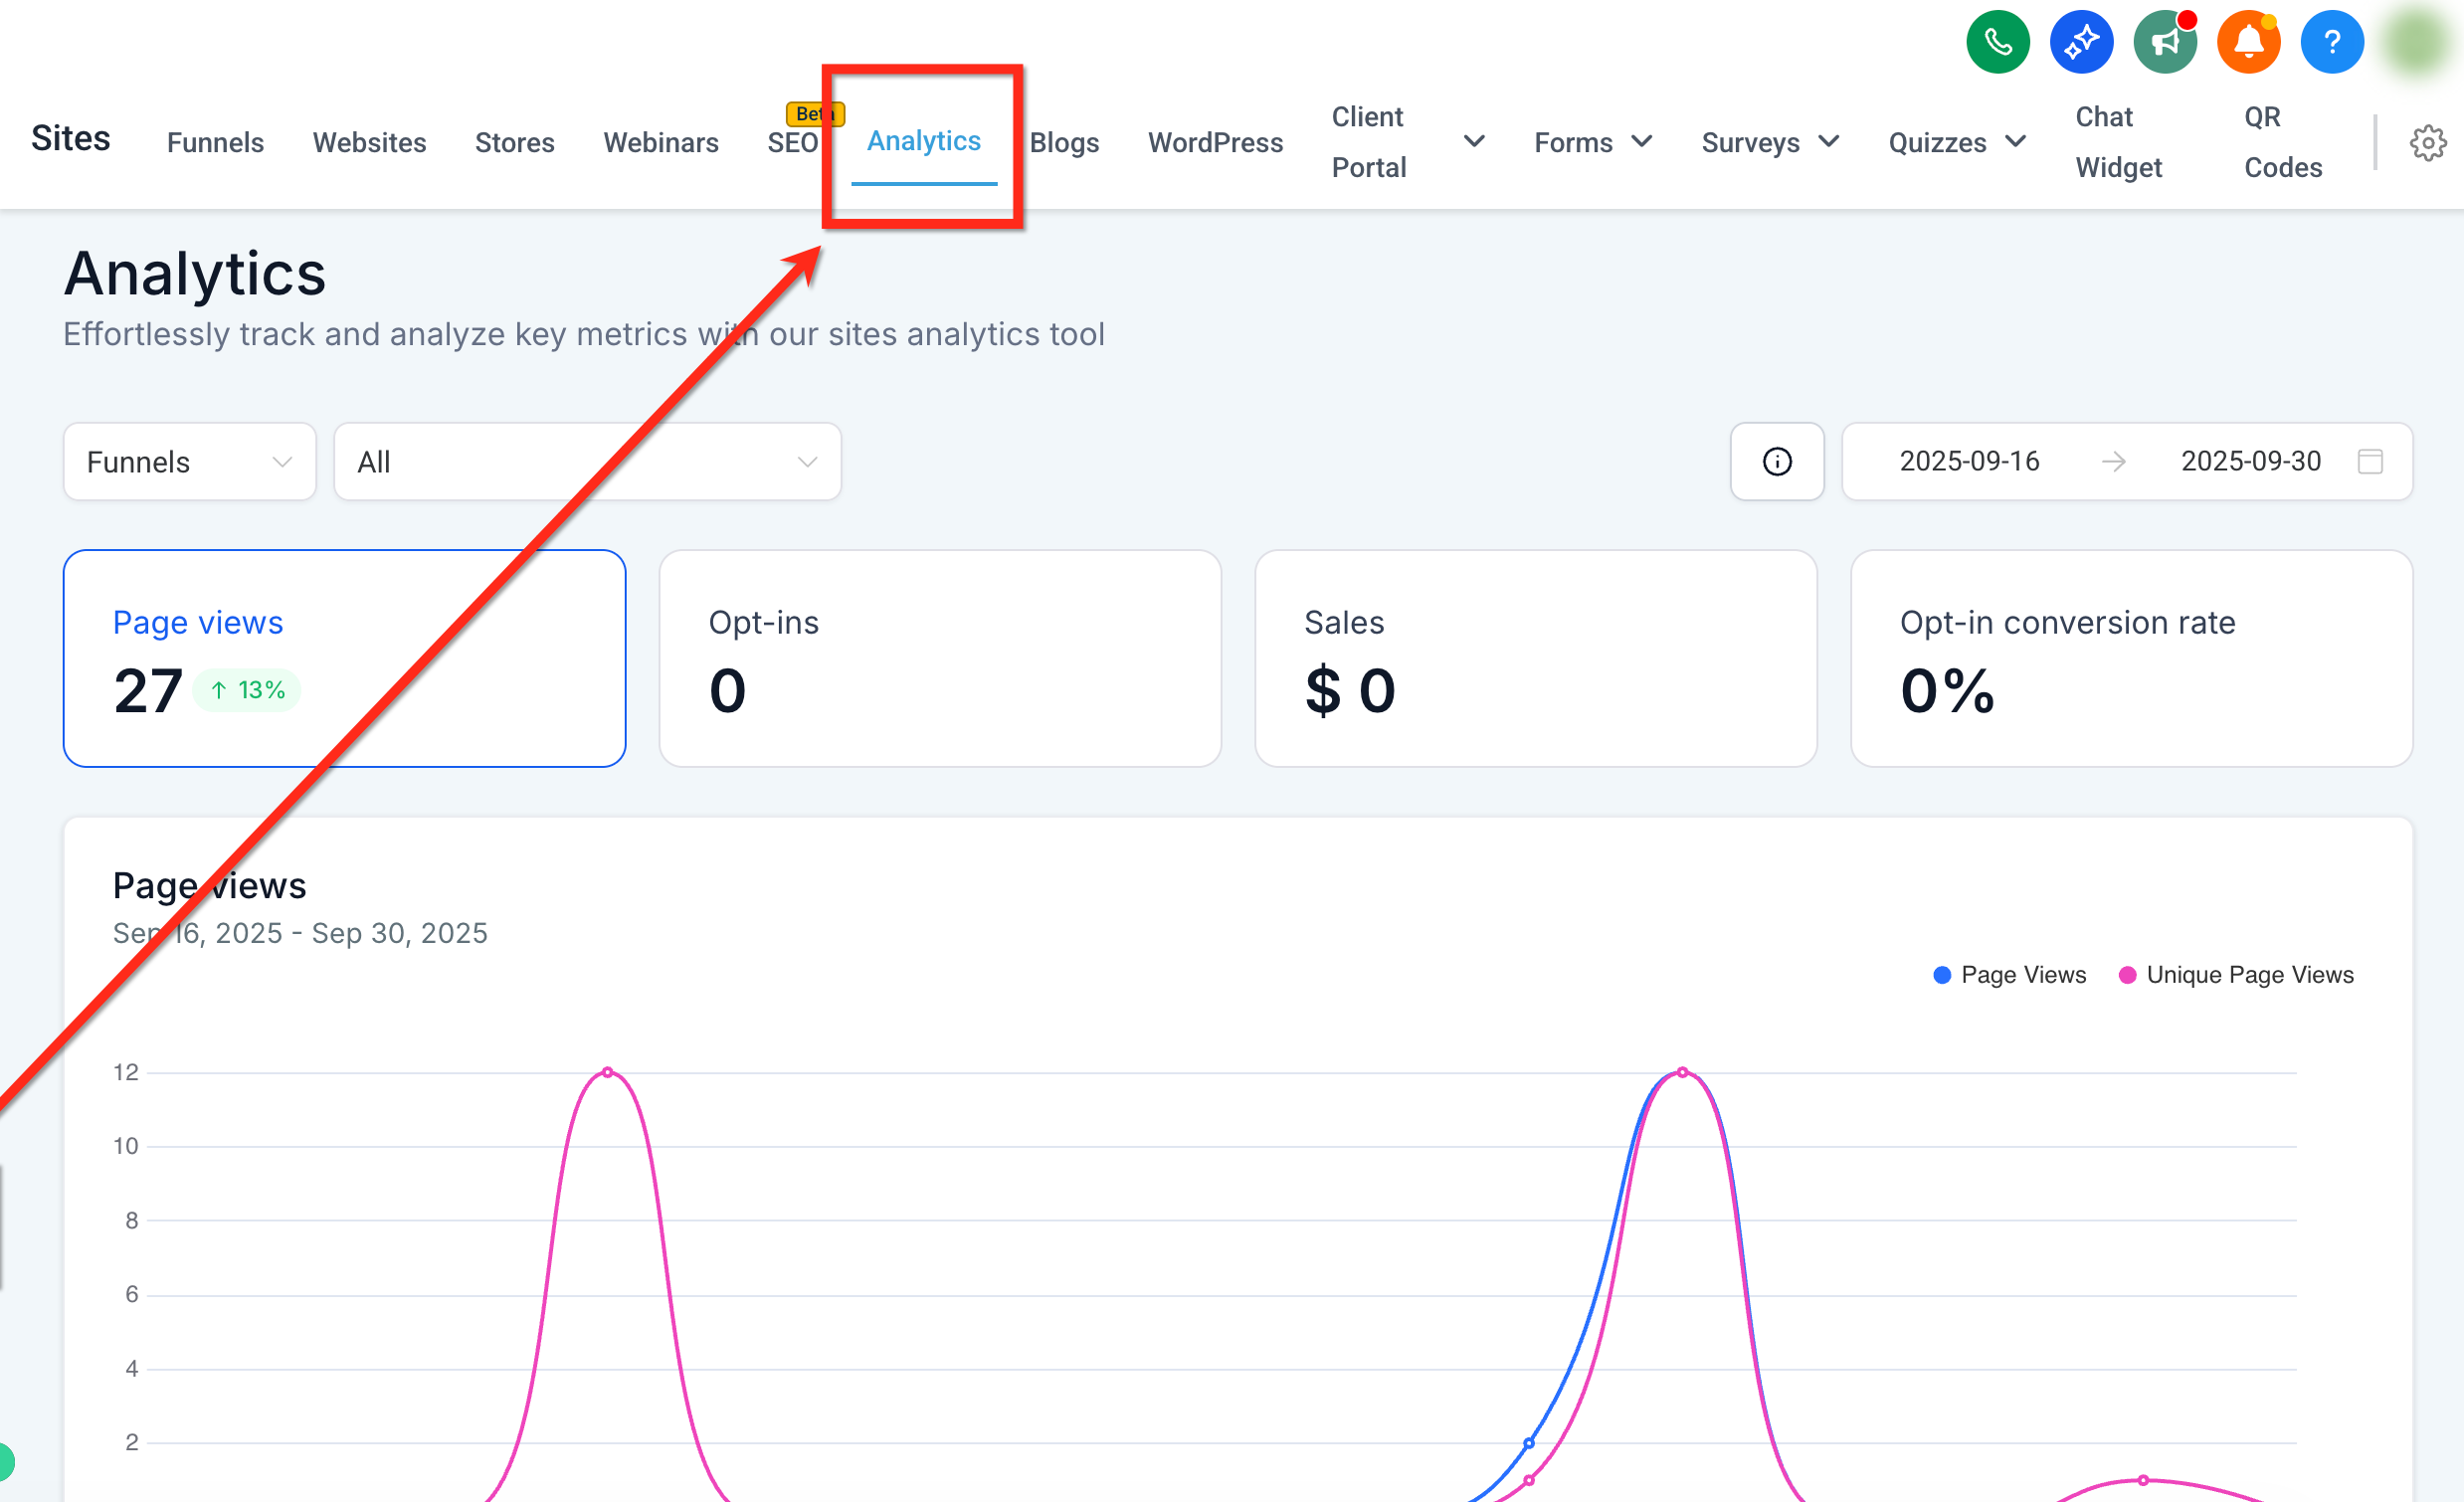
Scroll down to the Geographic Analytics card, located beneath Page Views. From here you can:
Use the drill-down dropdown (Country / State / City) above the map to choose your level.
Hover over any shaded region to see its visitor count.
Review the ranked list on the right to compare top locations.
Apply what you find, such as shifting ad spend toward a high-performing city or building a localized landing page, to maximize regional results.
Geographic Analytics follows whatever context and date range you have set on the Analytics page, whether you are viewing Funnels, Websites, or Both. This keeps the map, ranked list, and total visitor count aligned with the same scope you are already reviewing elsewhere on the page.
Geographic Analytics covers website and funnel traffic. It is not the same as ad-platform location reporting, which you will find inside Ads Manager's Ad Reporting, or reputation and review data by location, which lives in Review Management. For a broader picture of where your leads and revenue originate across channels, the flagship attribution guides in Essential Guides are the best starting point.
Do I need to add any extra tracking scripts to see state and city data? No. If Sites Analytics is already capturing page views for your account, Geographic Analytics populates automatically with no additional setup.
Is the heat map data available in real time? Yes. Visitor counts update as new sessions are recorded, so the map and ranked list refresh on their own without a full page reload.
Does Geographic Analytics include both Funnels and Websites? The view follows whatever Analytics context you have selected, Funnels, Websites, or Both, along with your chosen date range, so results always reflect the scope you set on the Analytics page.
What is the difference between the map and the ranked list? The map gives you a visual, color-coded view of traffic intensity by region, while the ranked list shows the same data as a sorted, numeric breakdown. They update together, so use whichever view is faster for the task at hand.
Can I see city-level data without going through state first? Yes. The Country / State / City dropdown lets you jump directly to any level. You do not need to drill down sequentially.
Will Geographic Analytics show me exact patient addresses? No. It reports aggregated visitor counts by state and city based on general location signals, not individual patient identities or addresses.
Why does my total visitor count change when I switch levels? The running total reflects the drill-down level you are viewing. Moving from State to City can adjust the total slightly as the data recalculates for the more granular view.
Can I use Geographic Analytics to decide where to run local ads? Yes. Many practices use the top-ranked cities and states here to prioritize geo-targeted ad campaigns and local promotions, then track results in Ads Manager's Ad Reporting.
