The Statistics tab in Ad Manager lets you monitor your published campaigns and make data-driven decisions based on real performance. For a med spa, this is where you confirm whether a Botox promotion is bringing in consultation leads at a reasonable cost, and where you decide what to adjust to get better results.
Reviewing statistics helps you optimize campaigns and get the most out of your ad spend:
Performance analysis: Understand how your ads are doing.
ROI measurement: See whether your ads are making money.
Audience insights: Know who is seeing your ads.
Campaign optimization: Make your ads work better.
Budget allocation: Spend wisely.
Goal tracking: Check whether your ads are meeting their objectives.
Competitive analysis: See how your ads stack up.
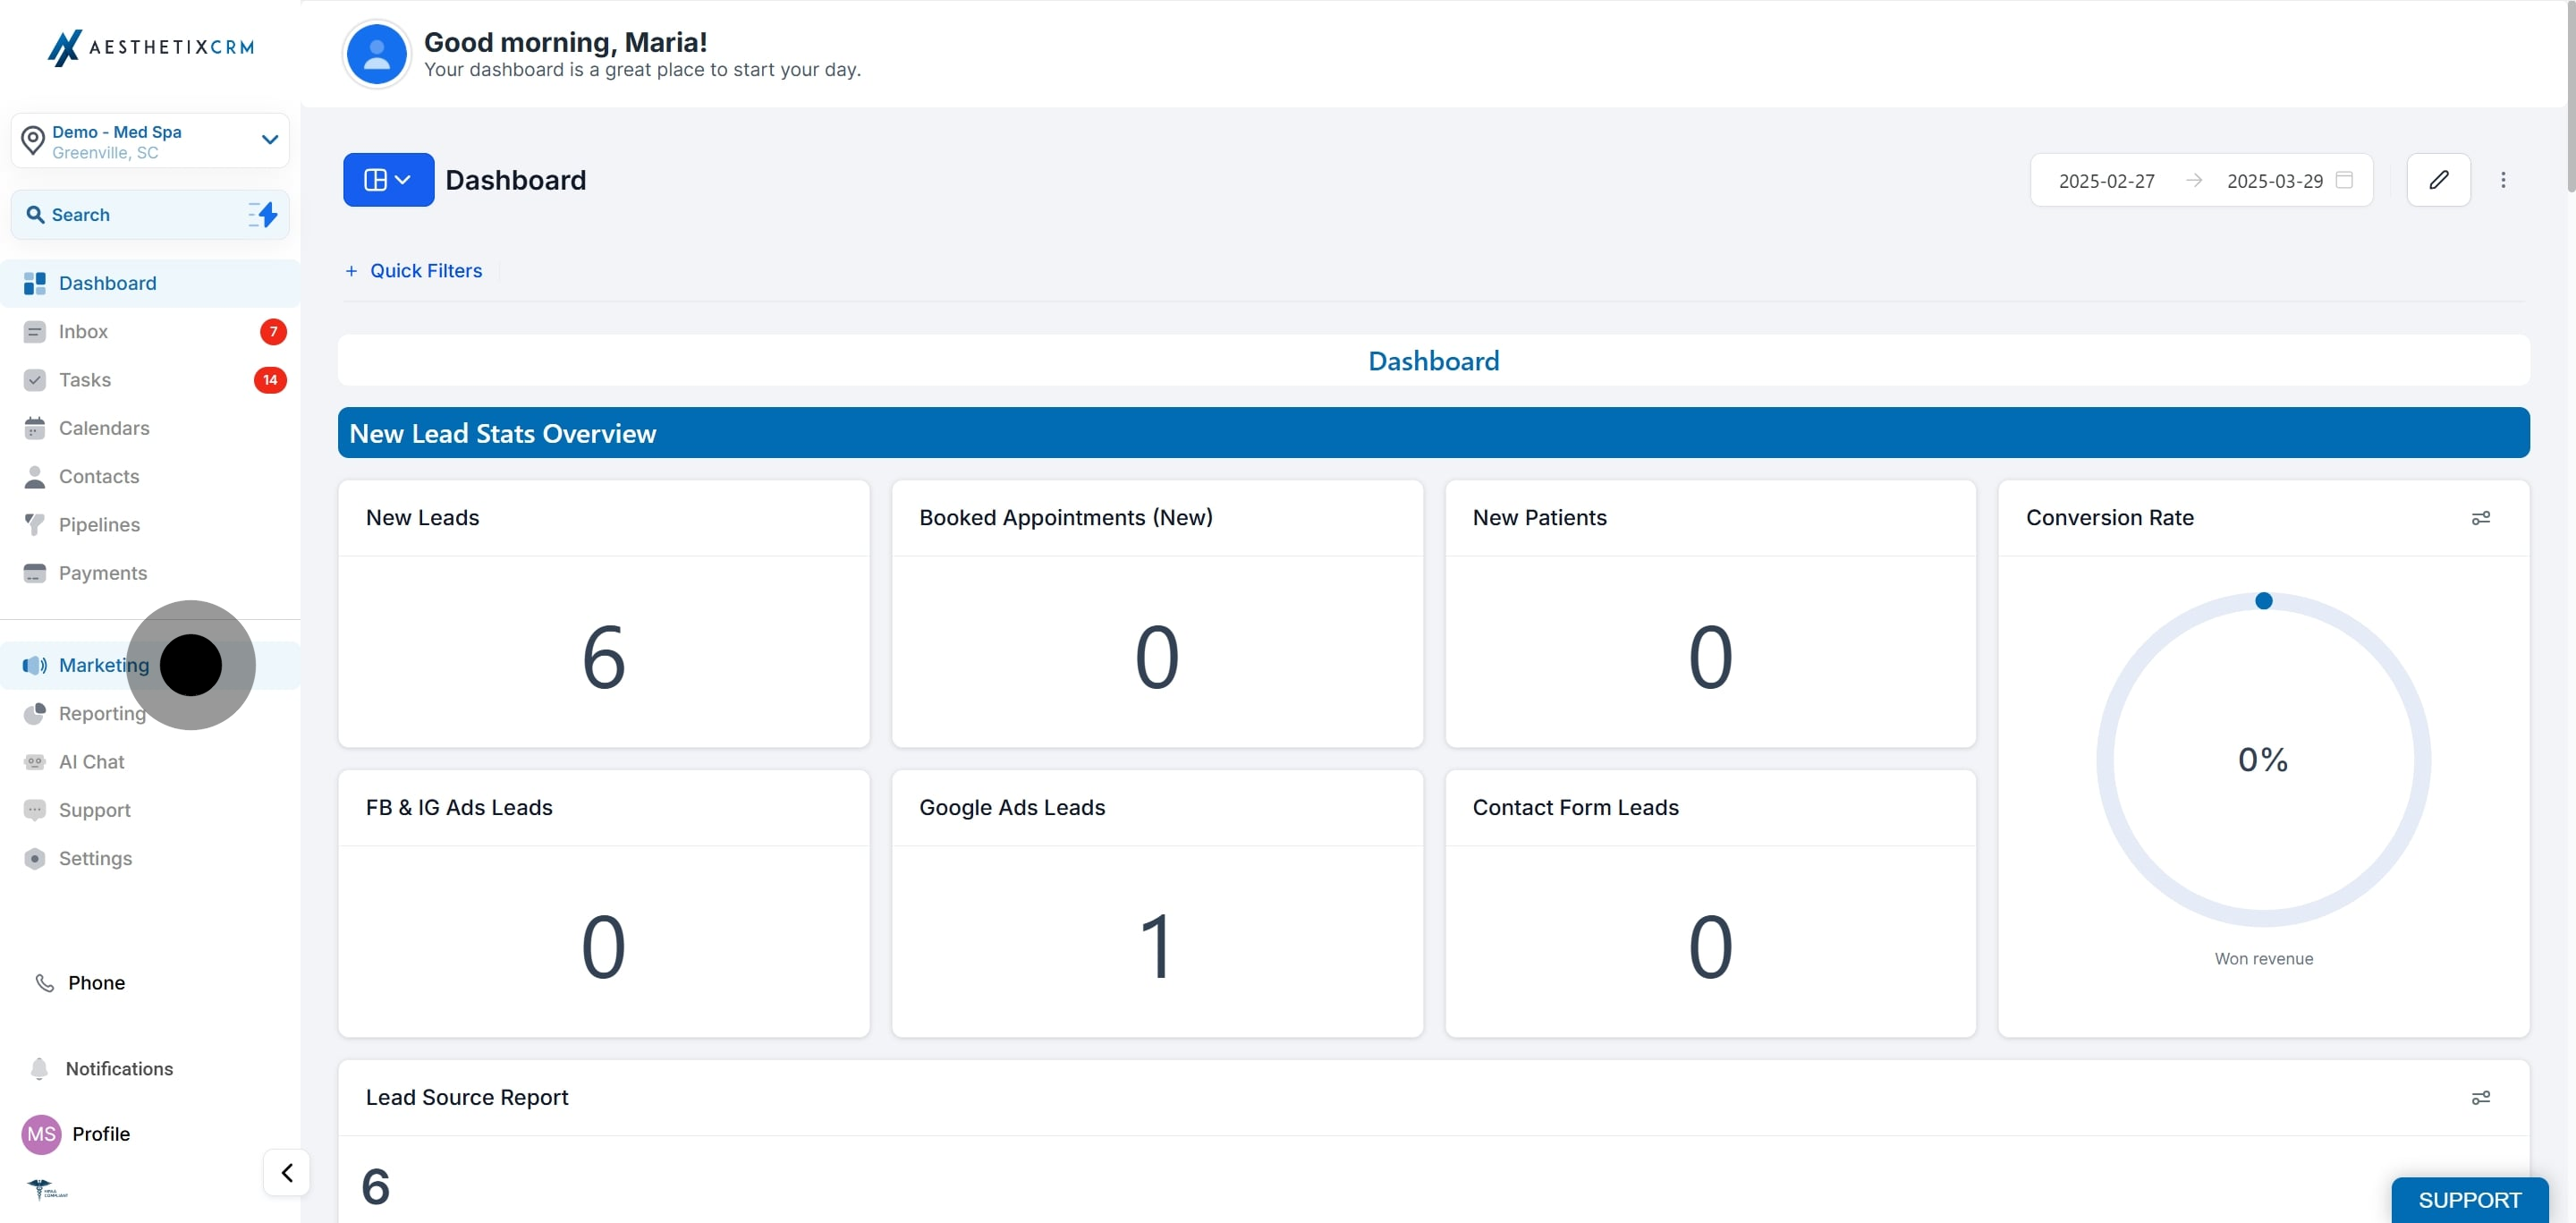
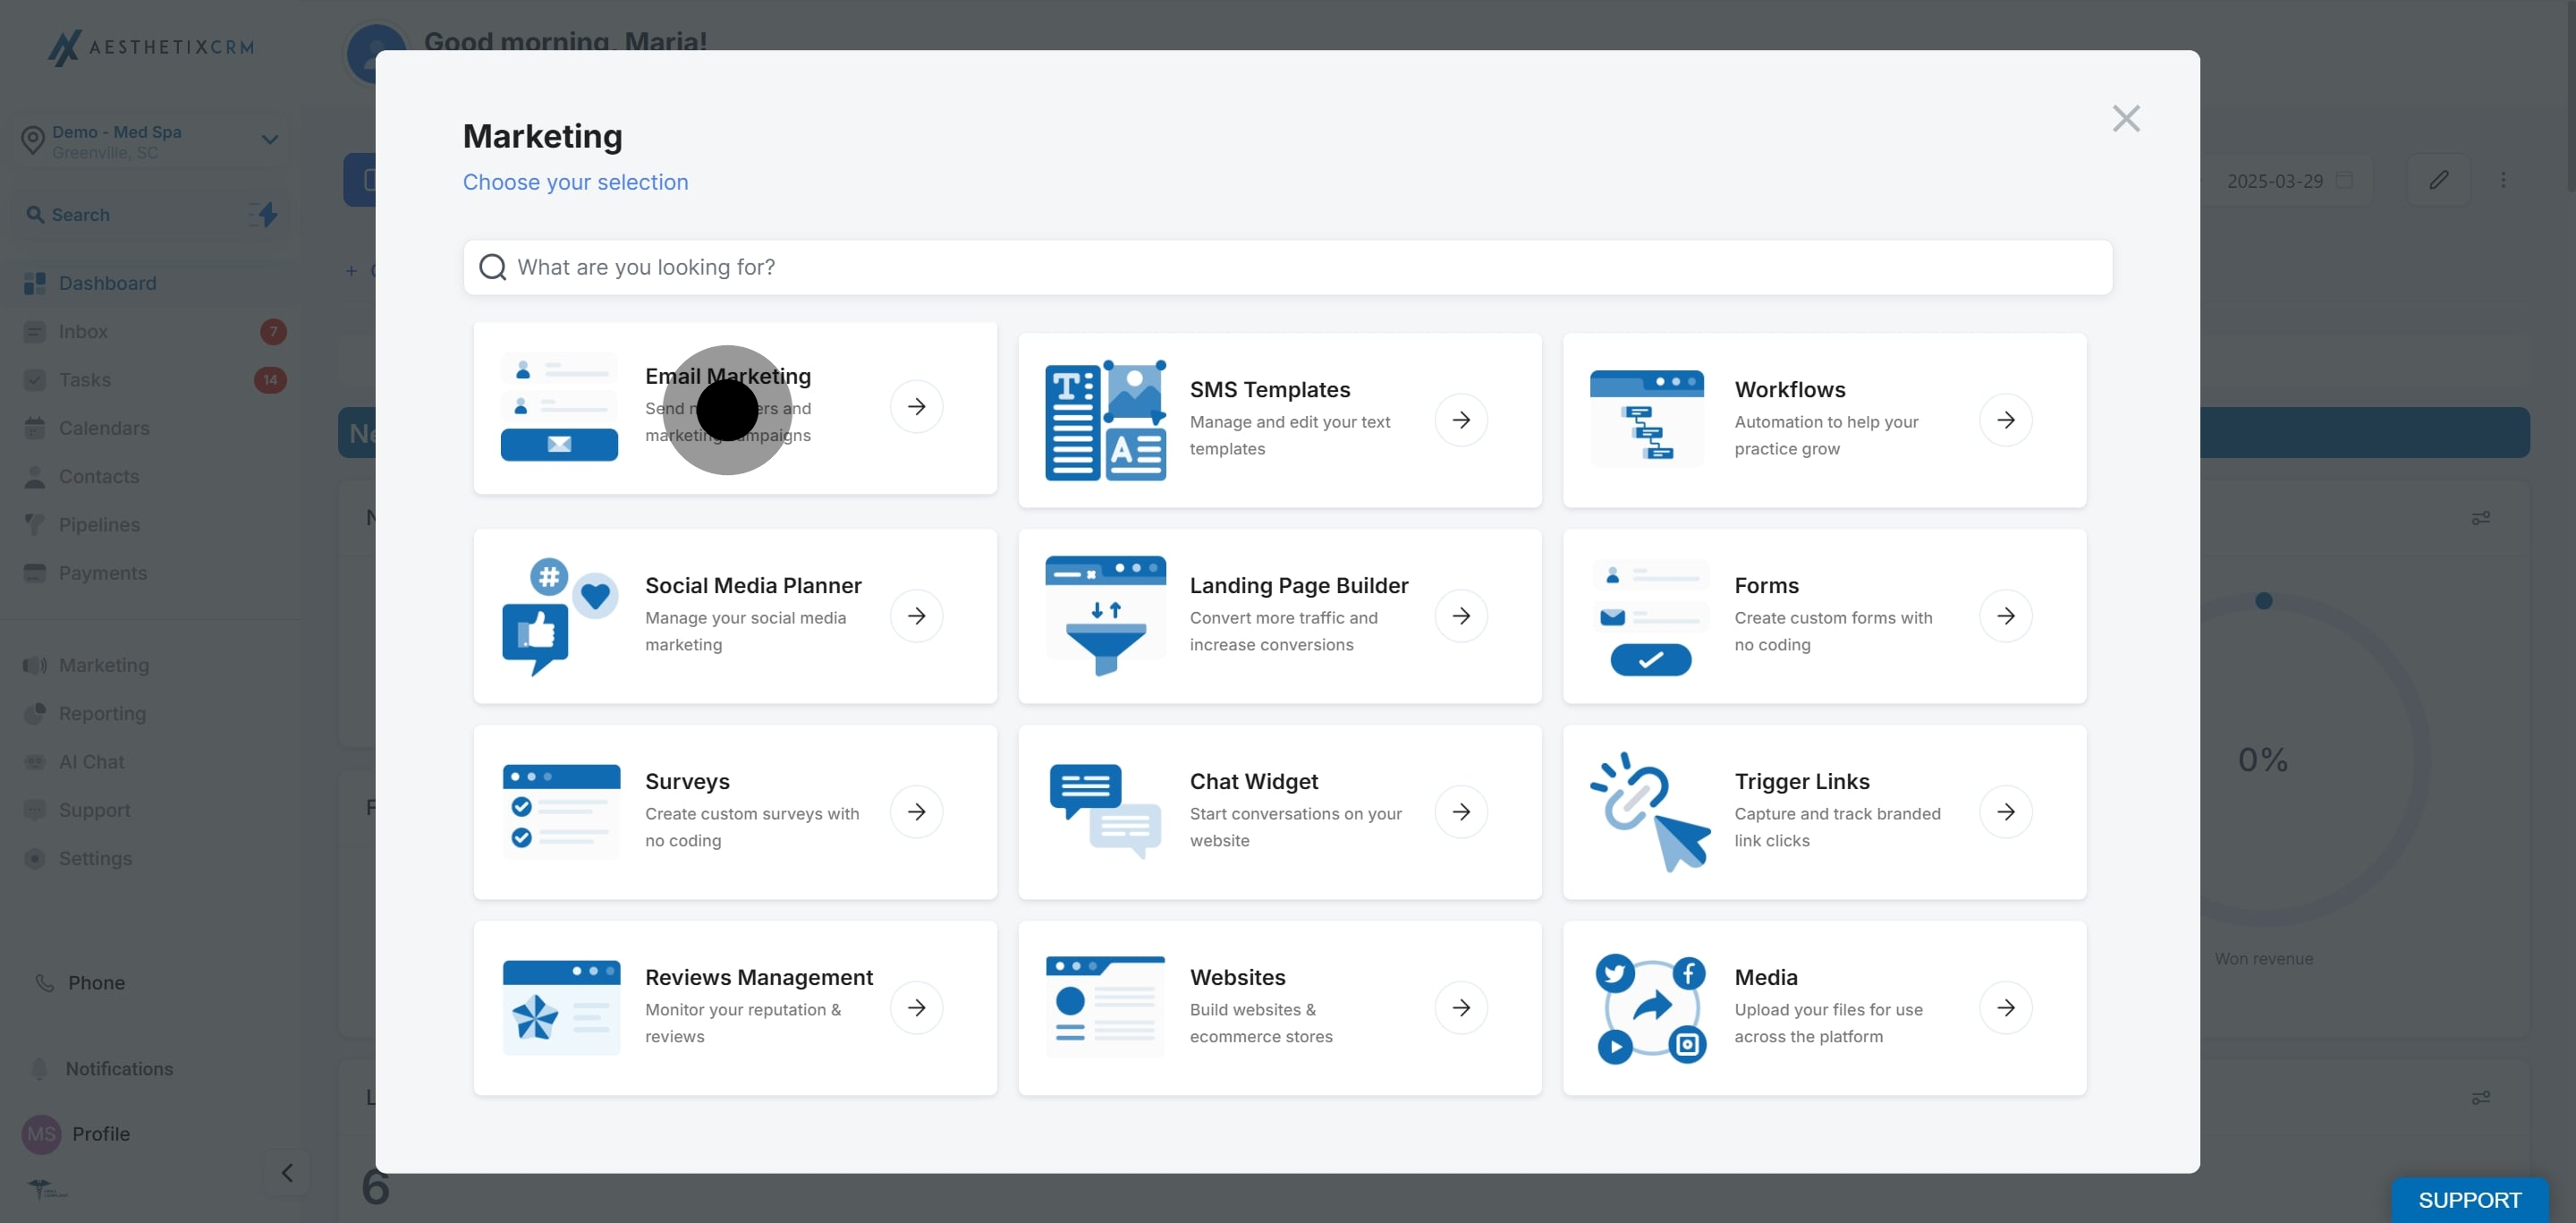
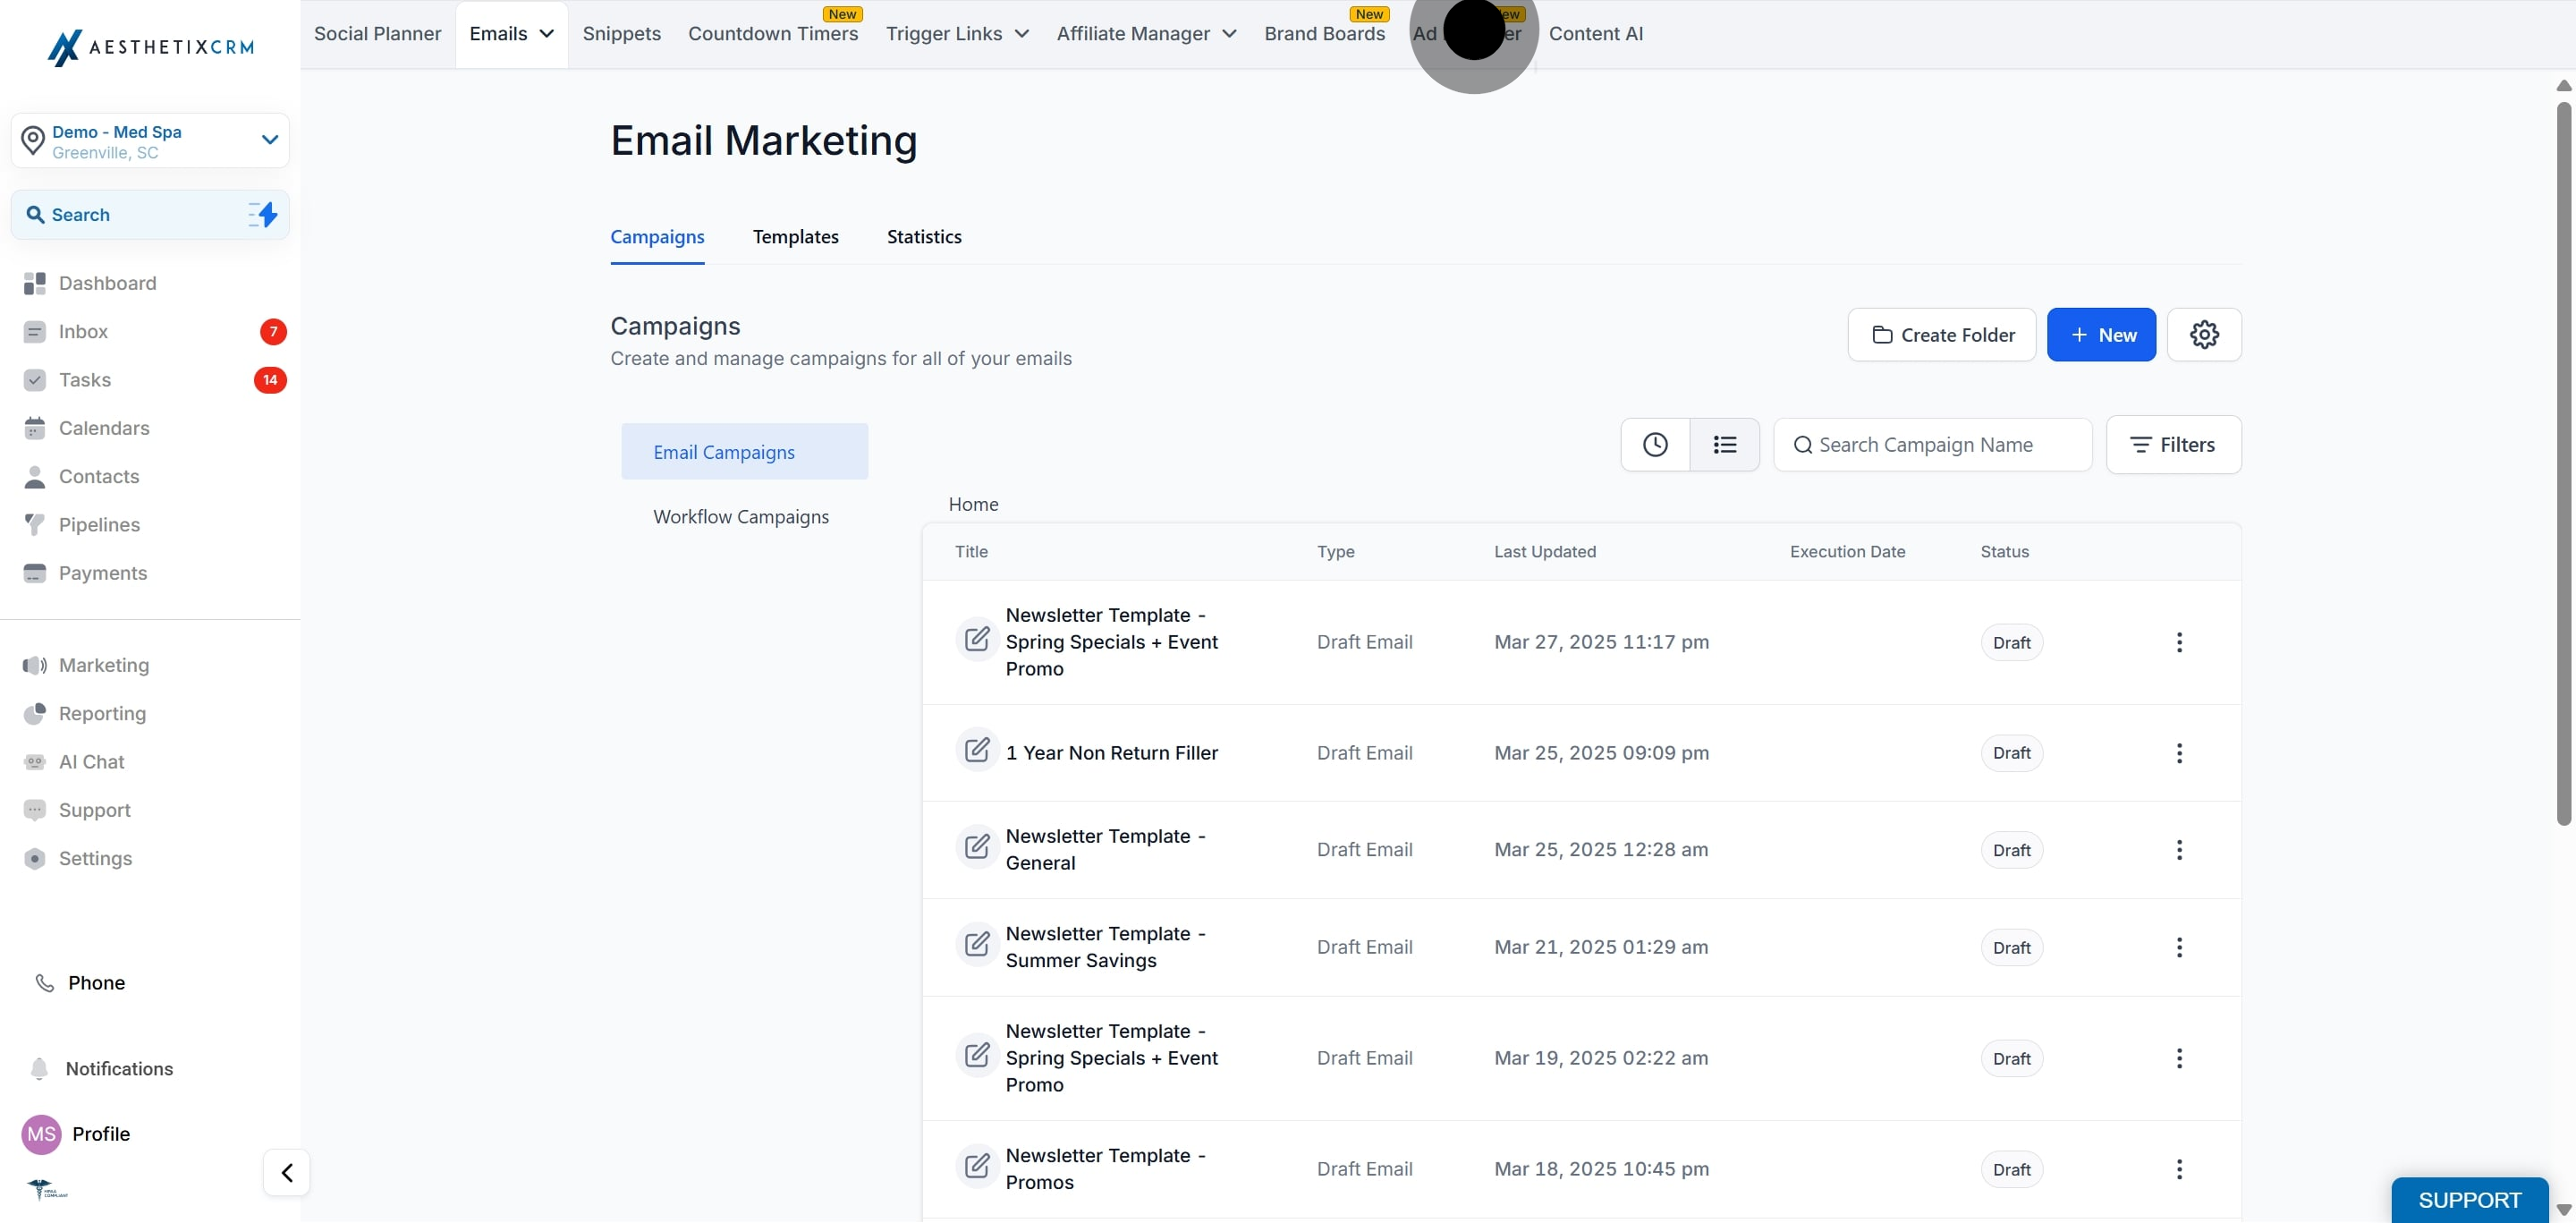
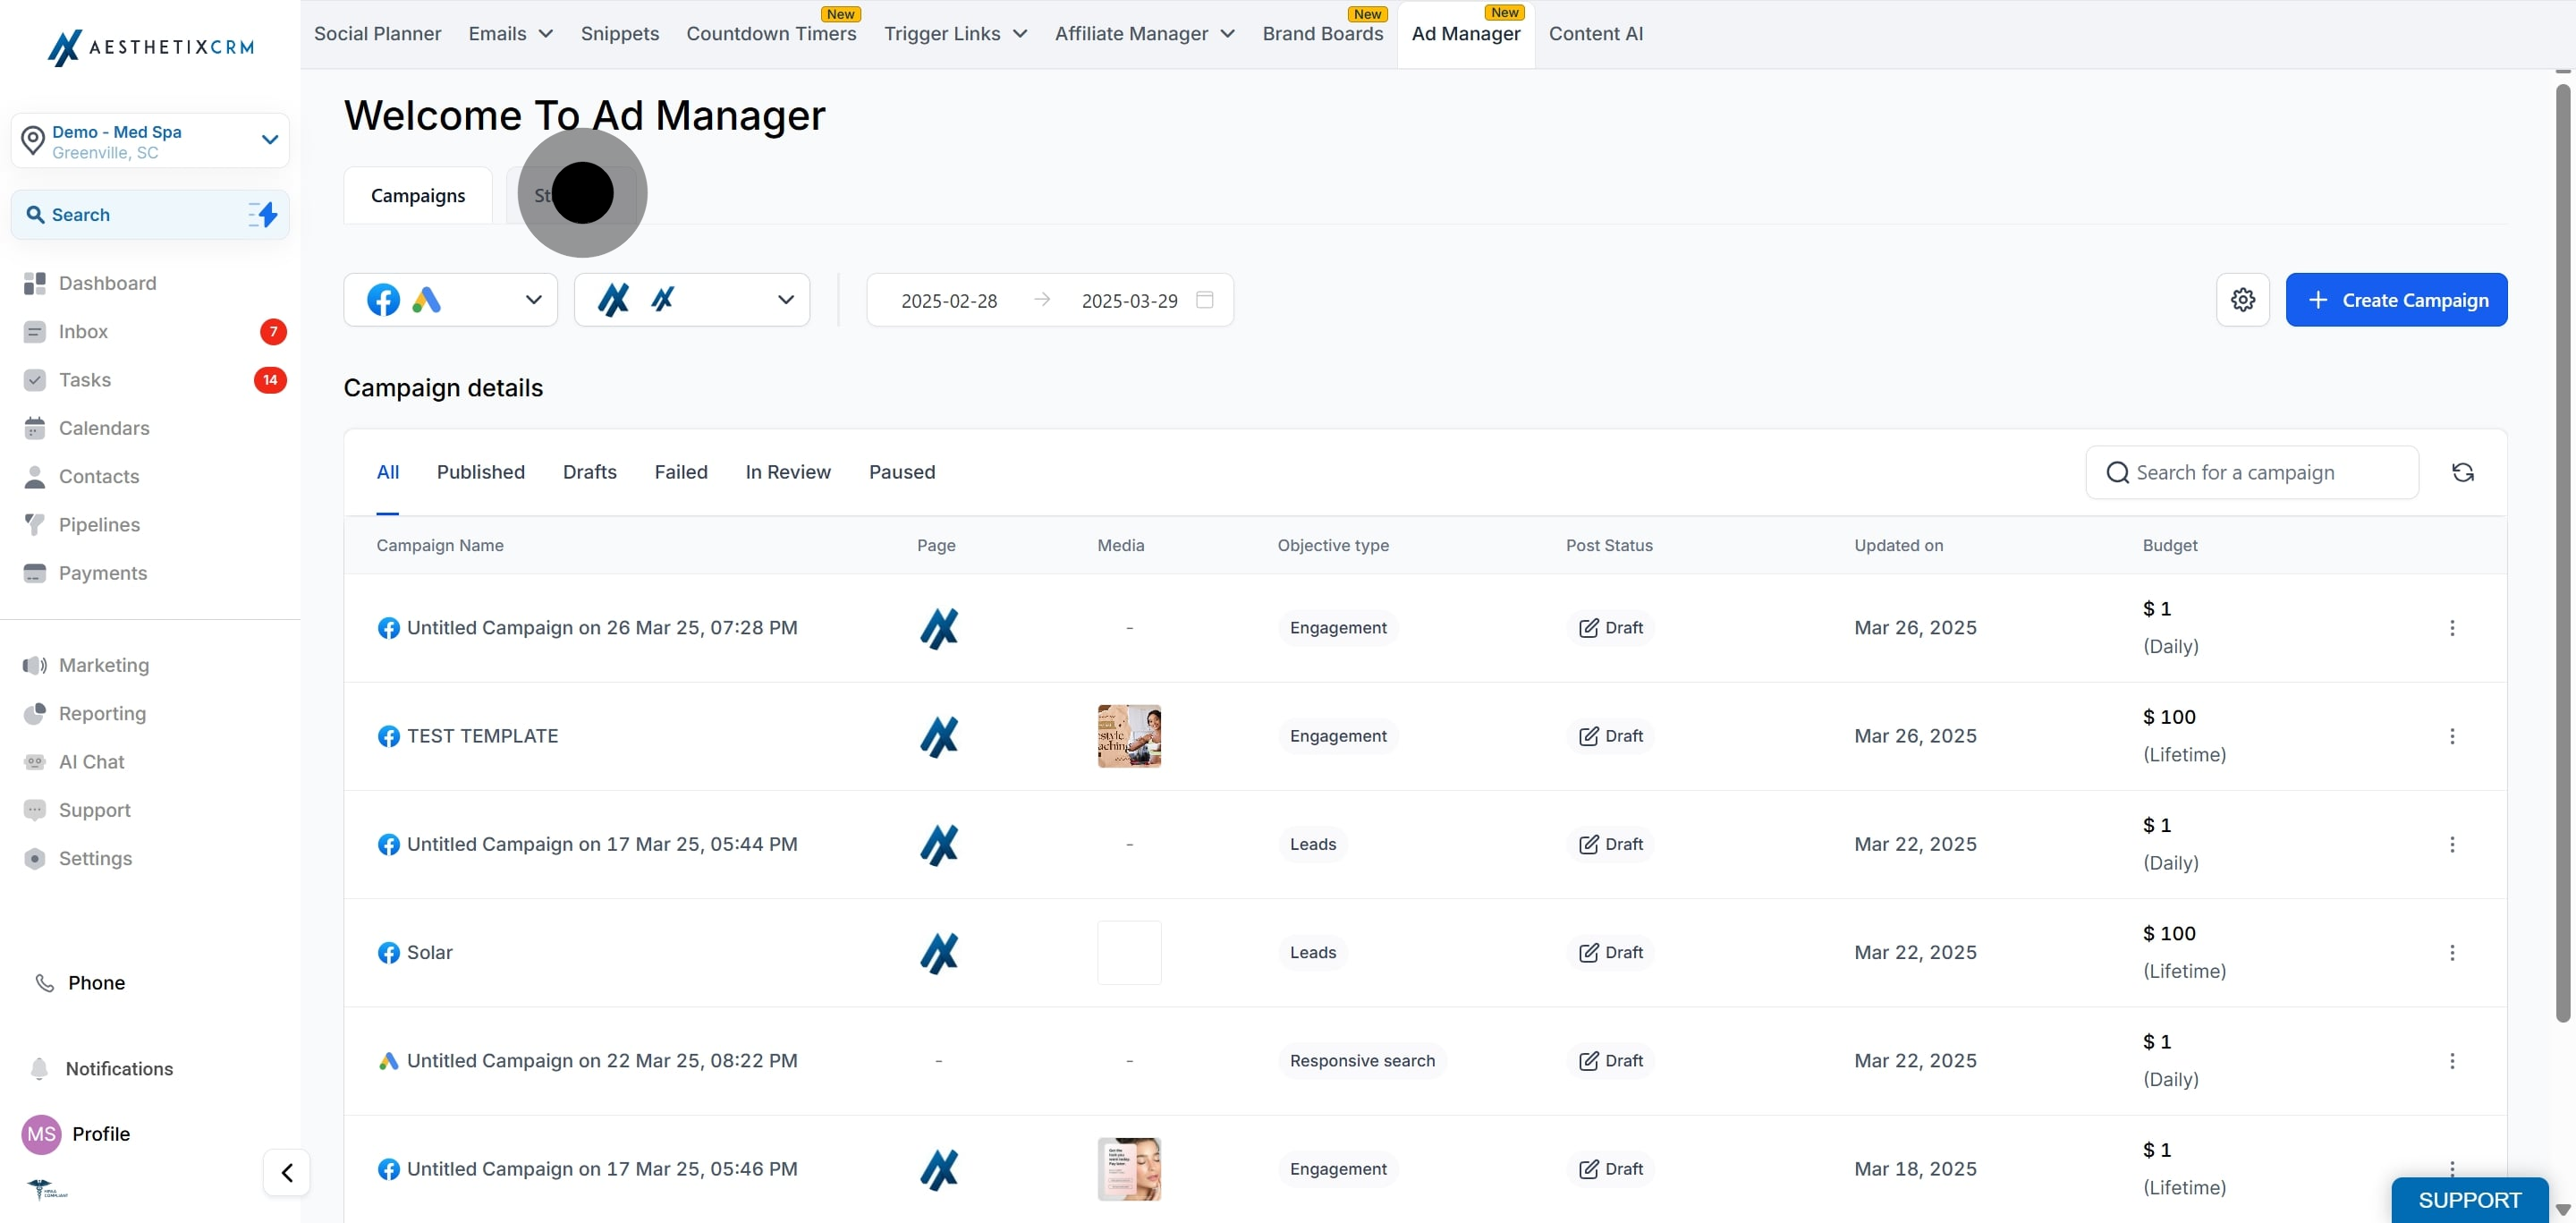
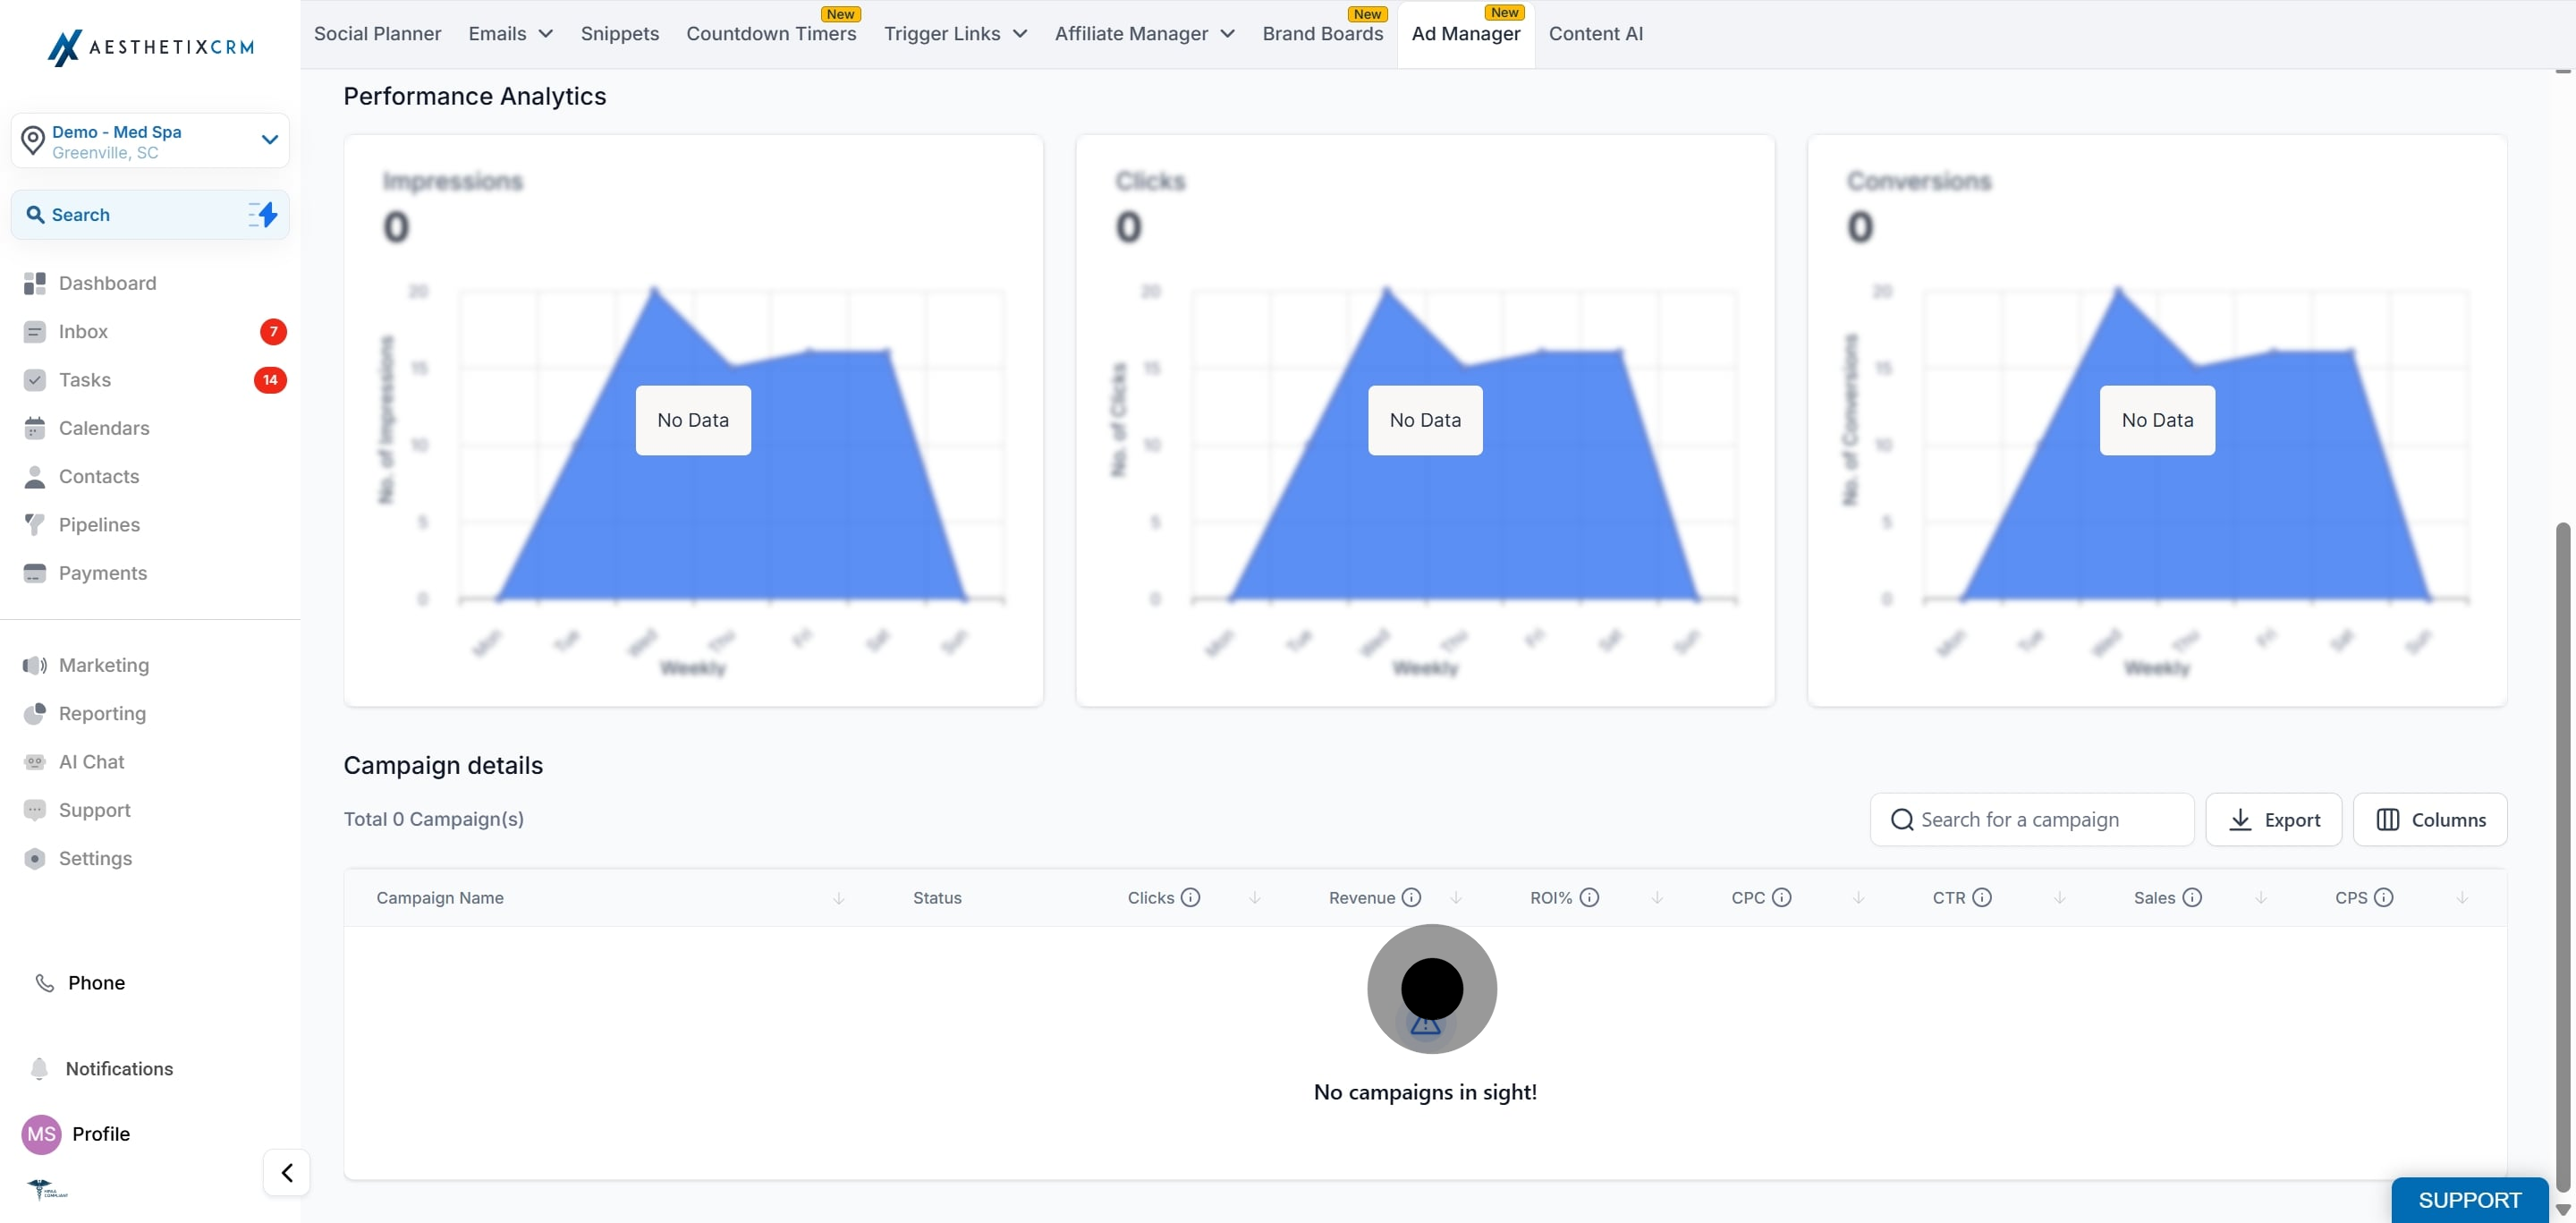
The Ad Manager home screen has two tabs: Campaigns (selected by default) and Statistics. Click Statistics to open a screen showing the metrics for all your Published and Paused campaigns, along with Performance Analytics and a Conversion Summary.
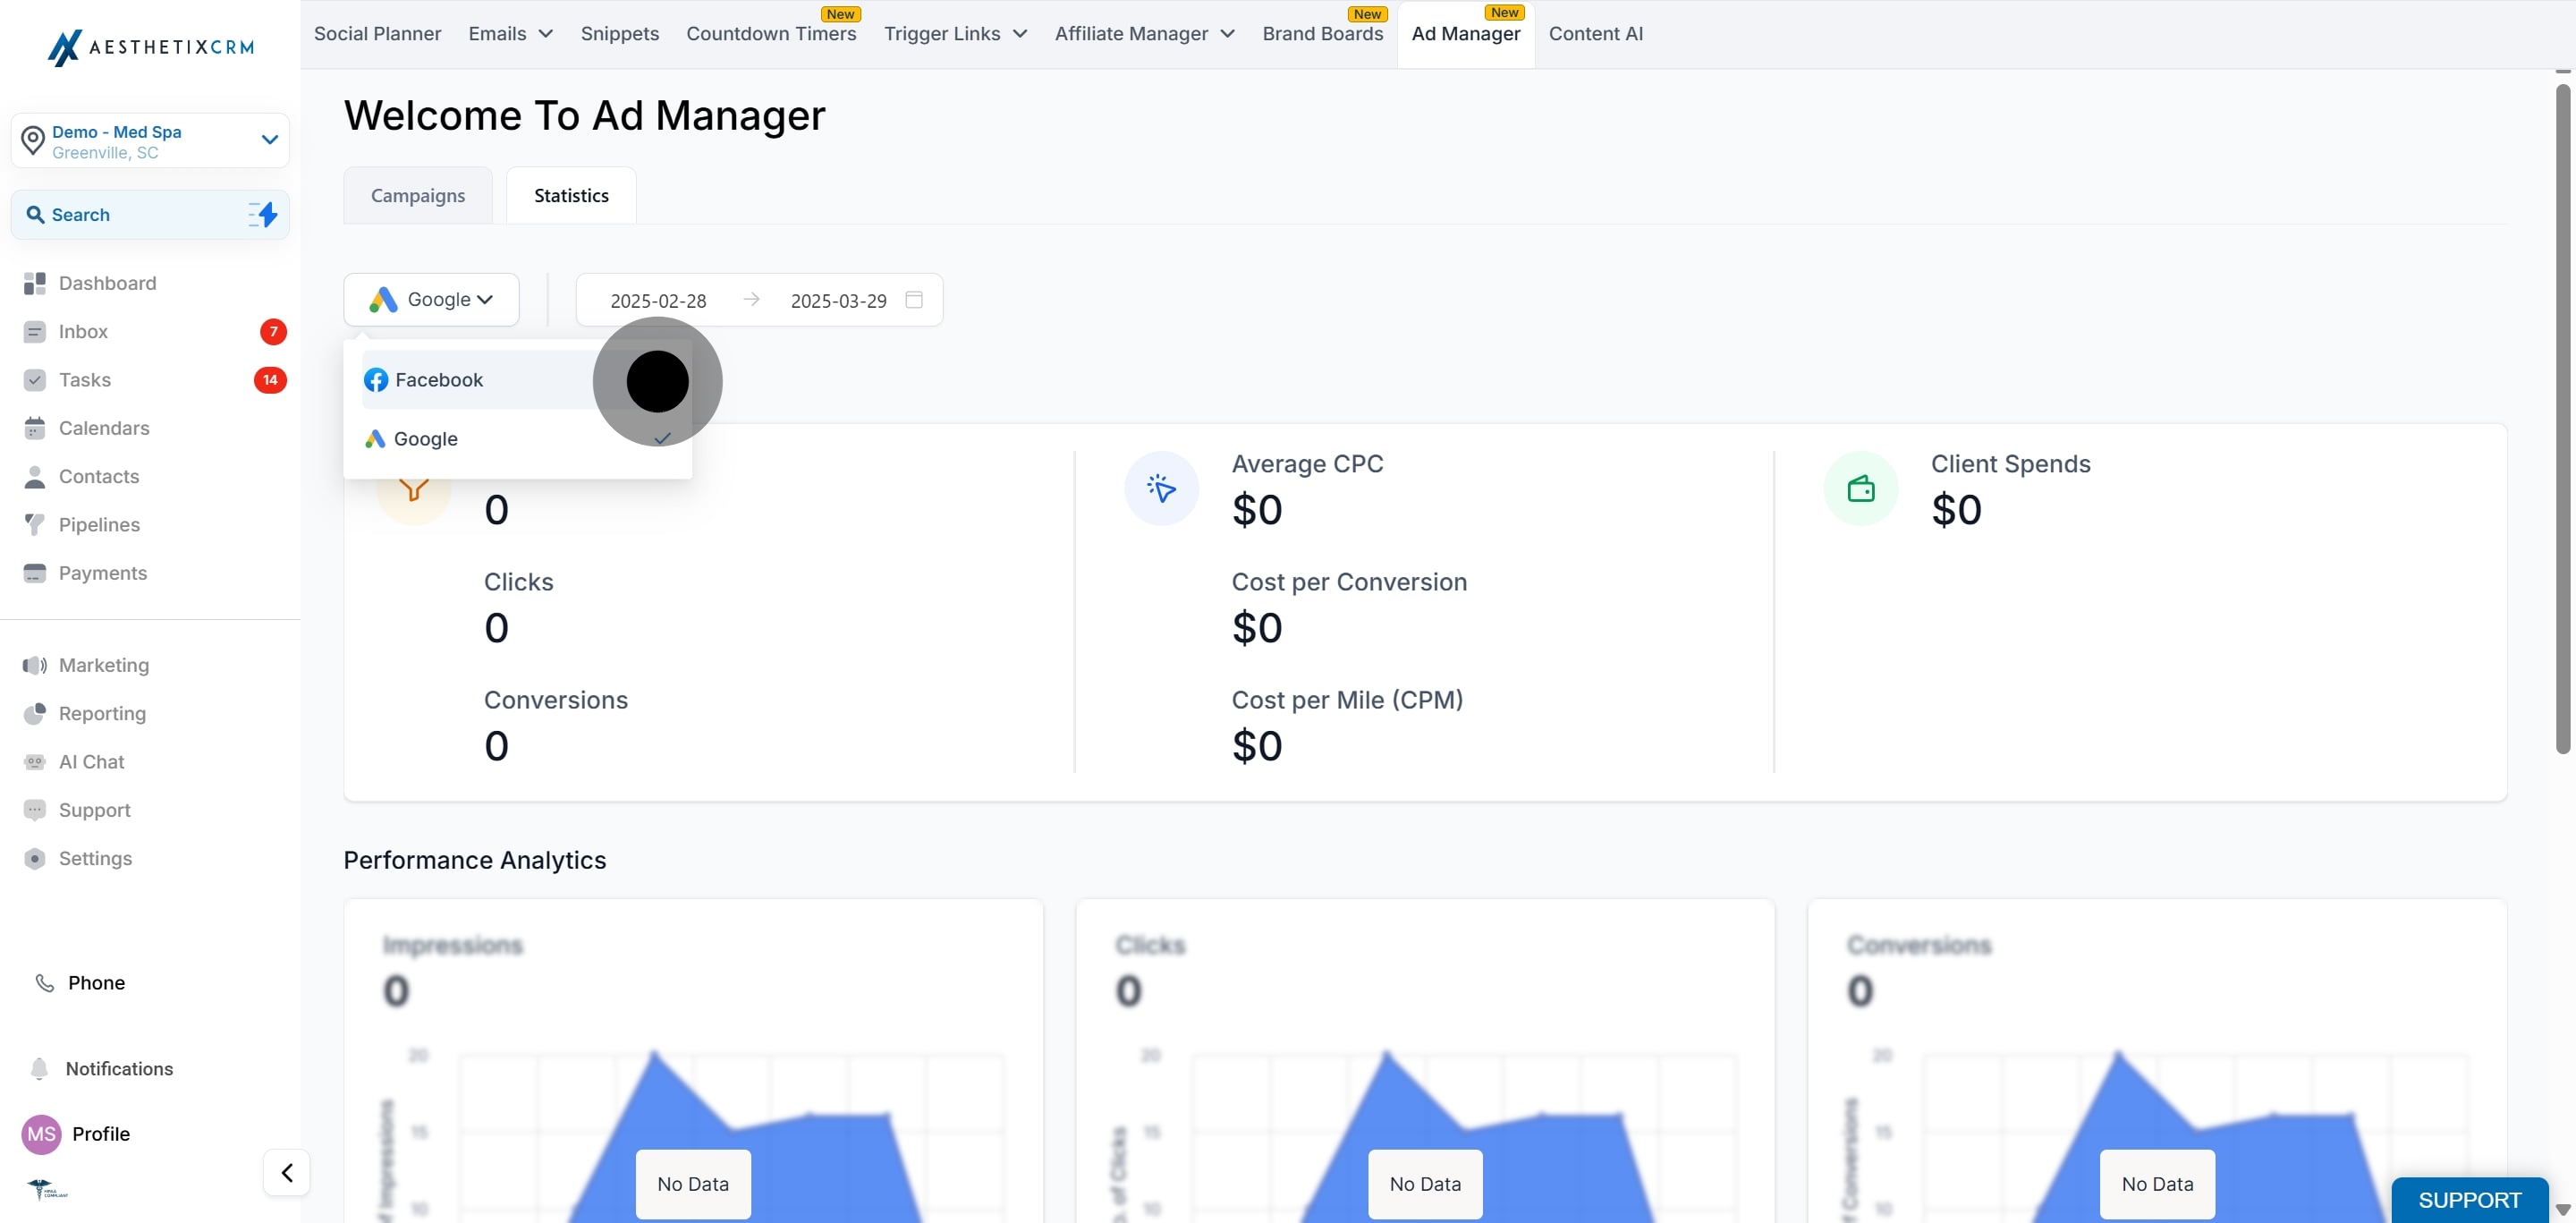
Use the filter at the top left of the Statistics page to choose which ad platform's metrics you want to see.
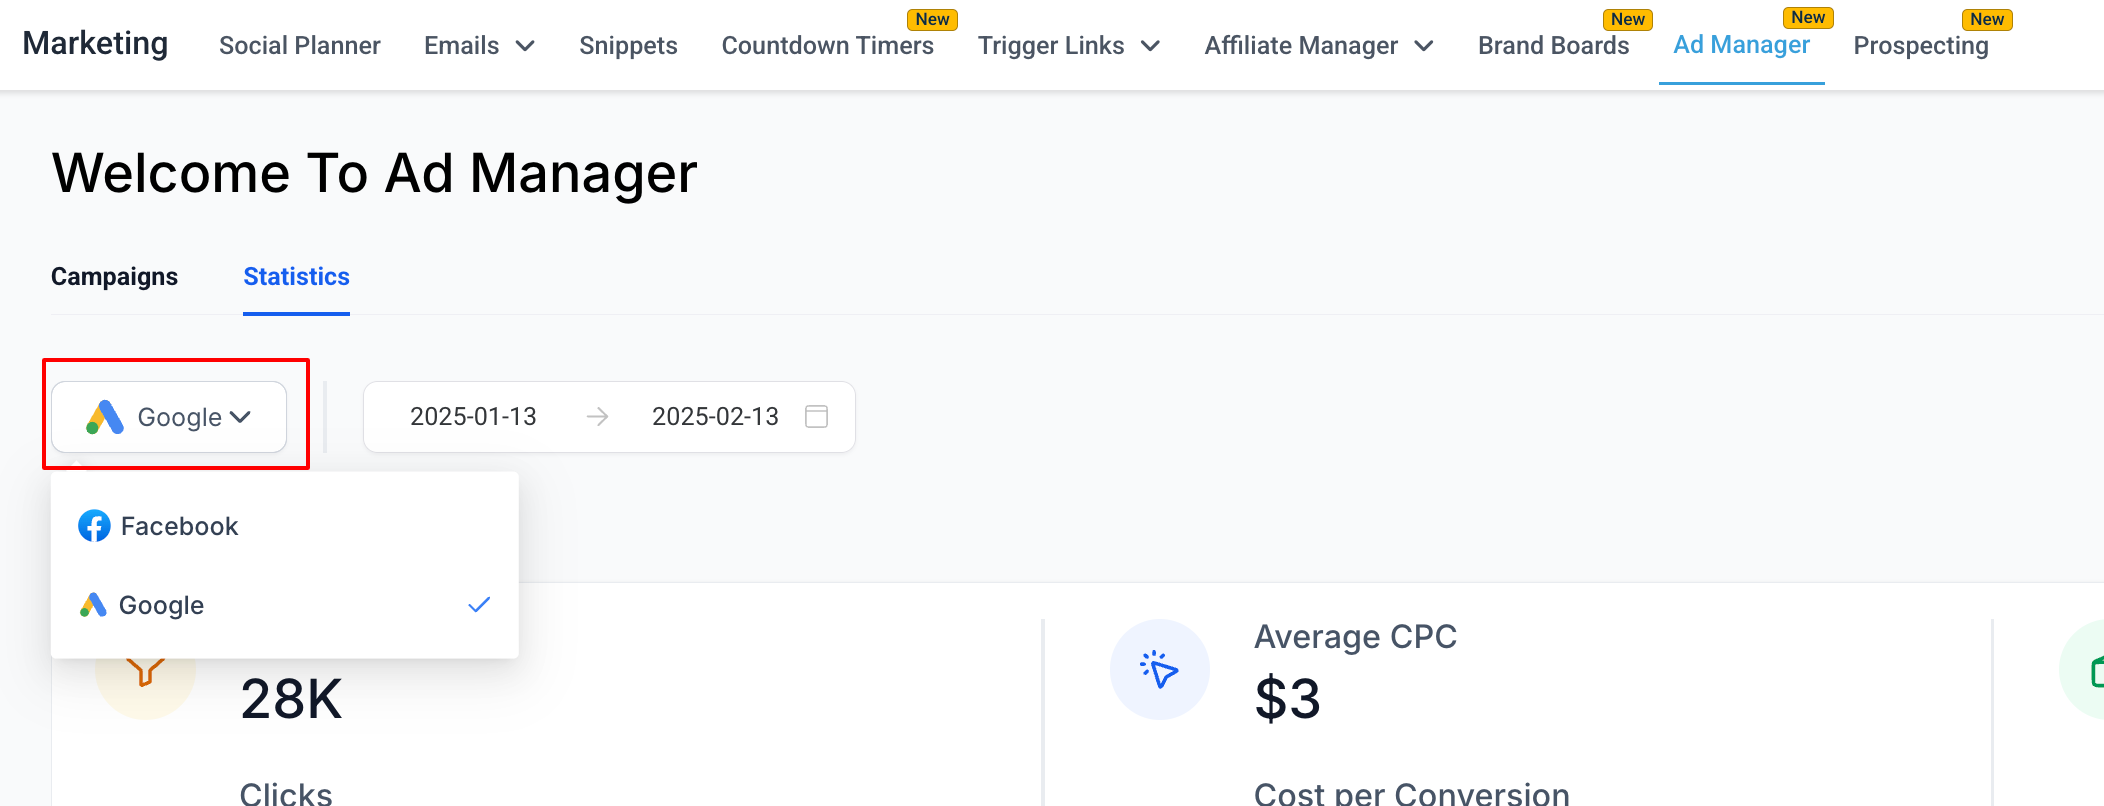
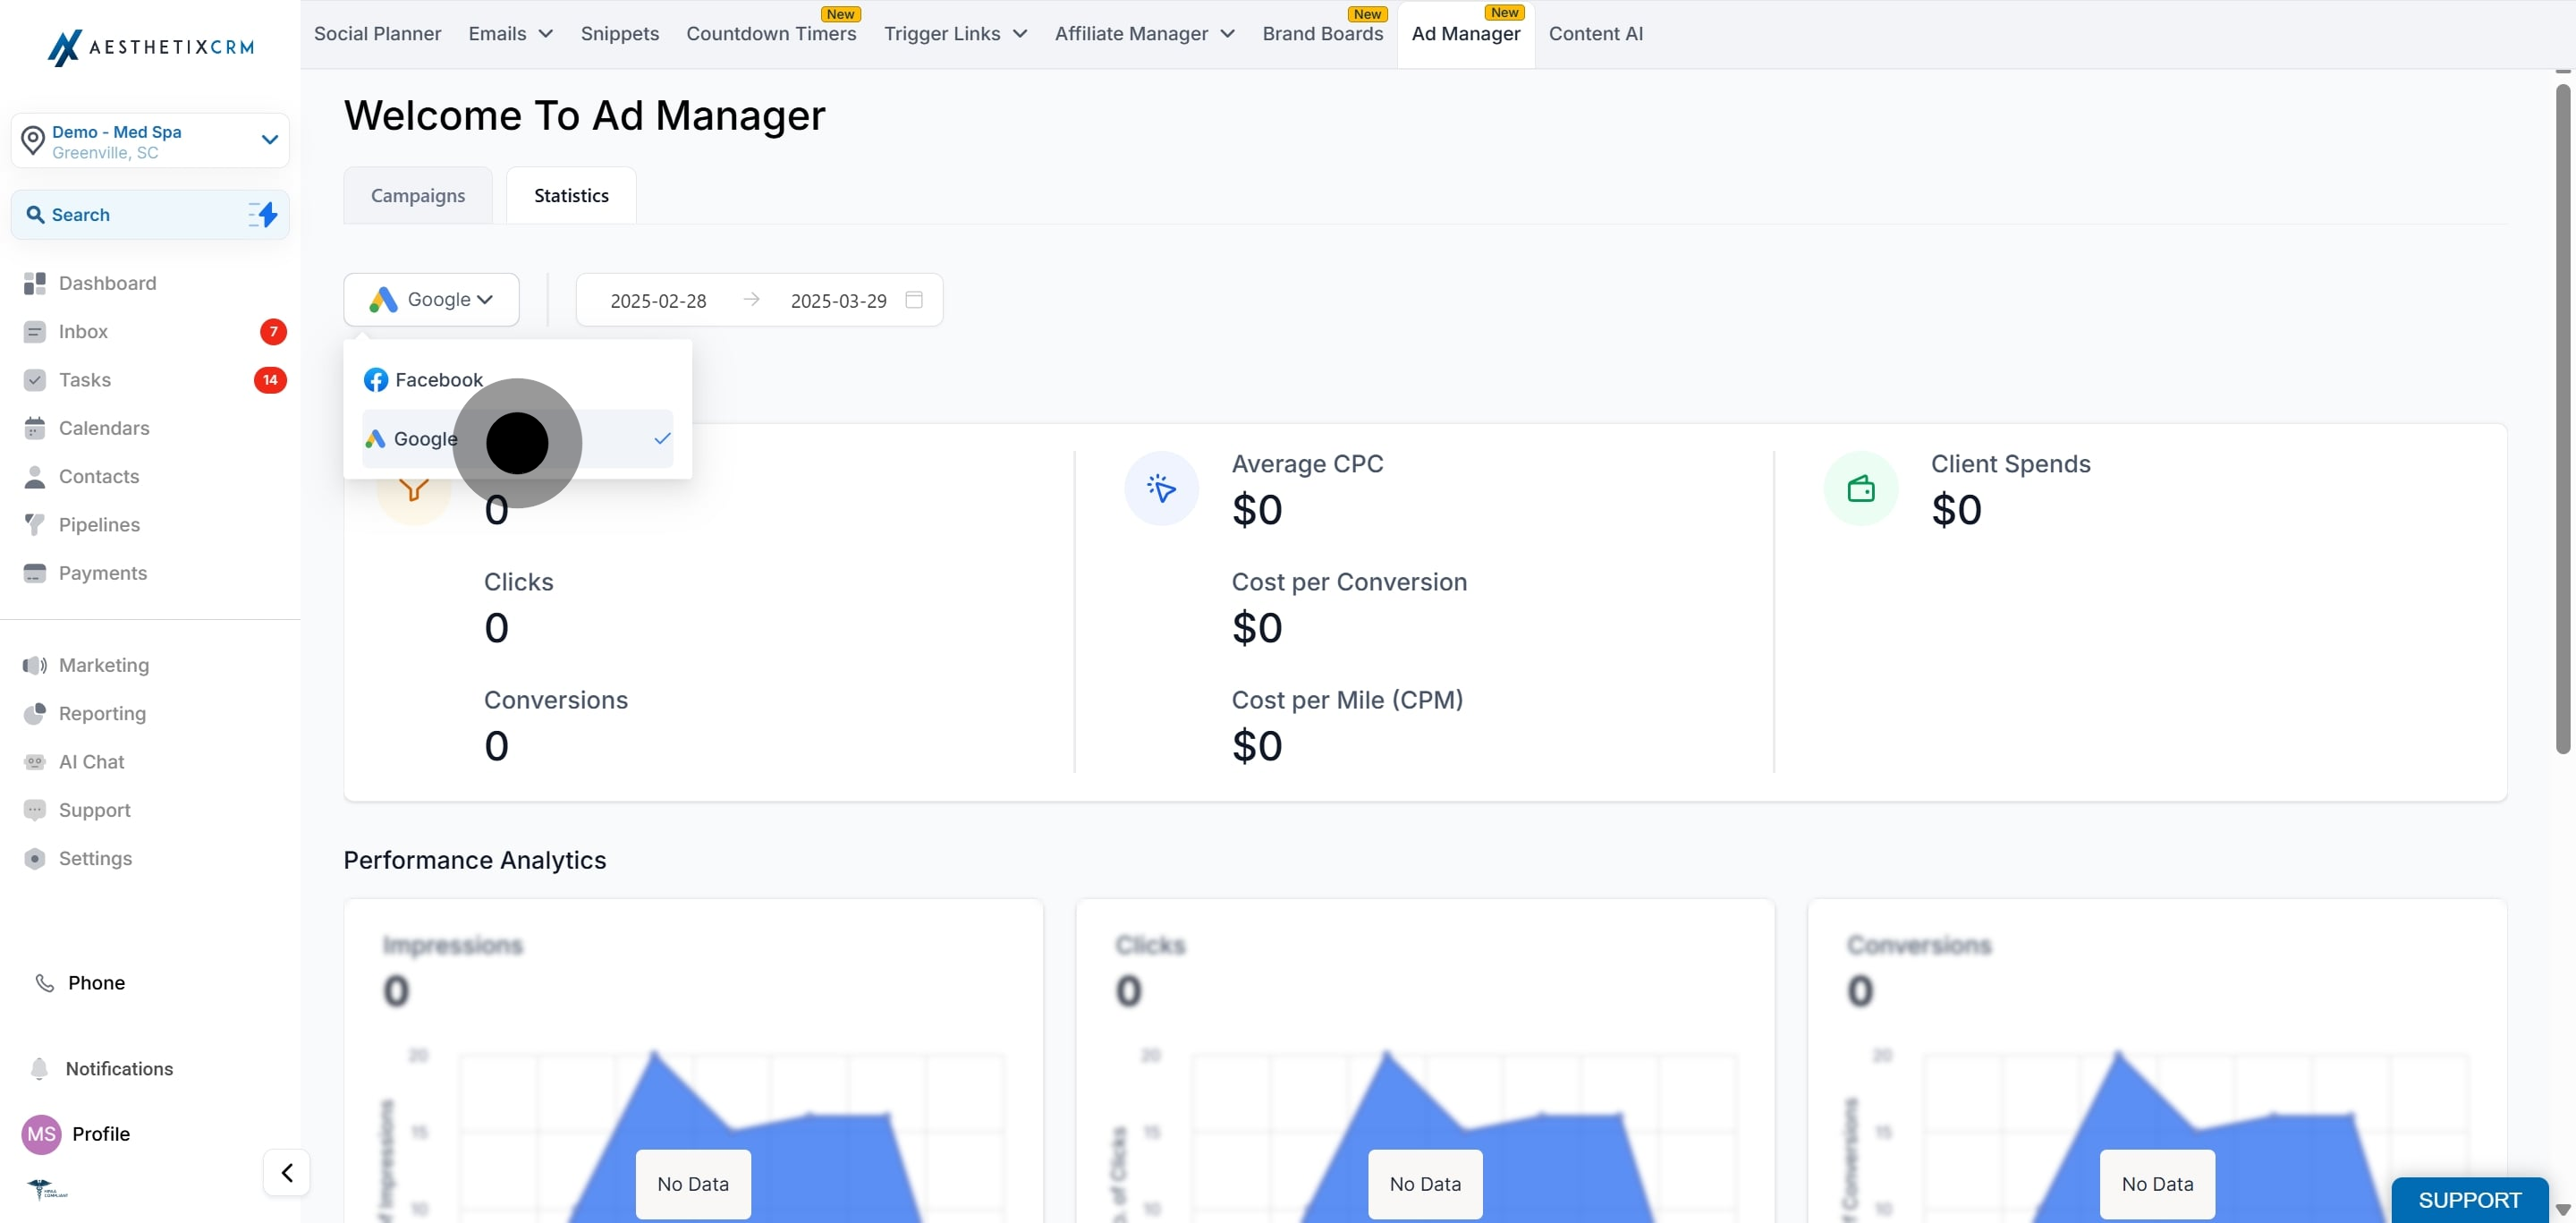
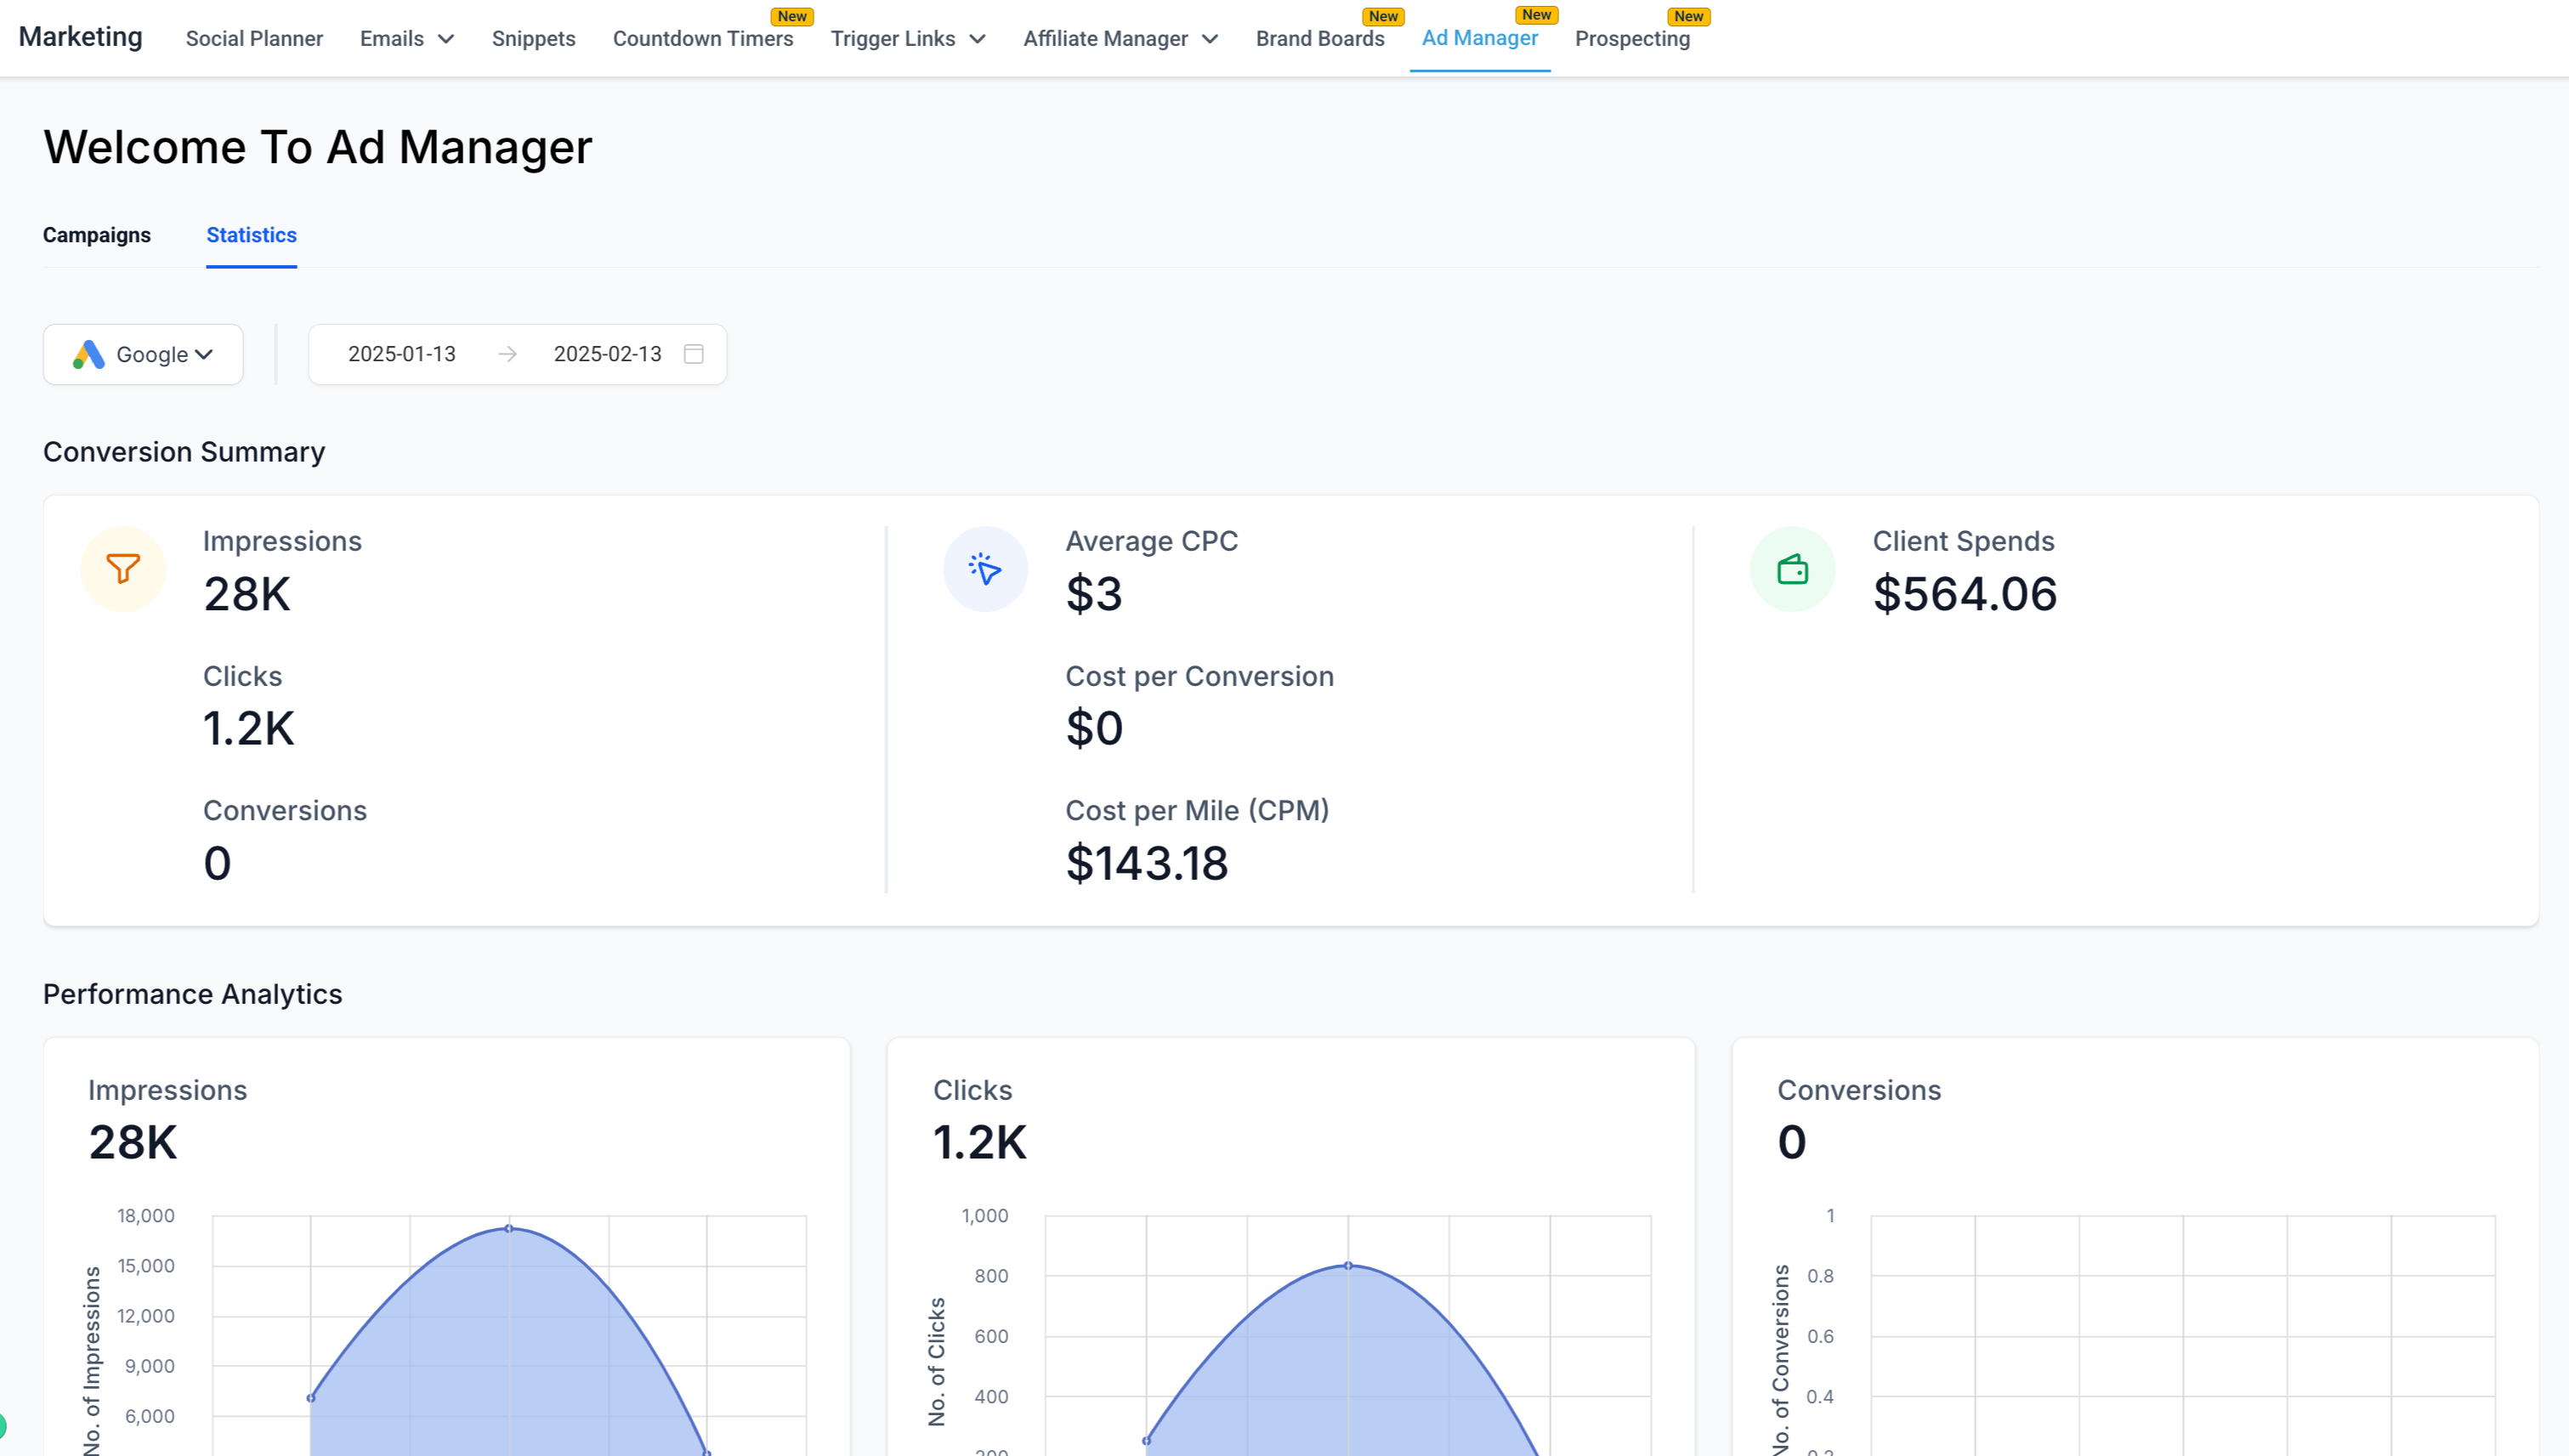
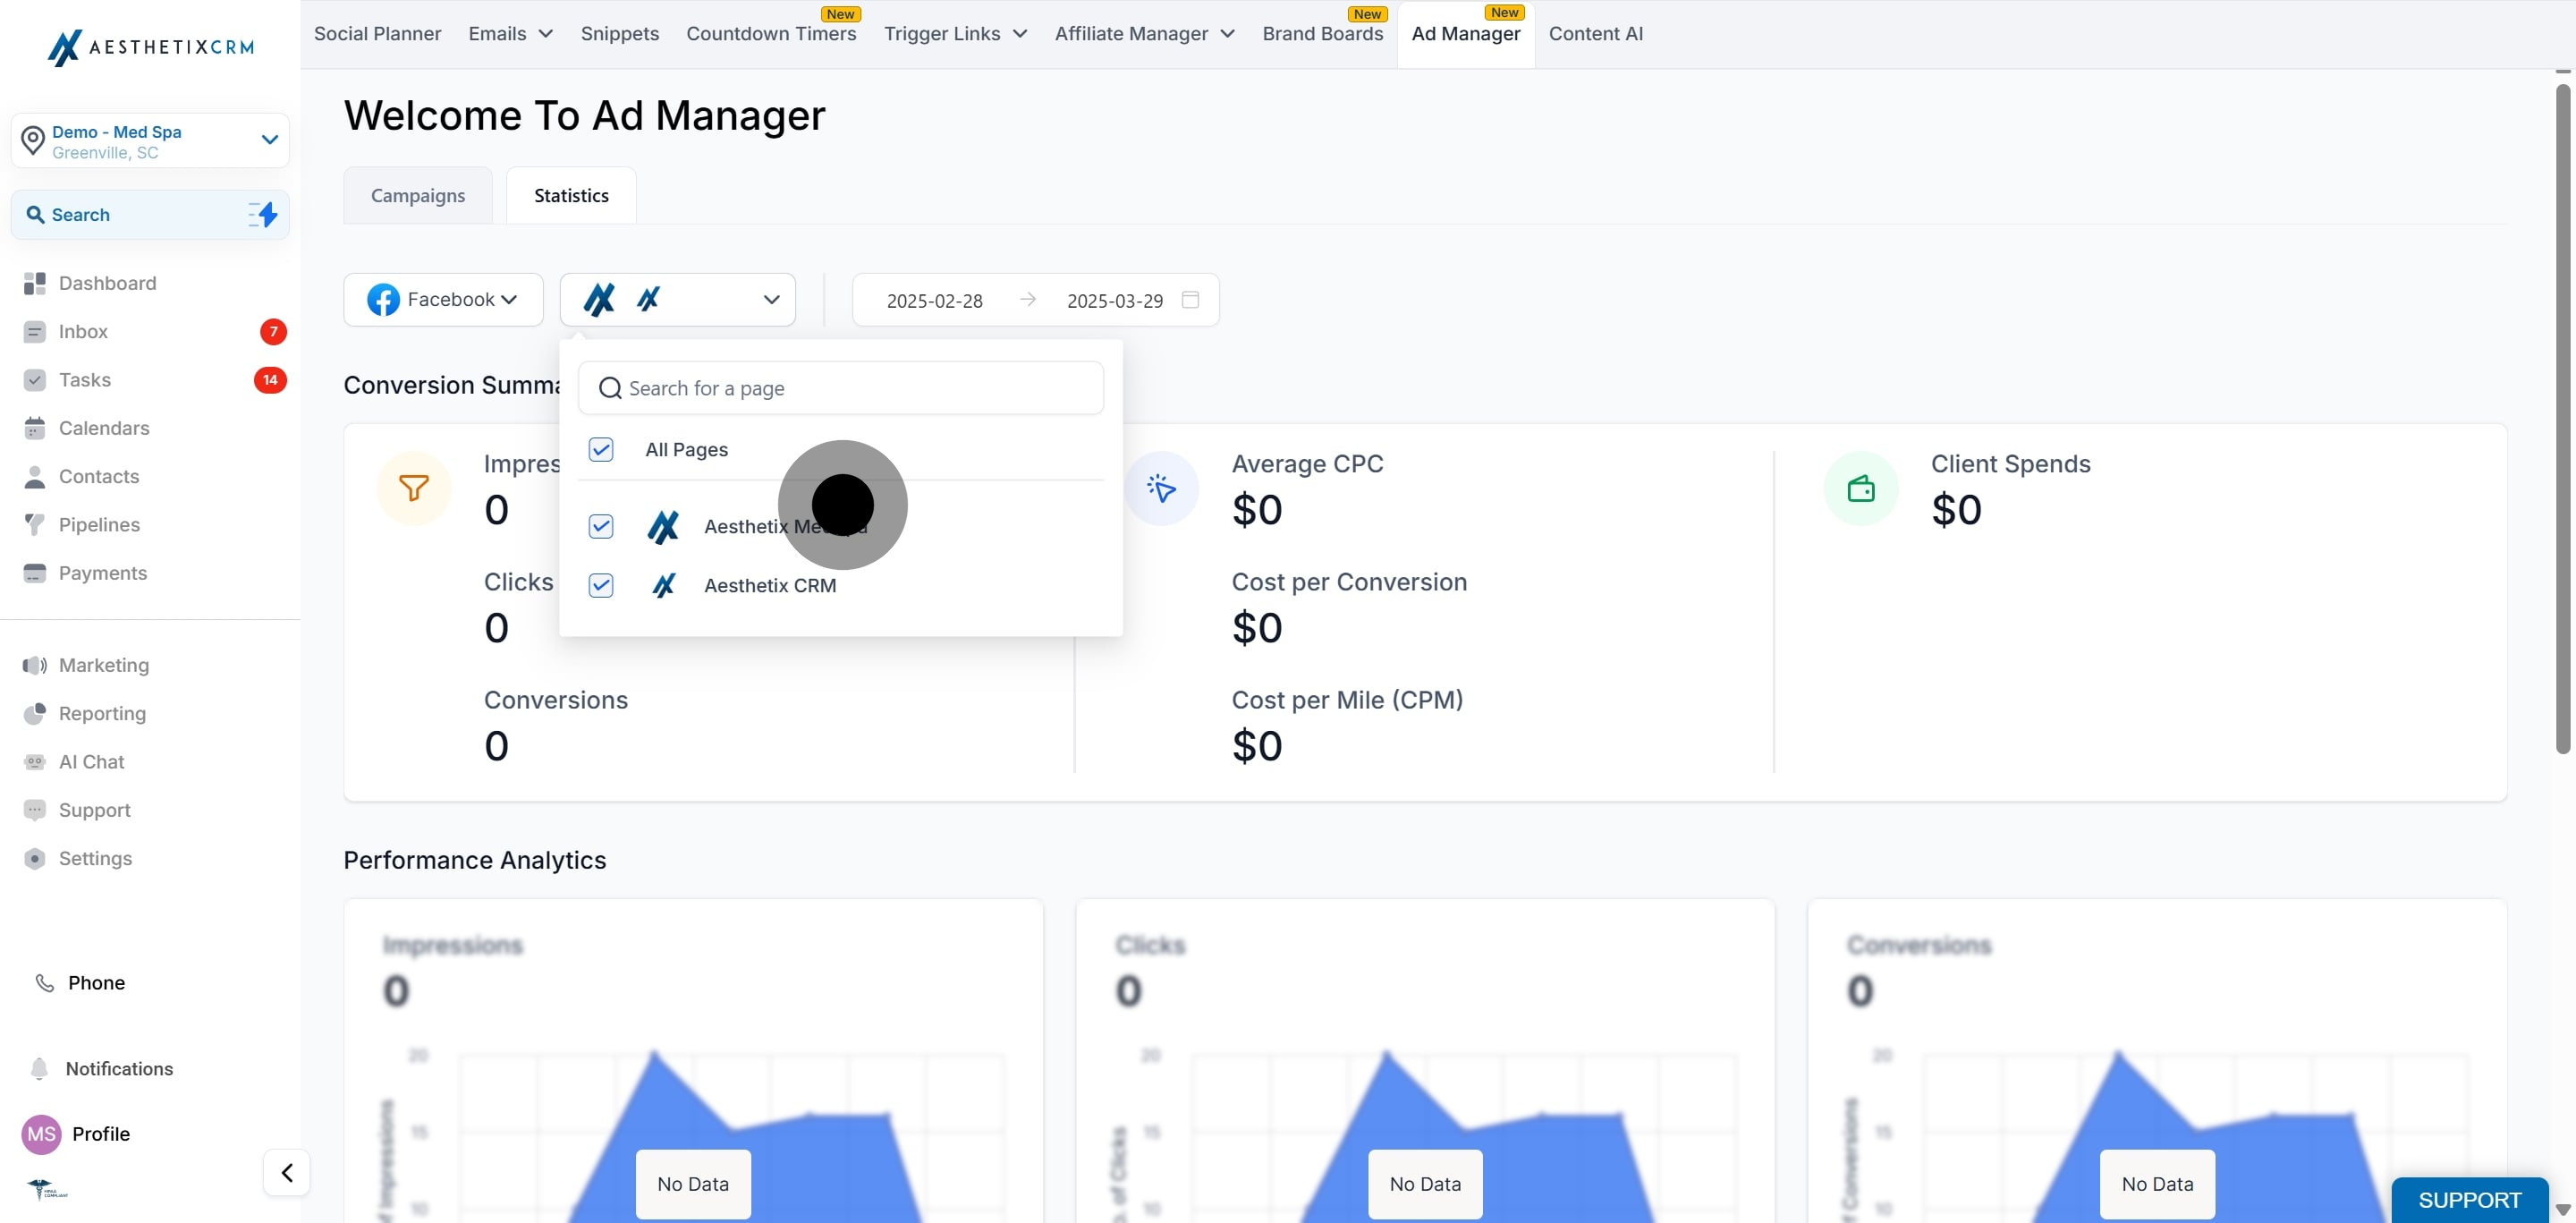
Everything works the same for Facebook as it does for Google, with the addition of a page selector filter that lets you narrow your view to campaigns published on specific Facebook pages.
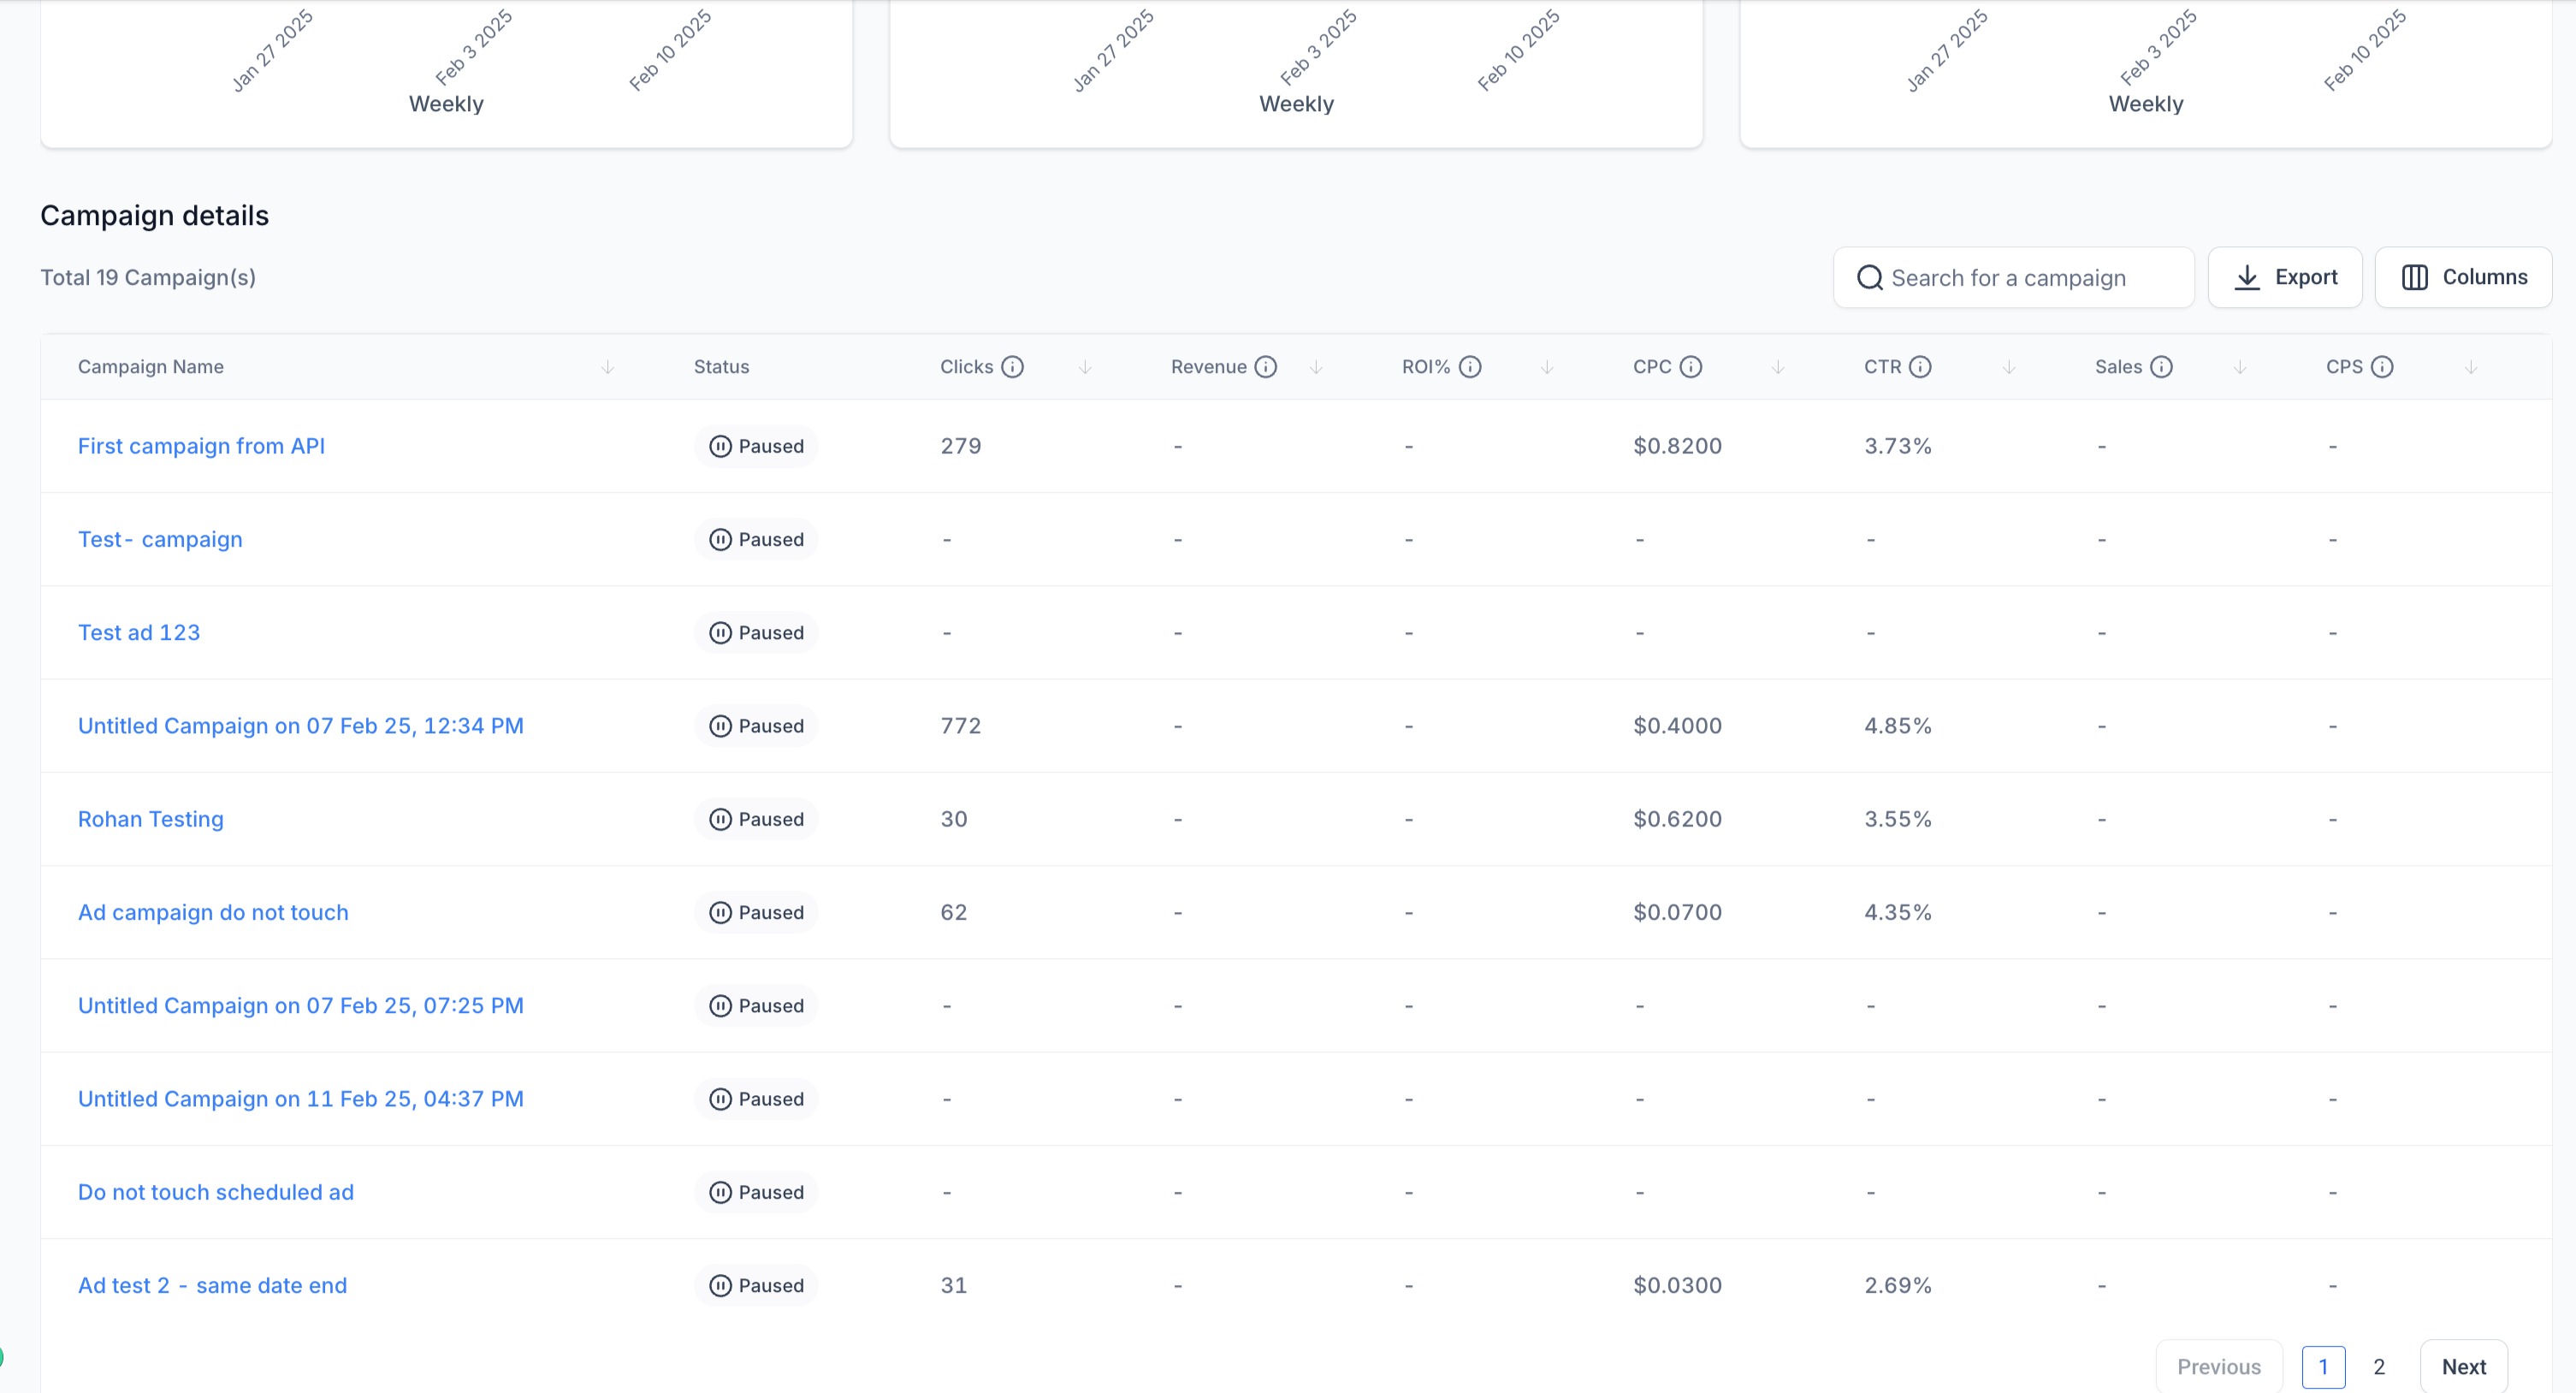
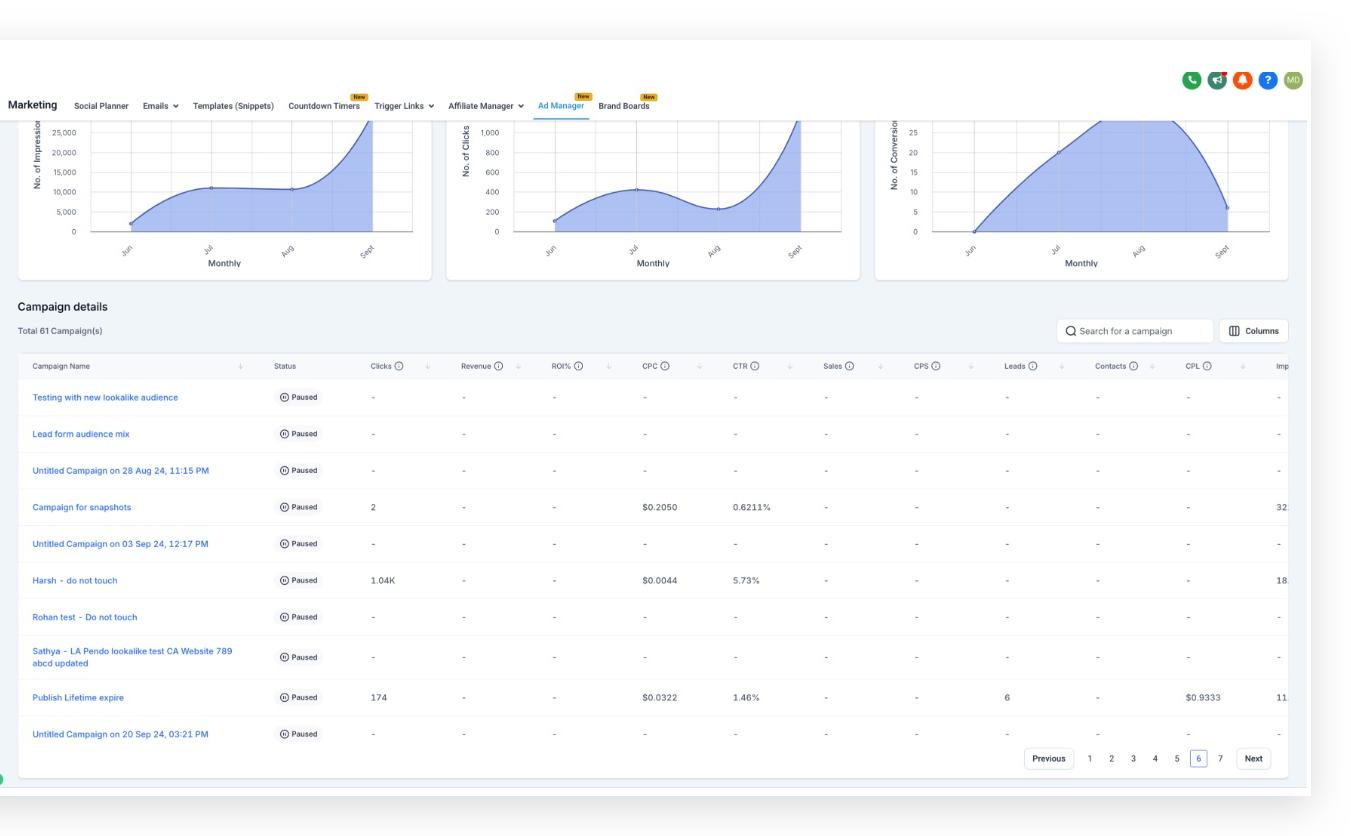
The campaign details table is customizable. Choose which metric columns to show so only the numbers that matter to you appear, keeping your analysis clear. For Meta campaigns, you can also analyze results at the Ad Set and Ad level for deeper optimization.
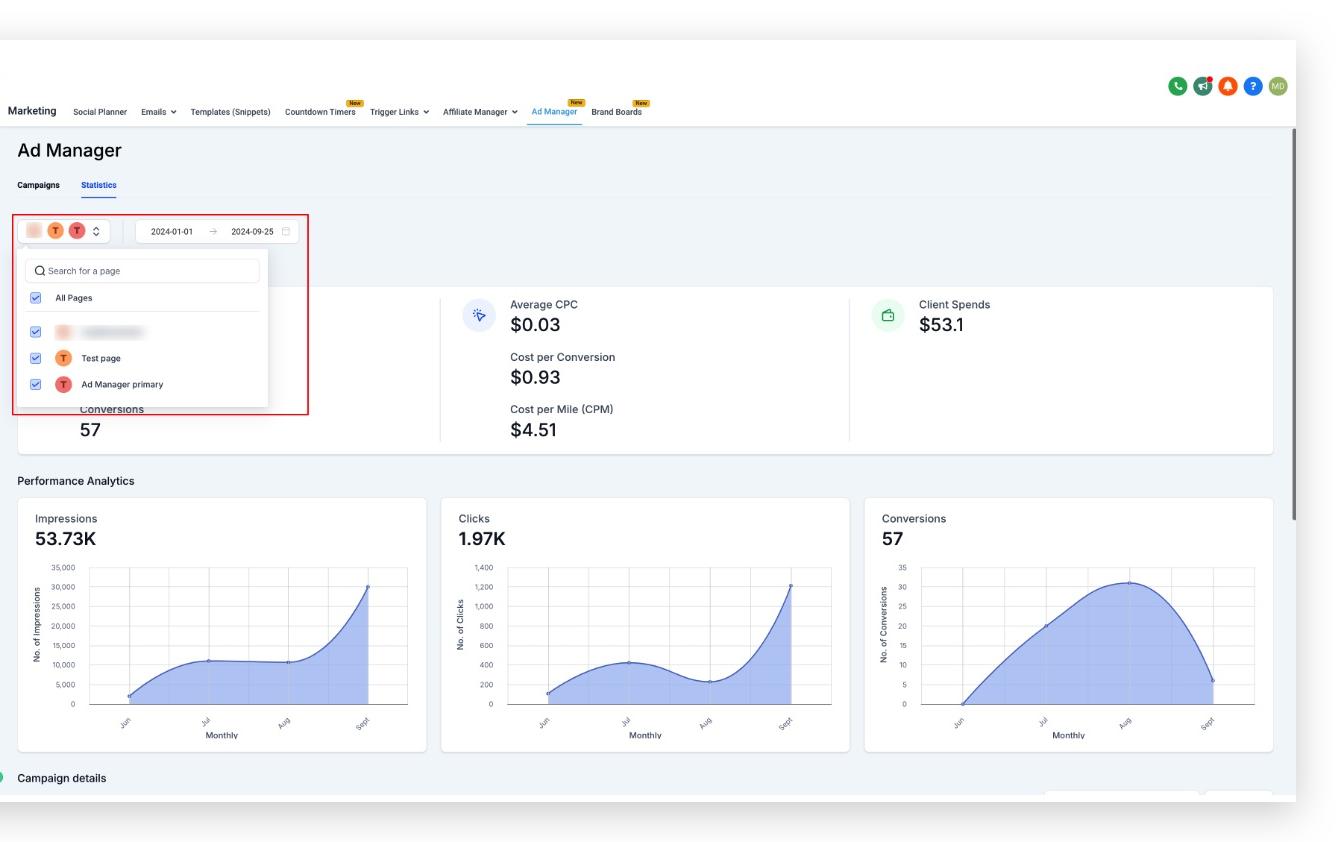
The page filter lets you select one or more pages from the dropdown so you see only the statistics for campaigns published on those pages.
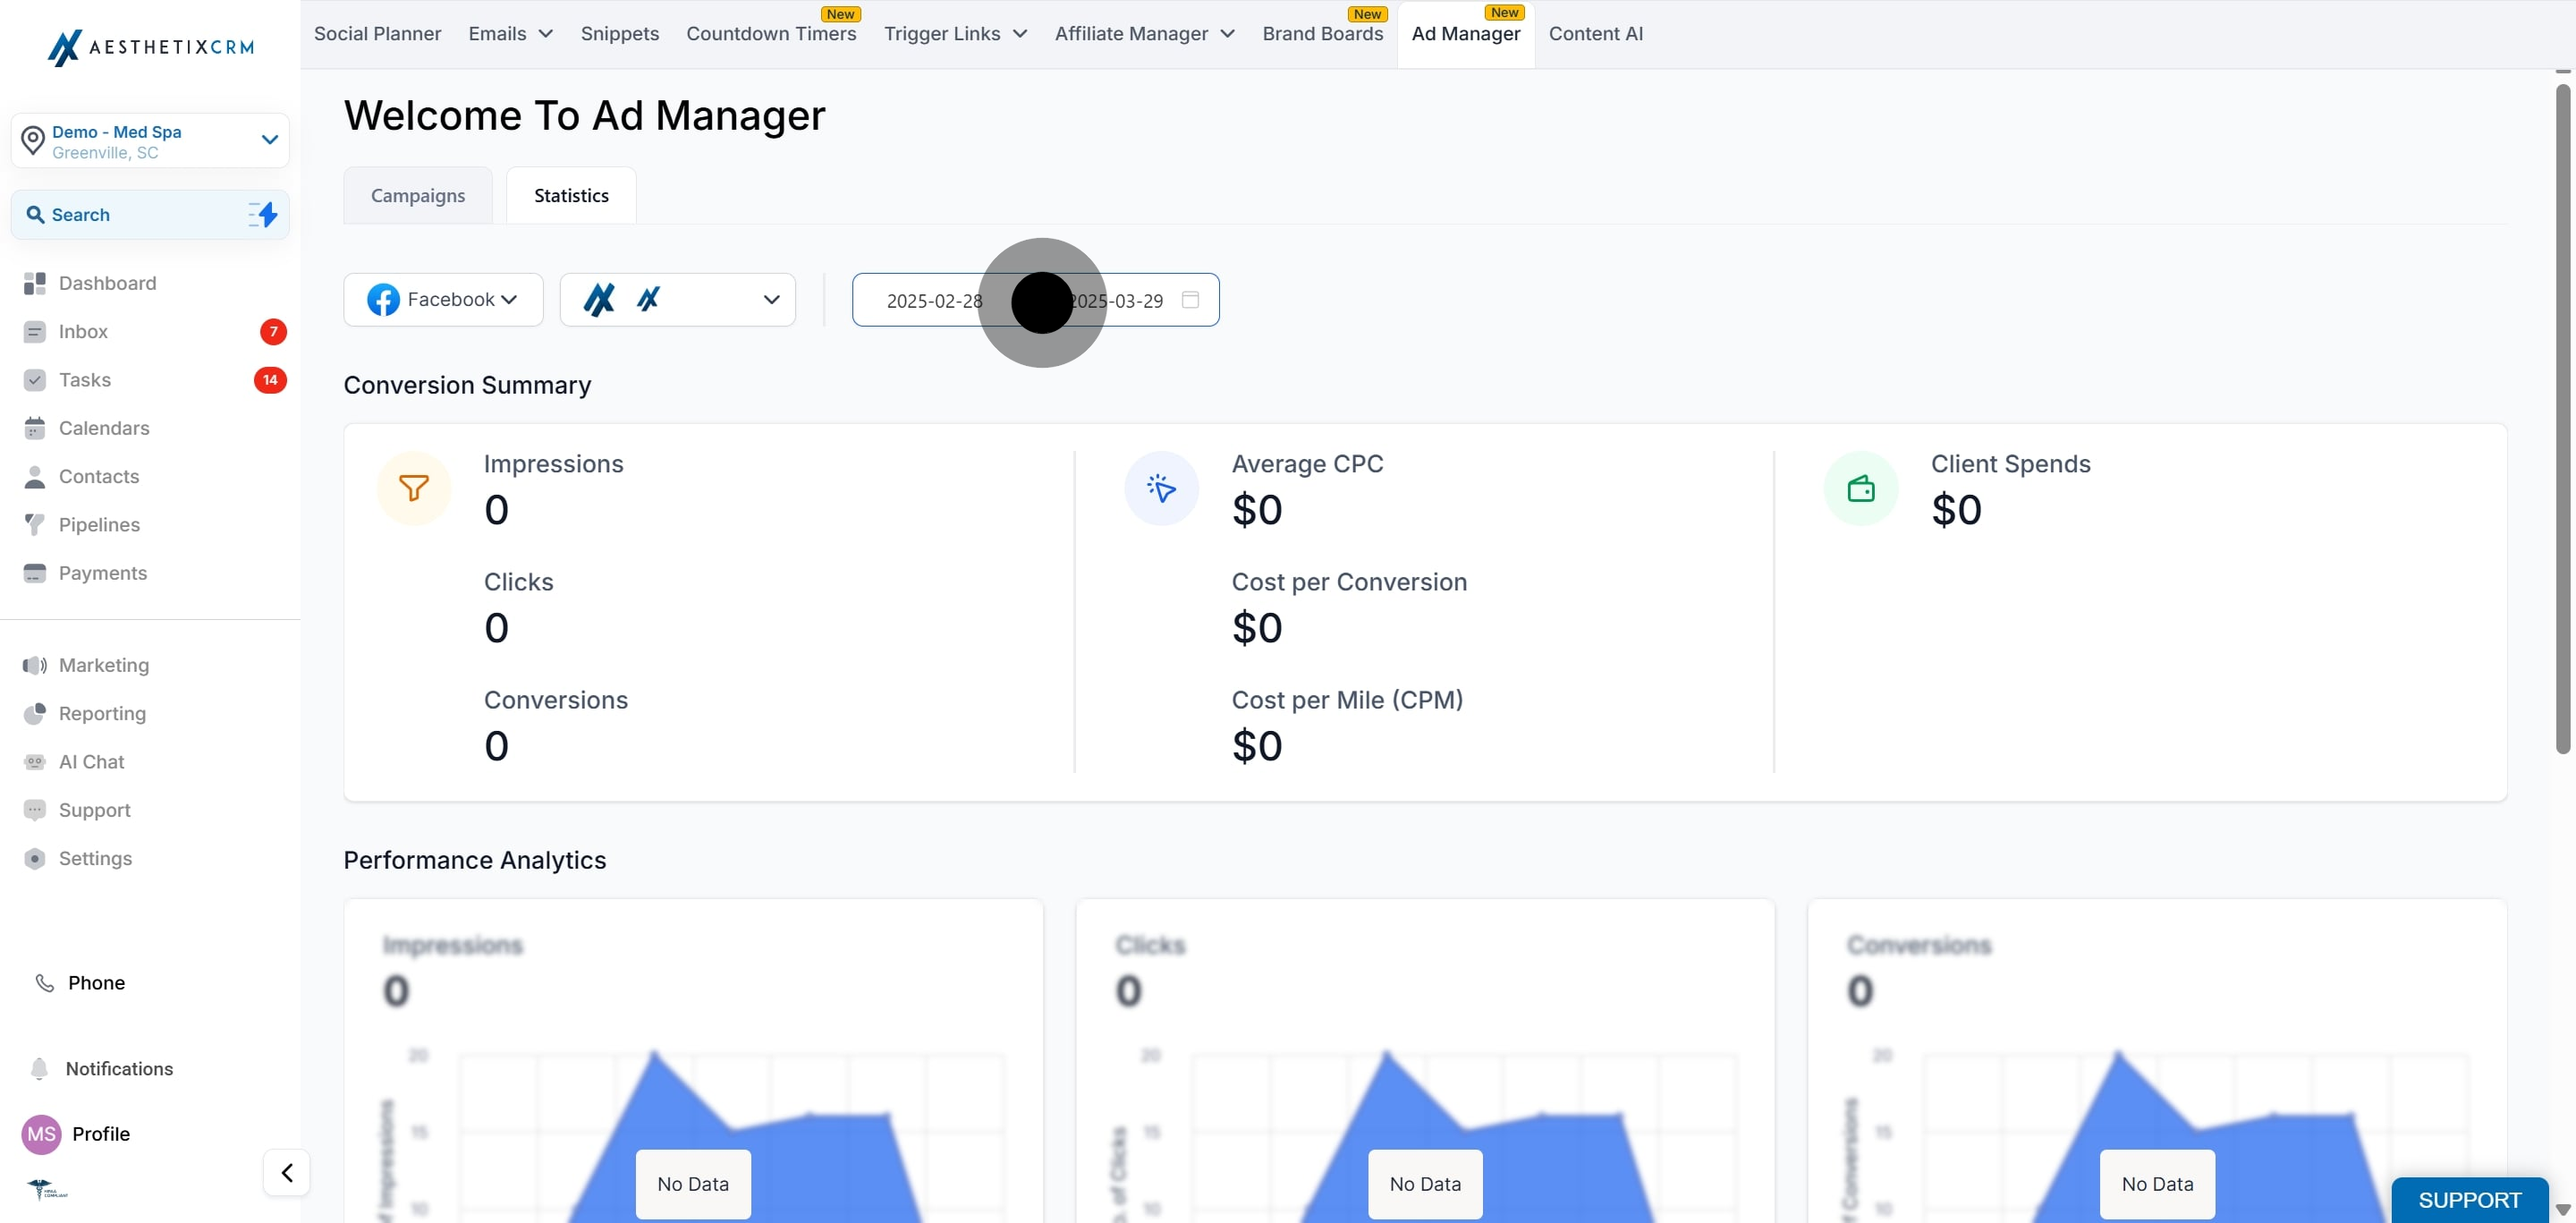
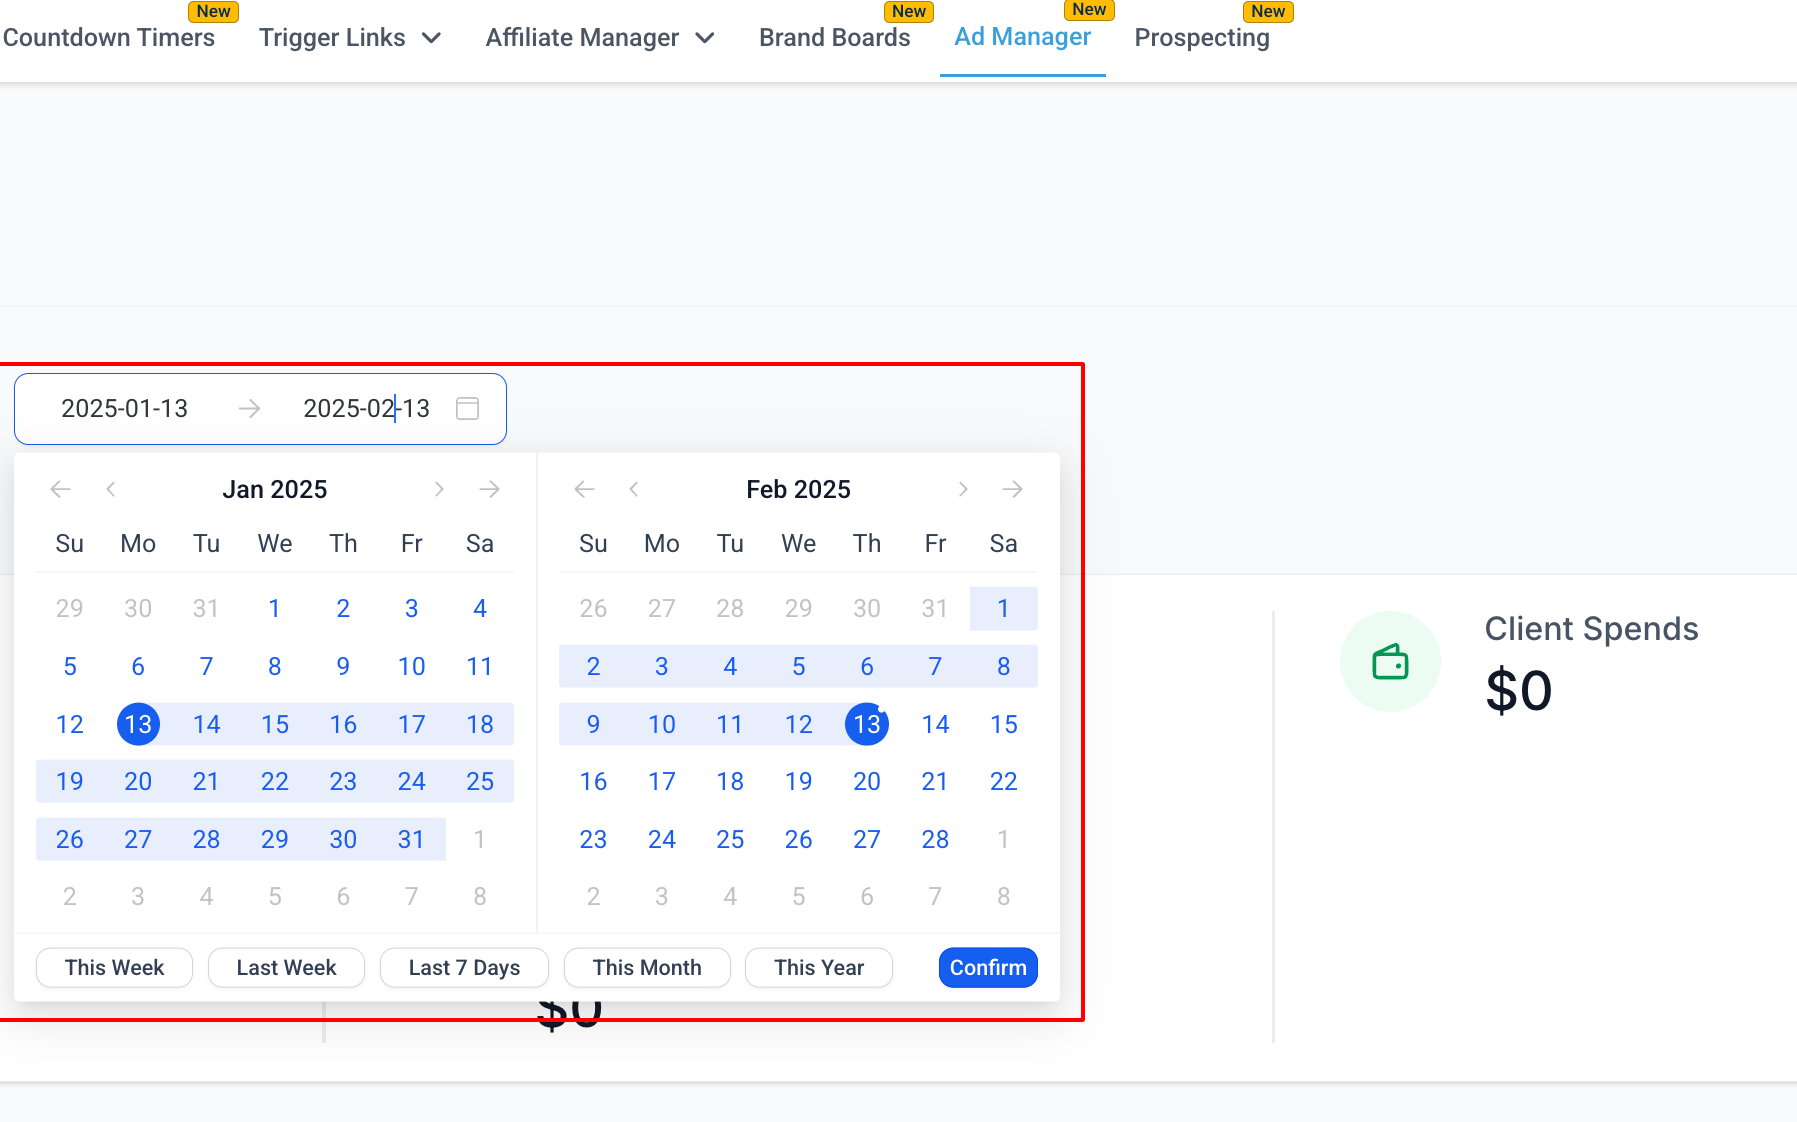
Select a date range and the statistics for all campaigns in the list update to reflect that period.
The Statistics table lists each campaign with its performance details, such as clicks, ROI, CPC, and CTR.
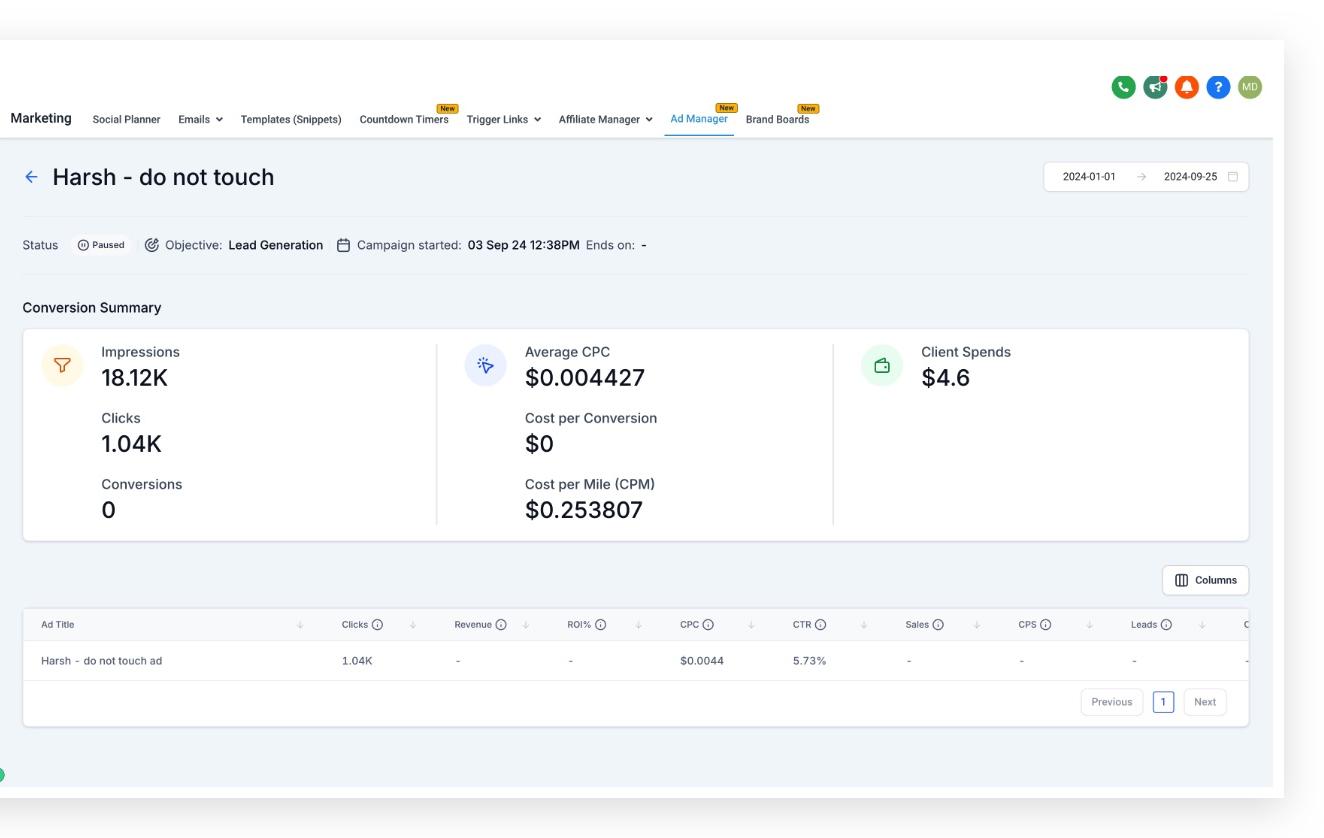
Click an individual campaign name to open a page with statistics specific to that campaign. The columns on the individual campaign table are also customizable, so you can show only the metrics you care about. A date filter is available on individual campaigns too, so you can view a single campaign's stats within a defined date range.
For Meta campaigns, Statistics also supports performance visibility beyond the campaign level. After you open a campaign, you can drill into ad set and ad performance to identify which audiences and creatives are driving results.
If a campaign has more than 0 leads or sales, an icon appears next to that number.
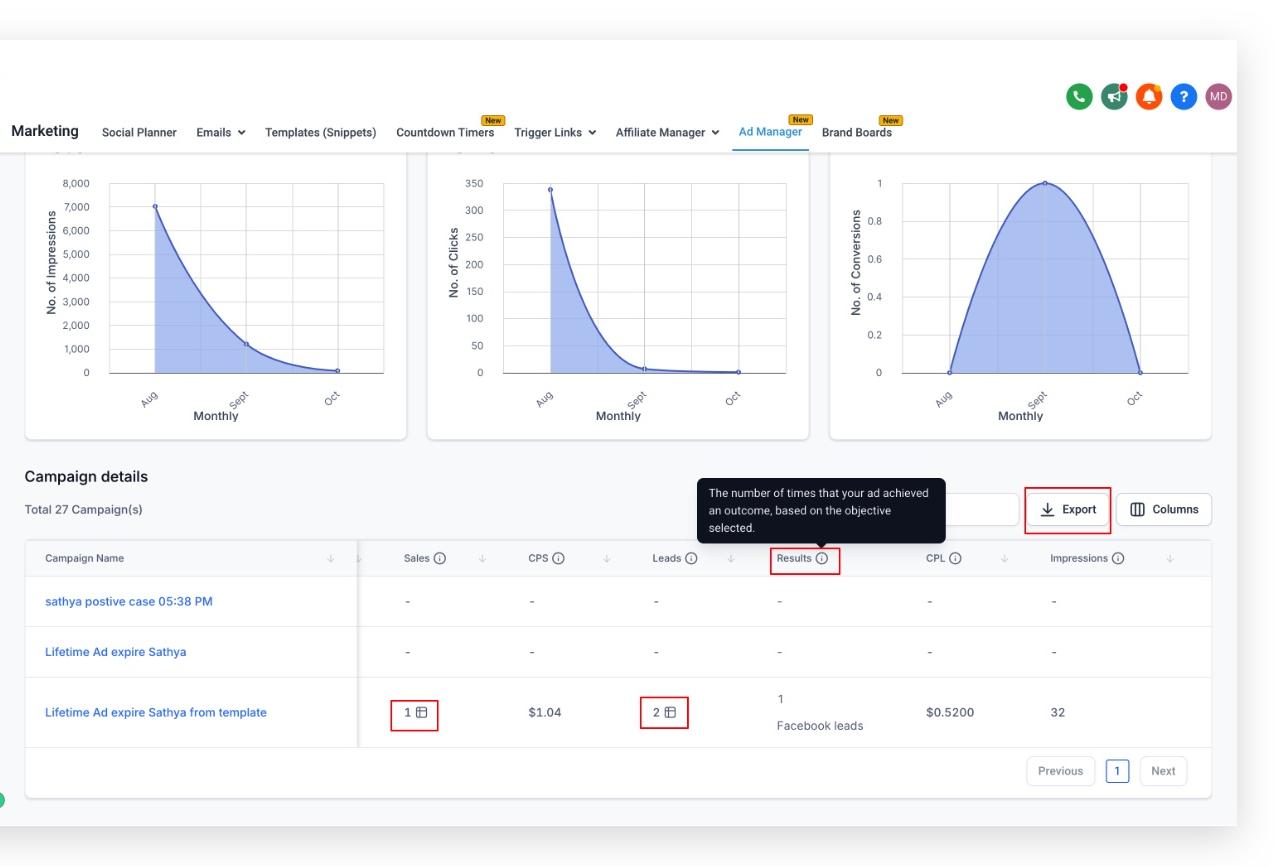
Click the leads or sales icon to open a modal showing the Leads and Opportunities Closed details for that campaign.
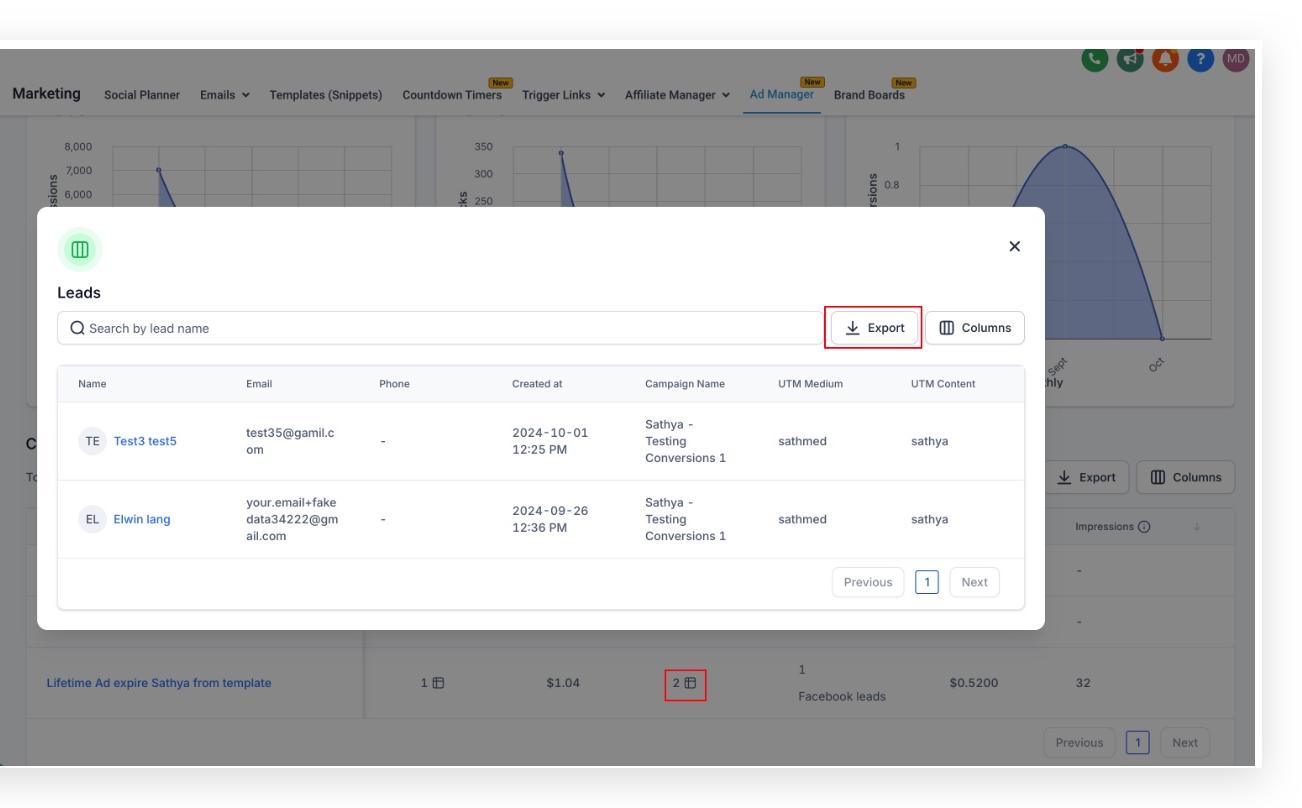
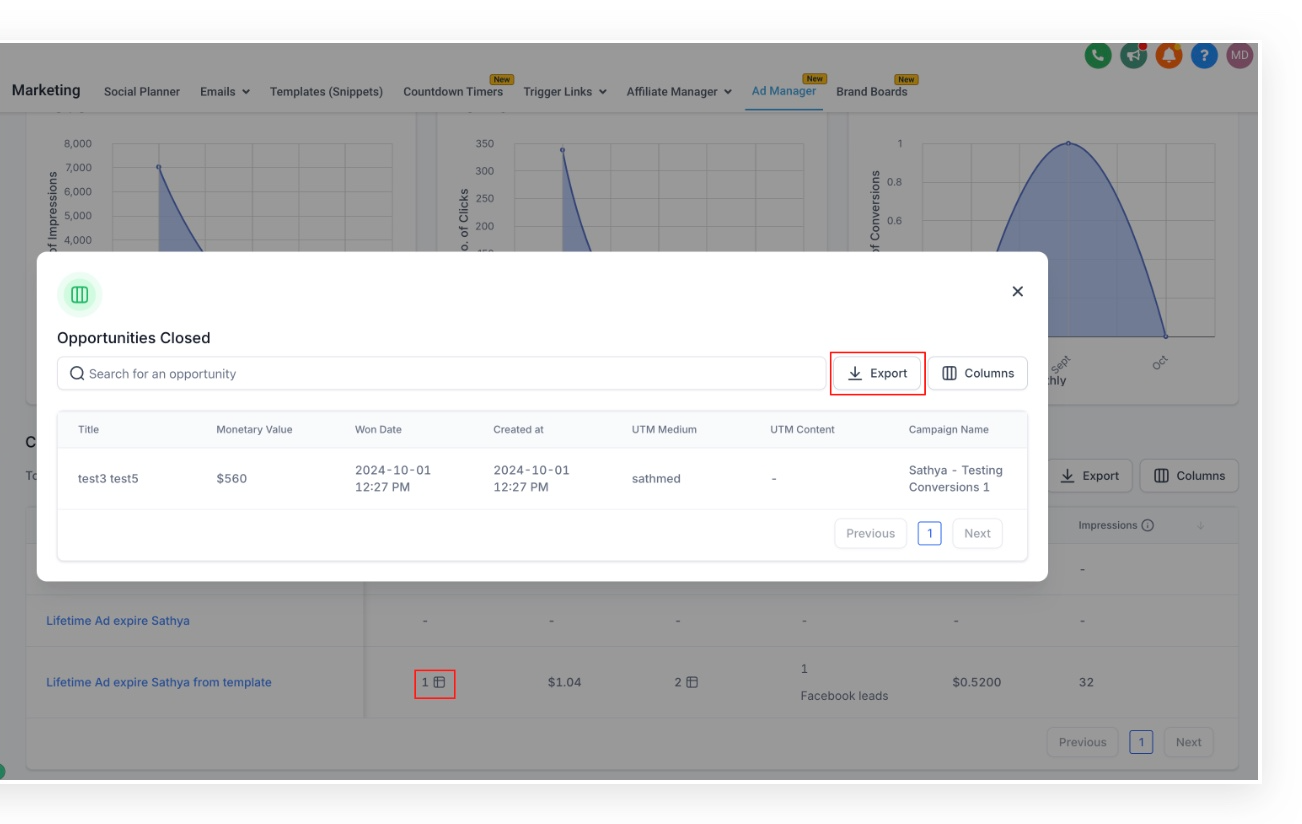
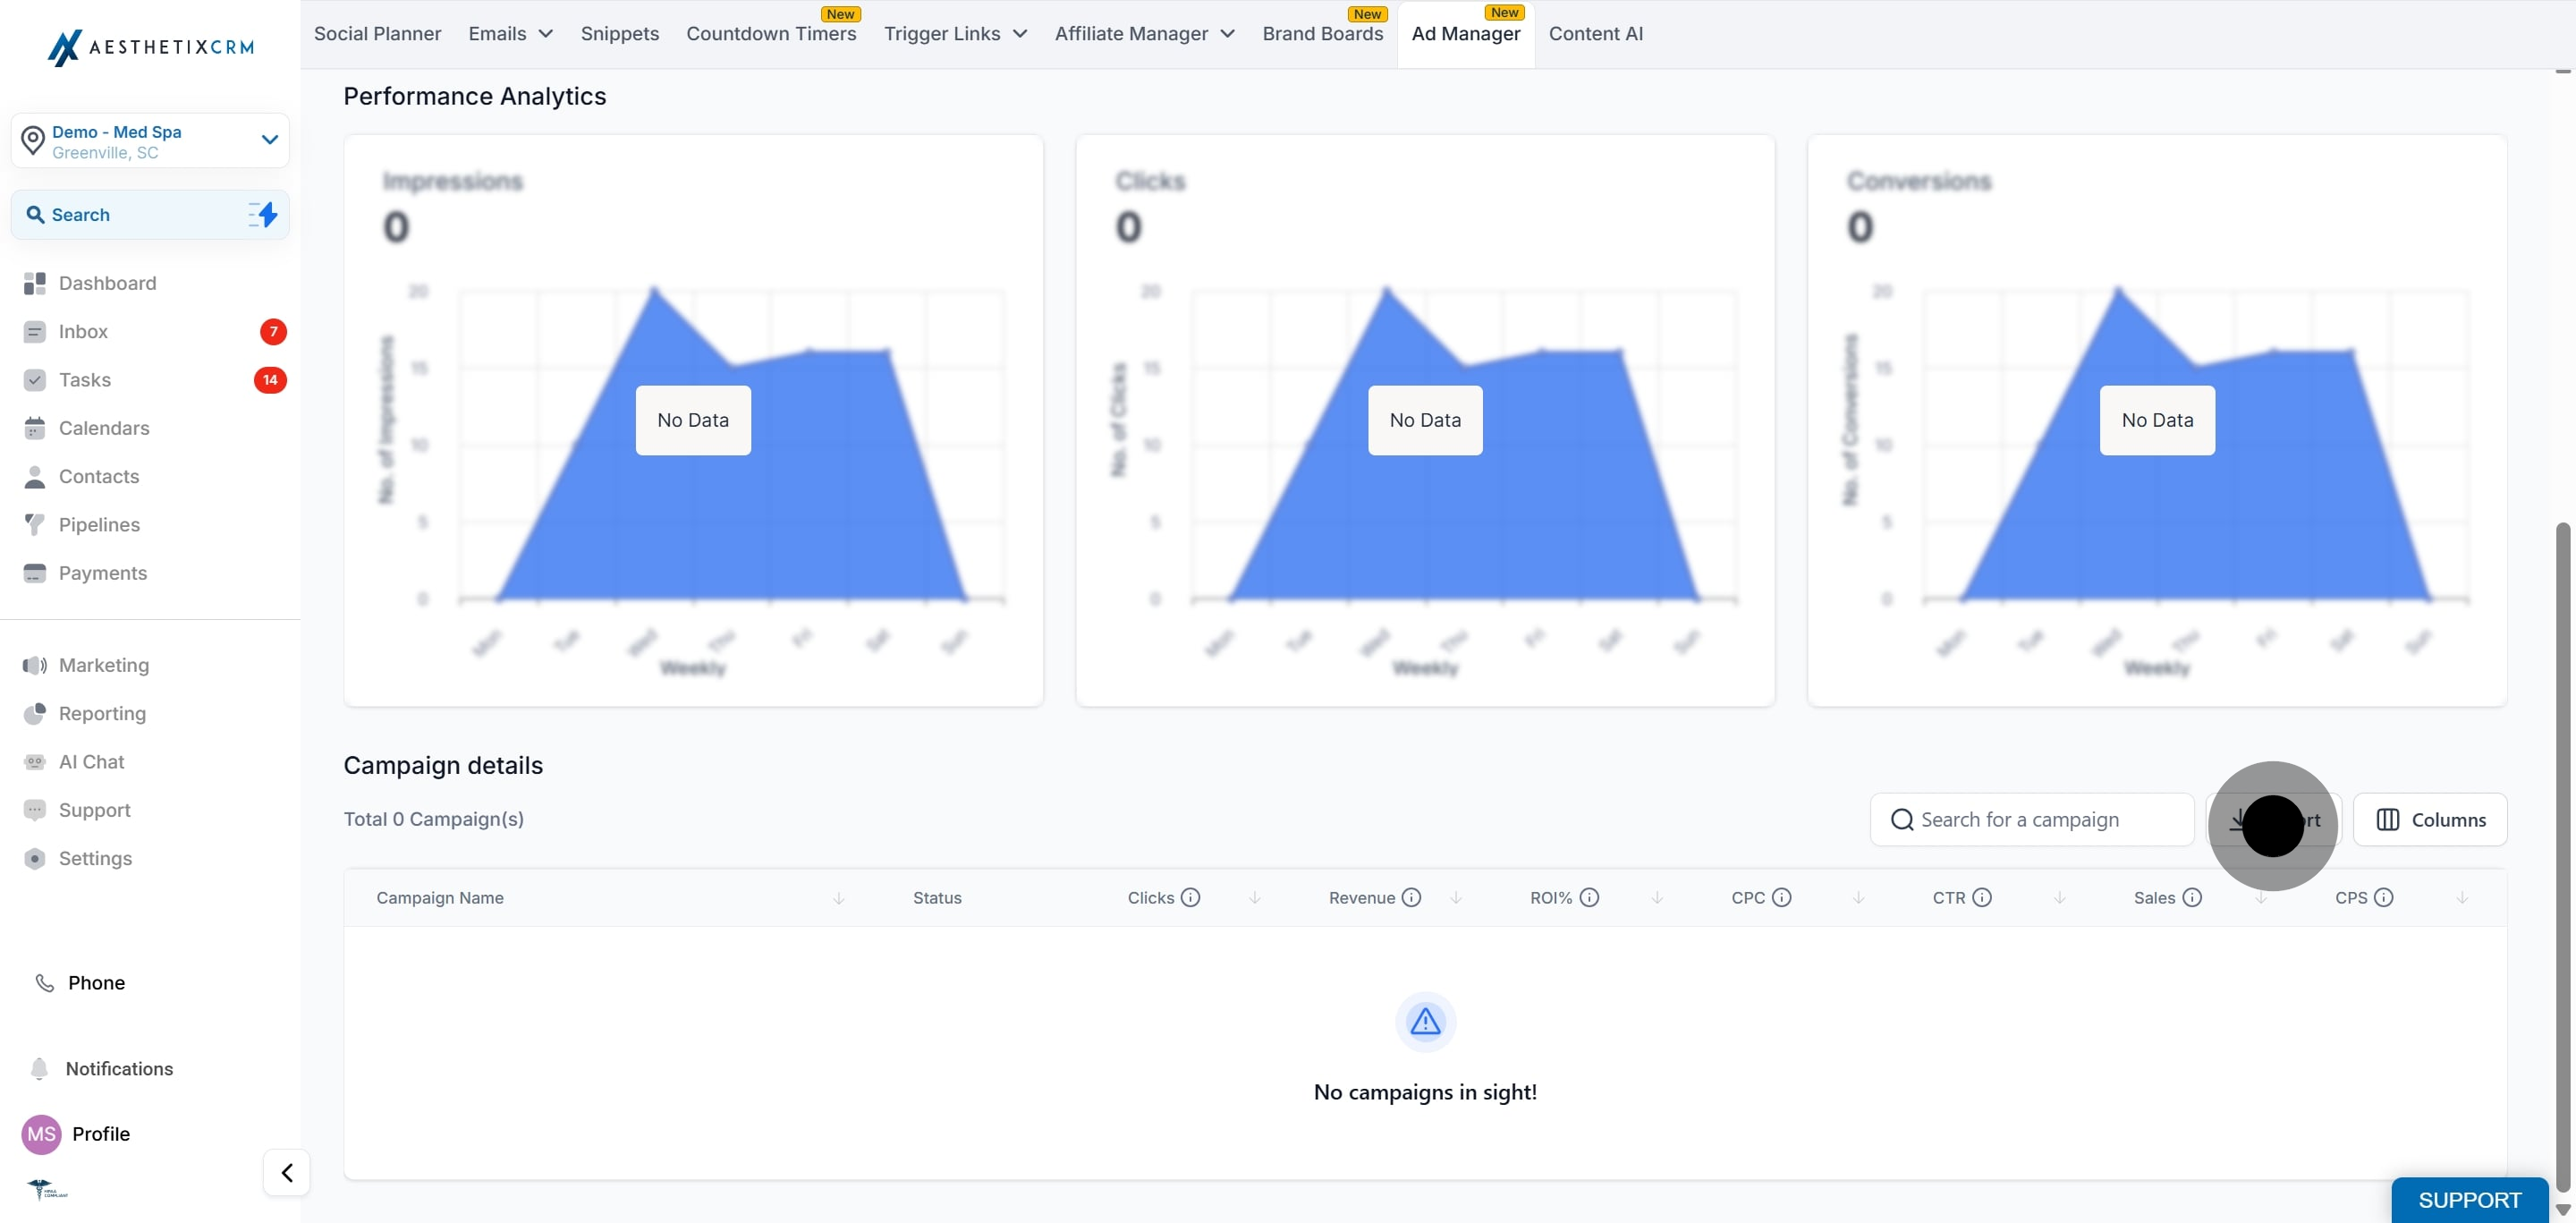
You can export both the leads and the opportunities closed data as a .csv file using the Export button. Export is available on both the all-campaigns table and the individual campaign table so you can download the metrics you need.
For cross-channel dashboards that combine ad performance with your other marketing, see the Reporting collection.
Each campaign's performance is shown across several columns. Here is what each one means:
Clicks: The total number of times users have clicked your ad. Helps gauge interest in your offer.
Revenue: The total income generated from the campaign, often from sales or conversions attributed to the ad.
ROI%: Return on Investment, a percentage measuring the return on your ad spend.
CPC: Cost per Click, the average amount you pay for each click.
CTR: Click-Through-Rate, the percentage of people who clicked your ad after seeing it.
Sales: The total number of purchases resulting from the campaign. Directly tied to the success of sales-focused campaigns.
CPS: Cost per Sale, the average cost for each sale, calculated by dividing total spend by the number of sales.
Leads: The number of potential patients who showed interest, typically by submitting their contact information.
Results: The number of times your ad achieved an outcome, based on the objective you selected.
CPL: Cost per Lead, the average cost of acquiring a lead.
Impressions: The total number of times your ad was displayed, whether or not it was clicked.
Spend: The total amount spent on the campaign, including all costs to run the ads.
Reach: The number of unique users who saw your ad at least once.
Frequency: How often your ad was shown to each unique user, calculated as Impressions divided by Reach.
Before a campaign goes live, Ad Manager offers a related readiness check called Opportunity Score. It reviews your campaign setup on the Review screen and flags areas worth a second look before you publish, so you start collecting the statistics above from a stronger starting point.
Opportunity Score is available for Meta, Google, and LinkedIn campaigns. It evaluates only the settings that apply to the platform, objective, campaign type, and ad format you selected, so two campaigns can show different recommendation categories even when they are built on the same day.
Opening the Opportunity Score area on the Review screen gives you a 0 to 100 score, a band label such as Low, Medium, or High, and category cards for the setup areas that apply to your campaign:
Audience: targeting that may be too broad, too narrow, or missing key details.
Budget: a daily or lifetime budget that may limit delivery.
Creative: ad copy, media, headlines, and destination links.
Tracking: conversion and event tracking configuration.
Keywords: shown for applicable Google campaigns, covering keyword selection, match types, and negative keywords.
A lower score does not stop you from publishing. It means there are recommended areas worth reviewing first, prioritized under a "What to fix first" list so you can focus on the updates most likely to matter.
Open Marketing, then Ad Manager, and start a new campaign or open a draft that has not been published yet.
Fill out the campaign details, such as audience, budget, creative, tracking, and any platform-specific fields, before checking the score.
On the Review screen, click the Opportunity Score area to open the score panel.
Look through the category cards and the "What to fix first" list to see which updates may have the biggest impact on readiness.
Click a recommendation to jump back to the related section of the campaign builder, apply any change you agree with, then return to the Review screen to see the updated score.
Publish the campaign once you are satisfied with your review.
Opportunity Score is guidance, not an automatic edit. It does not predict or guarantee delivery, conversions, revenue, or performance. Once a campaign is published, use the Statistics tab described above to measure its actual results.
What key metrics can I track in Ad Manager?
You can track metrics such as impressions, clicks, conversions, click-through rate (CTR), cost per click (CPC), and return on ad spend, among others.
How often are campaign statistics updated?
Campaign statistics are updated in real time, so you can monitor performance and make adjustments as needed.
Can I filter statistics by specific time periods?
Yes. You can filter by custom date ranges to analyze performance over a specific period, both across all campaigns and for an individual campaign.
Can I filter by platform and page?
Yes. Use the platform filter to choose Google or Facebook. For Facebook you also get a page selector to narrow to campaigns on specific pages.
Can I customize which metrics appear?
Yes. Both the all-campaigns table and the individual campaign table let you choose which metric columns to display.
What should I do if performance is below expectations?
Consider adjusting your targeting, reviewing your ad creative, or testing different formats. Use the statistics to identify where to improve.
How can I compare multiple campaigns?
Use the Statistics table to view key metrics for your campaigns side by side, then drill into individual campaigns for detail.
Can I export campaign statistics?
Yes. Click Export to download campaign metrics, including leads and opportunities closed, as a .csv file for further analysis or reporting.
What if I notice discrepancies in the data?
First check your filter settings, such as platform, page, and date range. If issues persist, contact our support team for help troubleshooting.
Does Opportunity Score keep me from publishing a campaign?
No. A lower score does not block publishing. It flags recommended areas to review, and whether to make any change is up to you.
Is Opportunity Score available for every campaign type?
Opportunity Score is available for Meta, Google, and LinkedIn campaigns. It evaluates only the settings relevant to the platform, objective, and format you selected, so the categories shown can vary between campaigns.
