Social Planner Analytics gives your practice a consolidated view of social performance across every connected platform, so you can evaluate posting volume, visibility, and engagement in one place. Use these insights to see which content resonates with prospective patients, compare platforms side by side, and refine your posting strategy with confidence. Advanced Analytics supports Facebook, Instagram, LinkedIn, YouTube, Pinterest, TikTok, Google Business Profile (GBP), Threads, and Bluesky, and the available metrics vary by platform.
Comprehensive social media insights: Track the number of posts, likes, comments, followers, impressions, and reach across many platforms from a single dashboard.
Visualize your social post performance: Interactive graphs show post trends and weekly performance.
Engagement breakdown: Get a detailed view of engagement metrics such as total likes, comments, and shares, broken down per platform.
Platform comparisons: Identify which platform drives more engagement so you can tailor your content strategy accordingly.
Impressions and post reach: Measure your content's visibility with reach and impressions tracking.
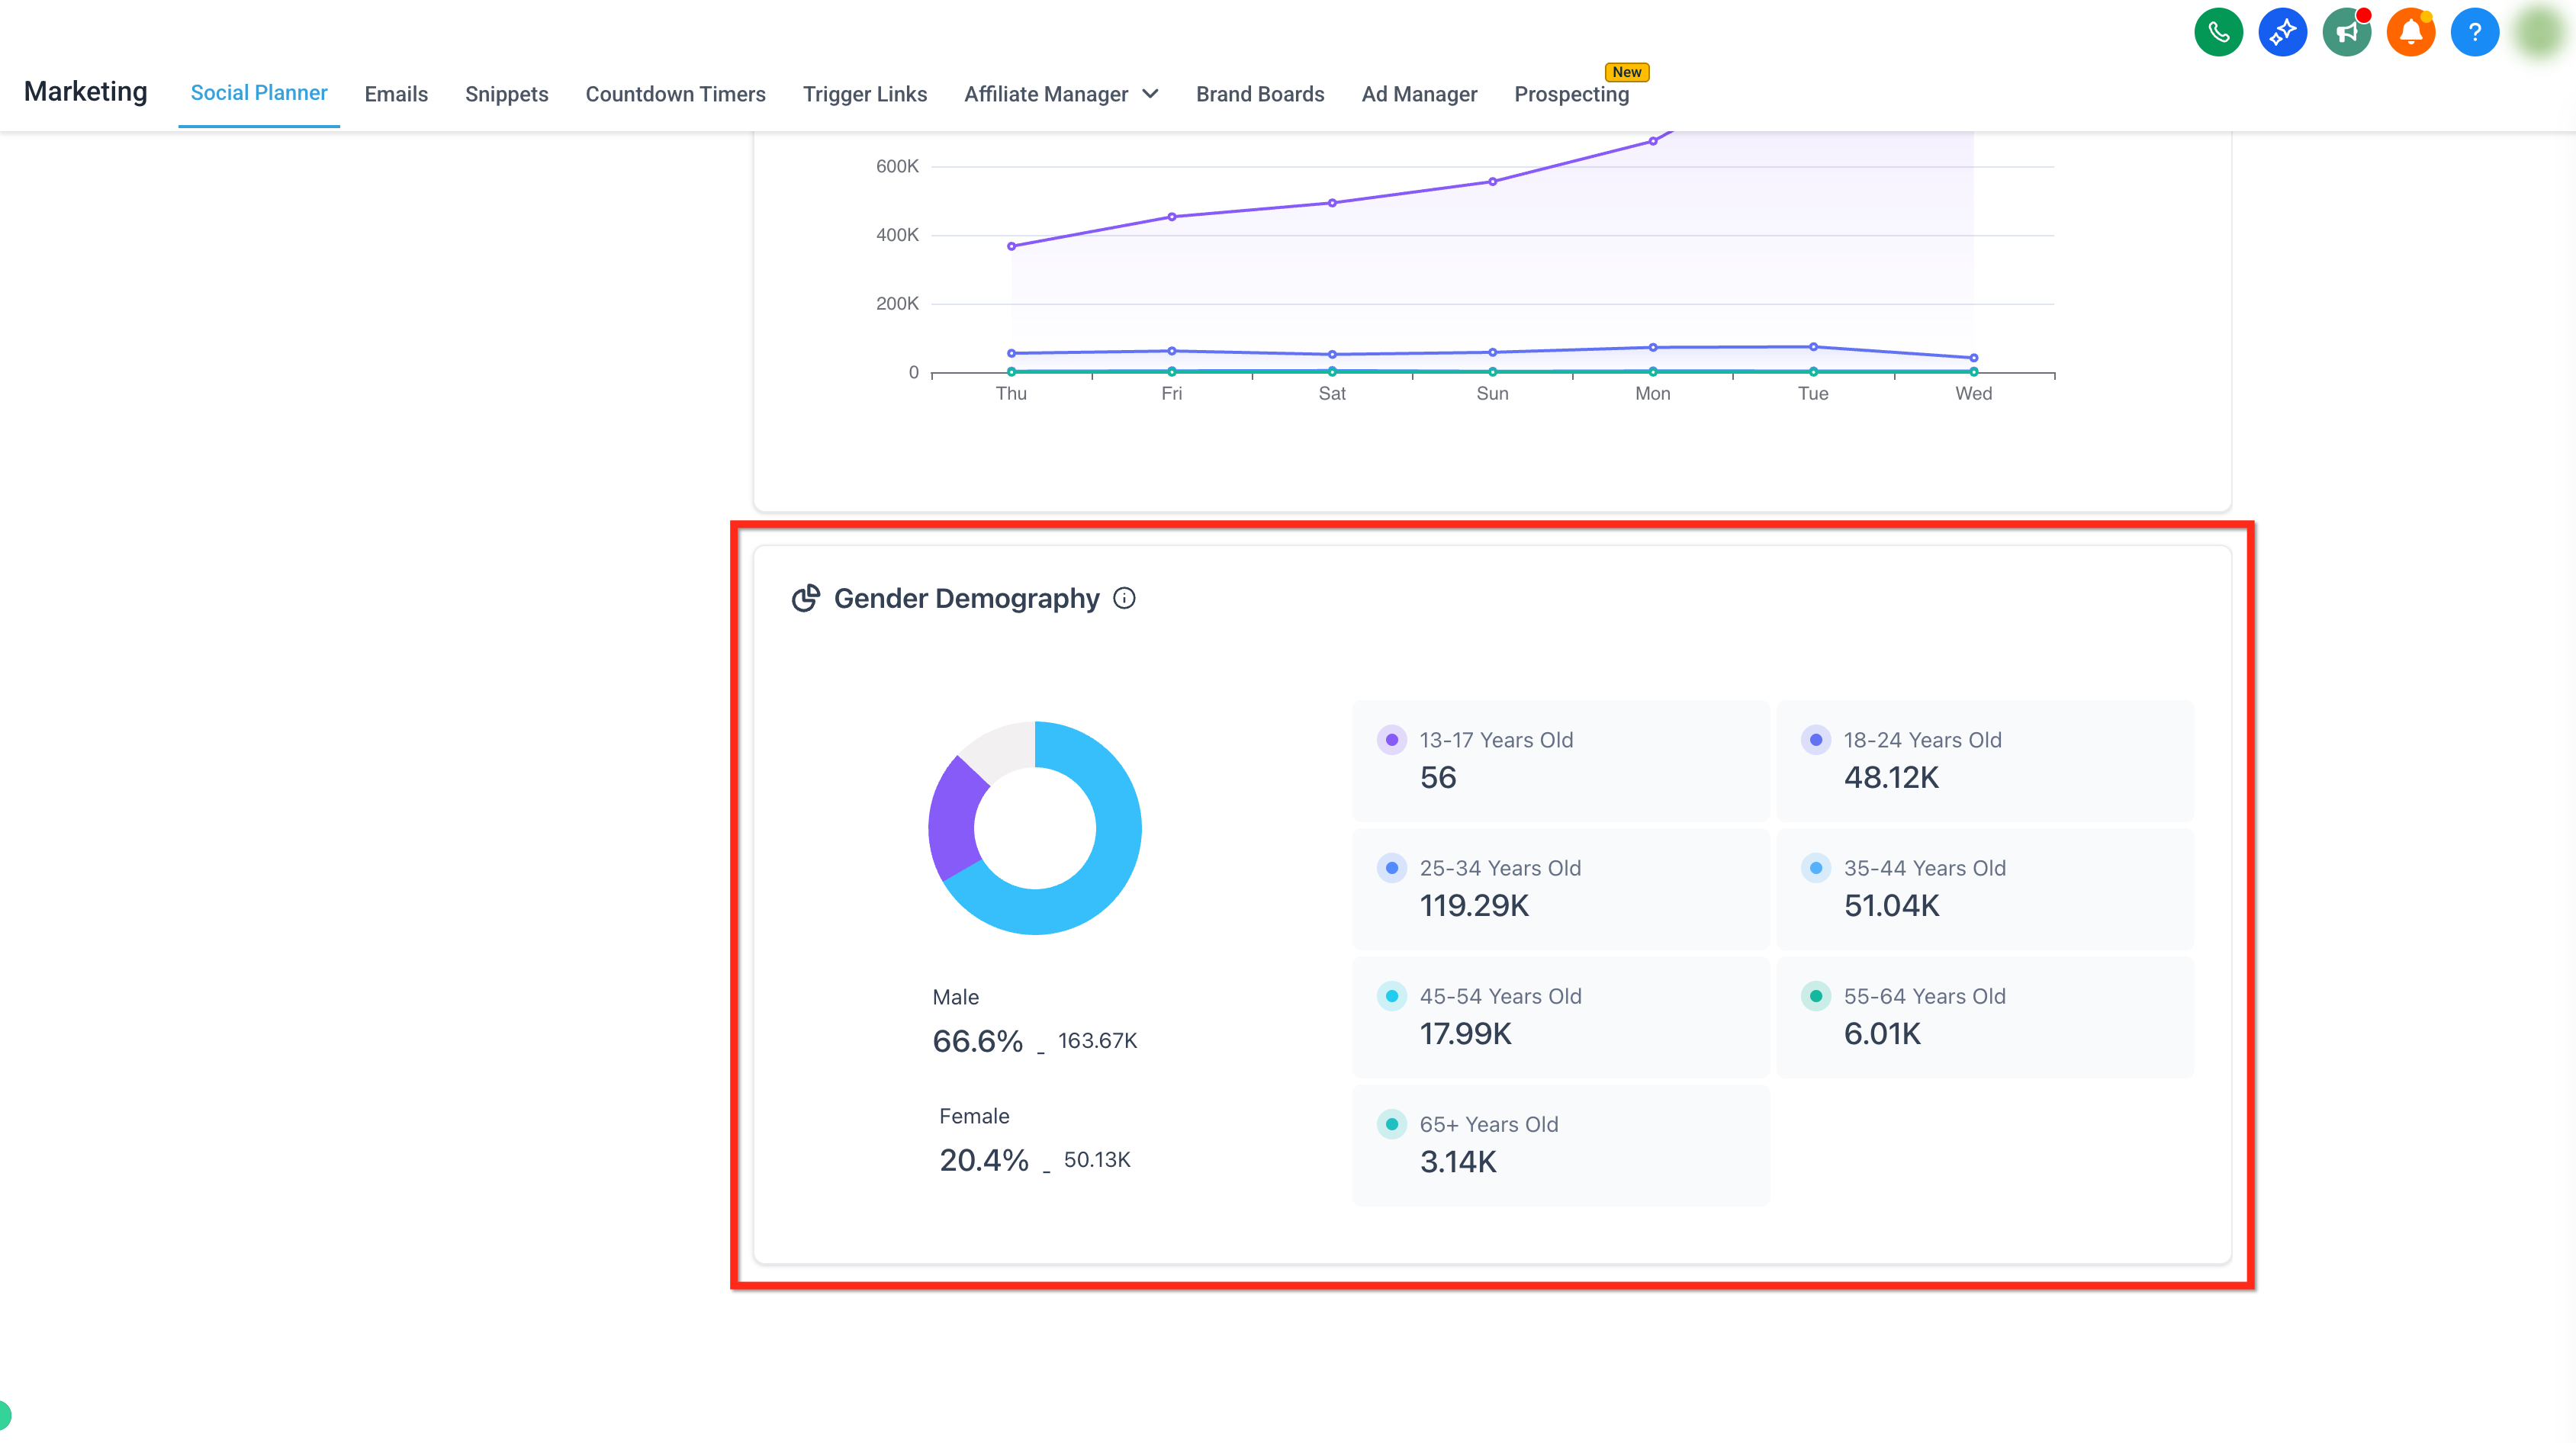
Gender and age demographics: See your audience breakdown by age group and gender to optimize content for the right patients.
Permissions and reauthentication alerts: Receive real-time alerts when a connected account requires re-authentication to access analytics, so insights keep flowing without interruption. Statistics appear from the next day, or as soon as you reconnect the account with upgraded permissions.
To open the analytics dashboard, go to Marketing > Social Planner > Statistics.
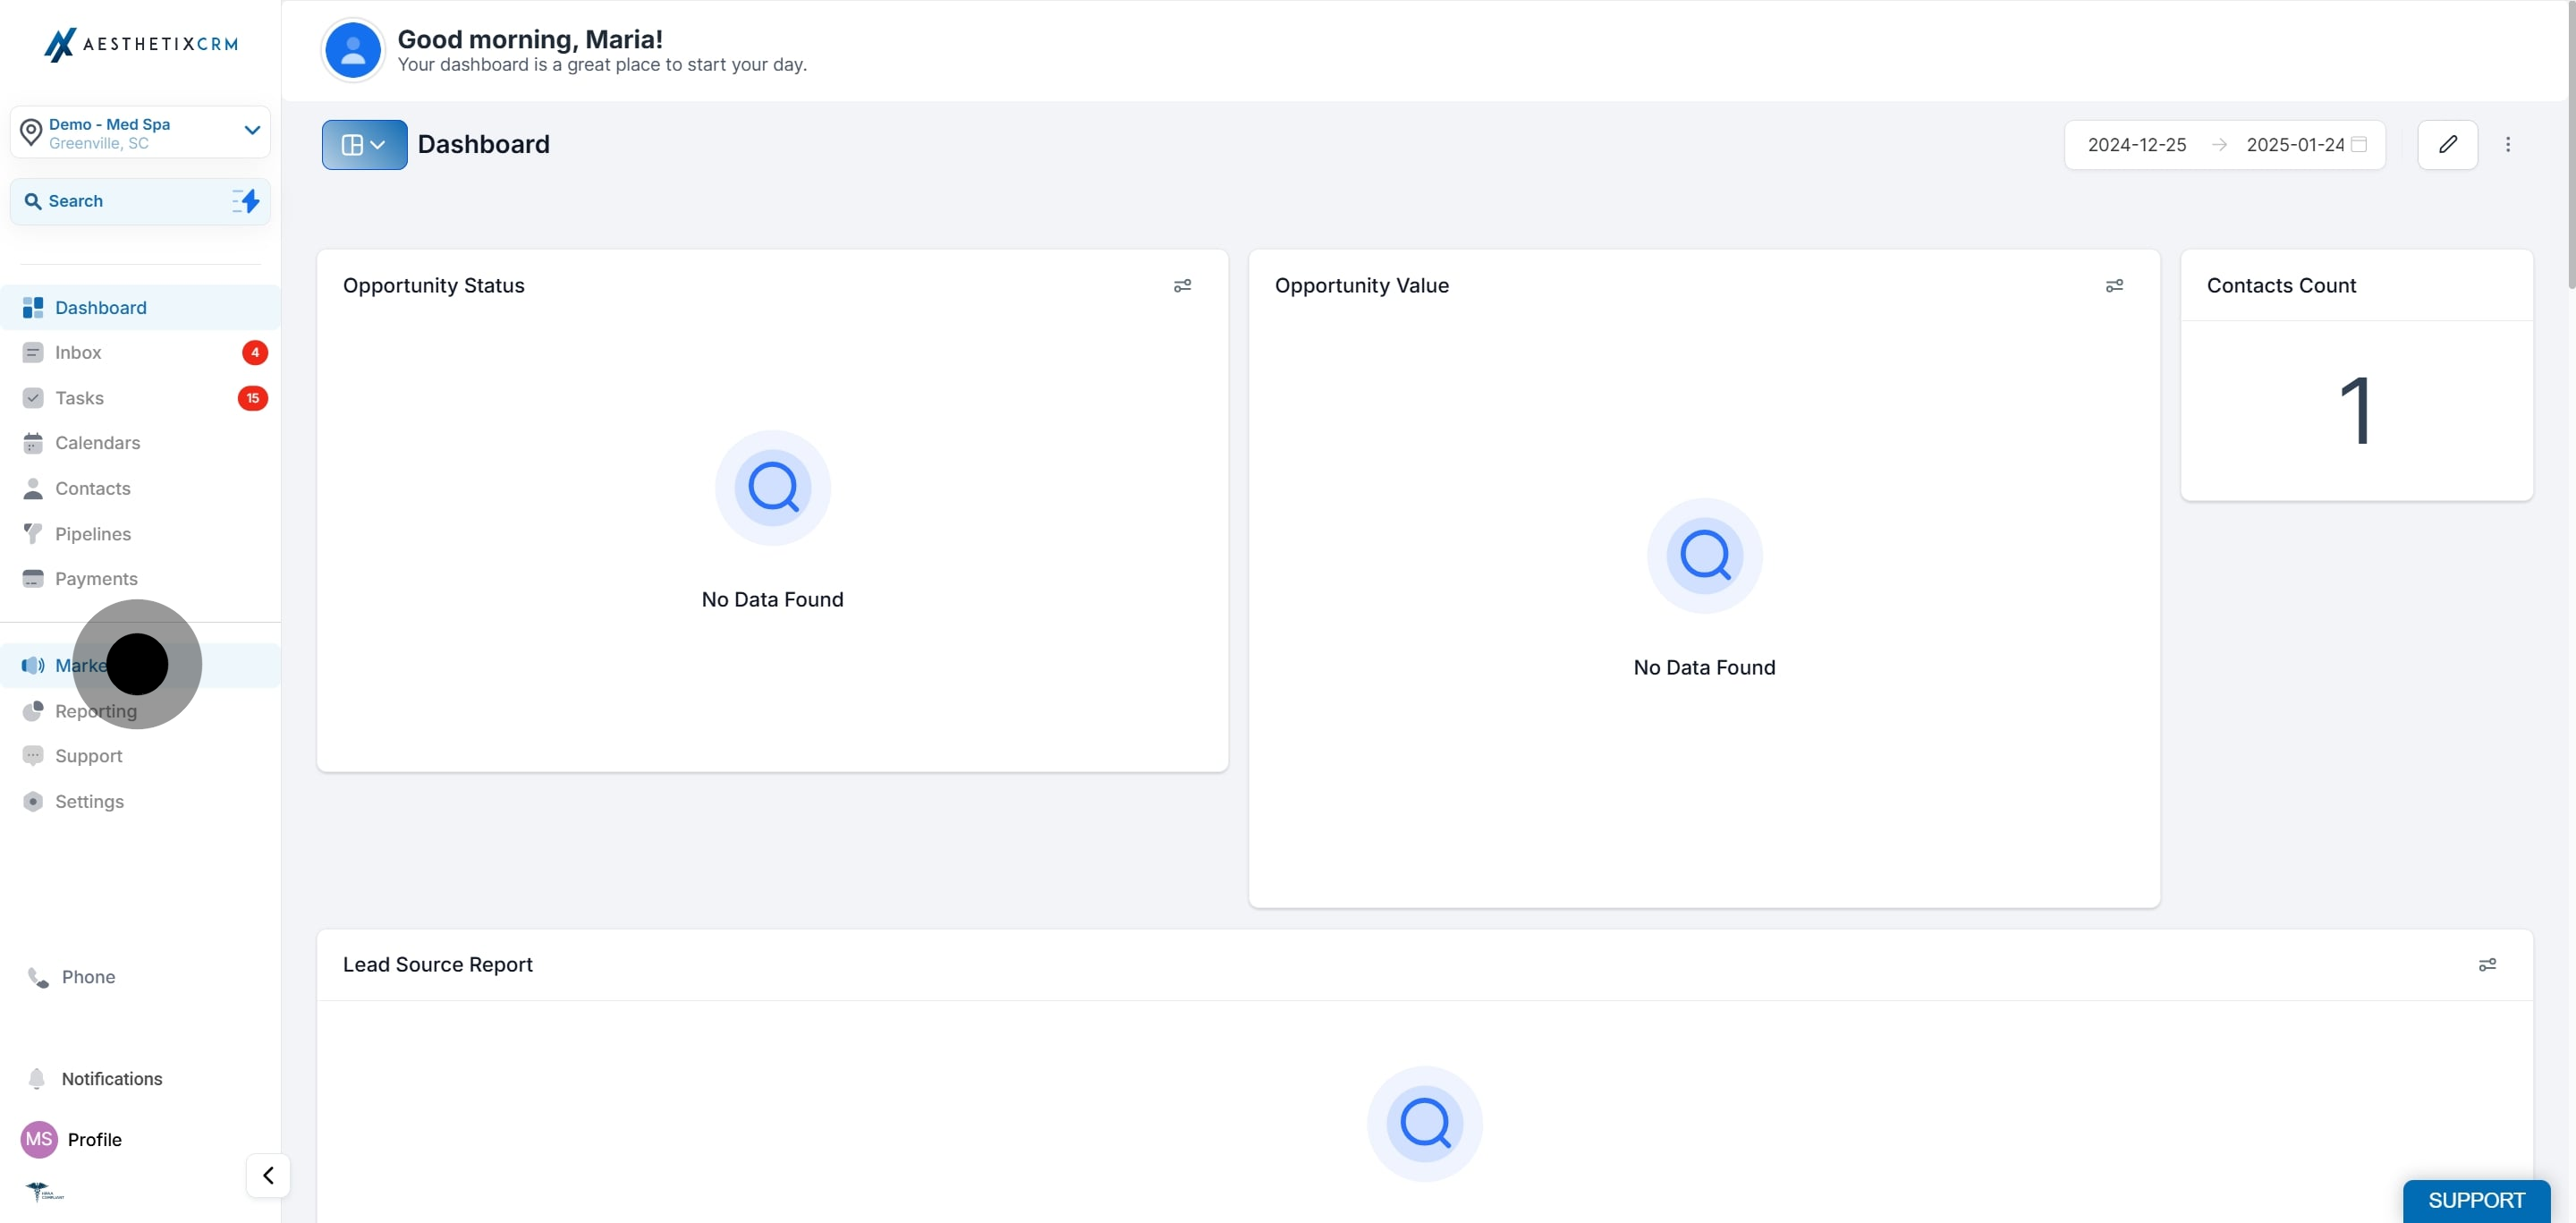
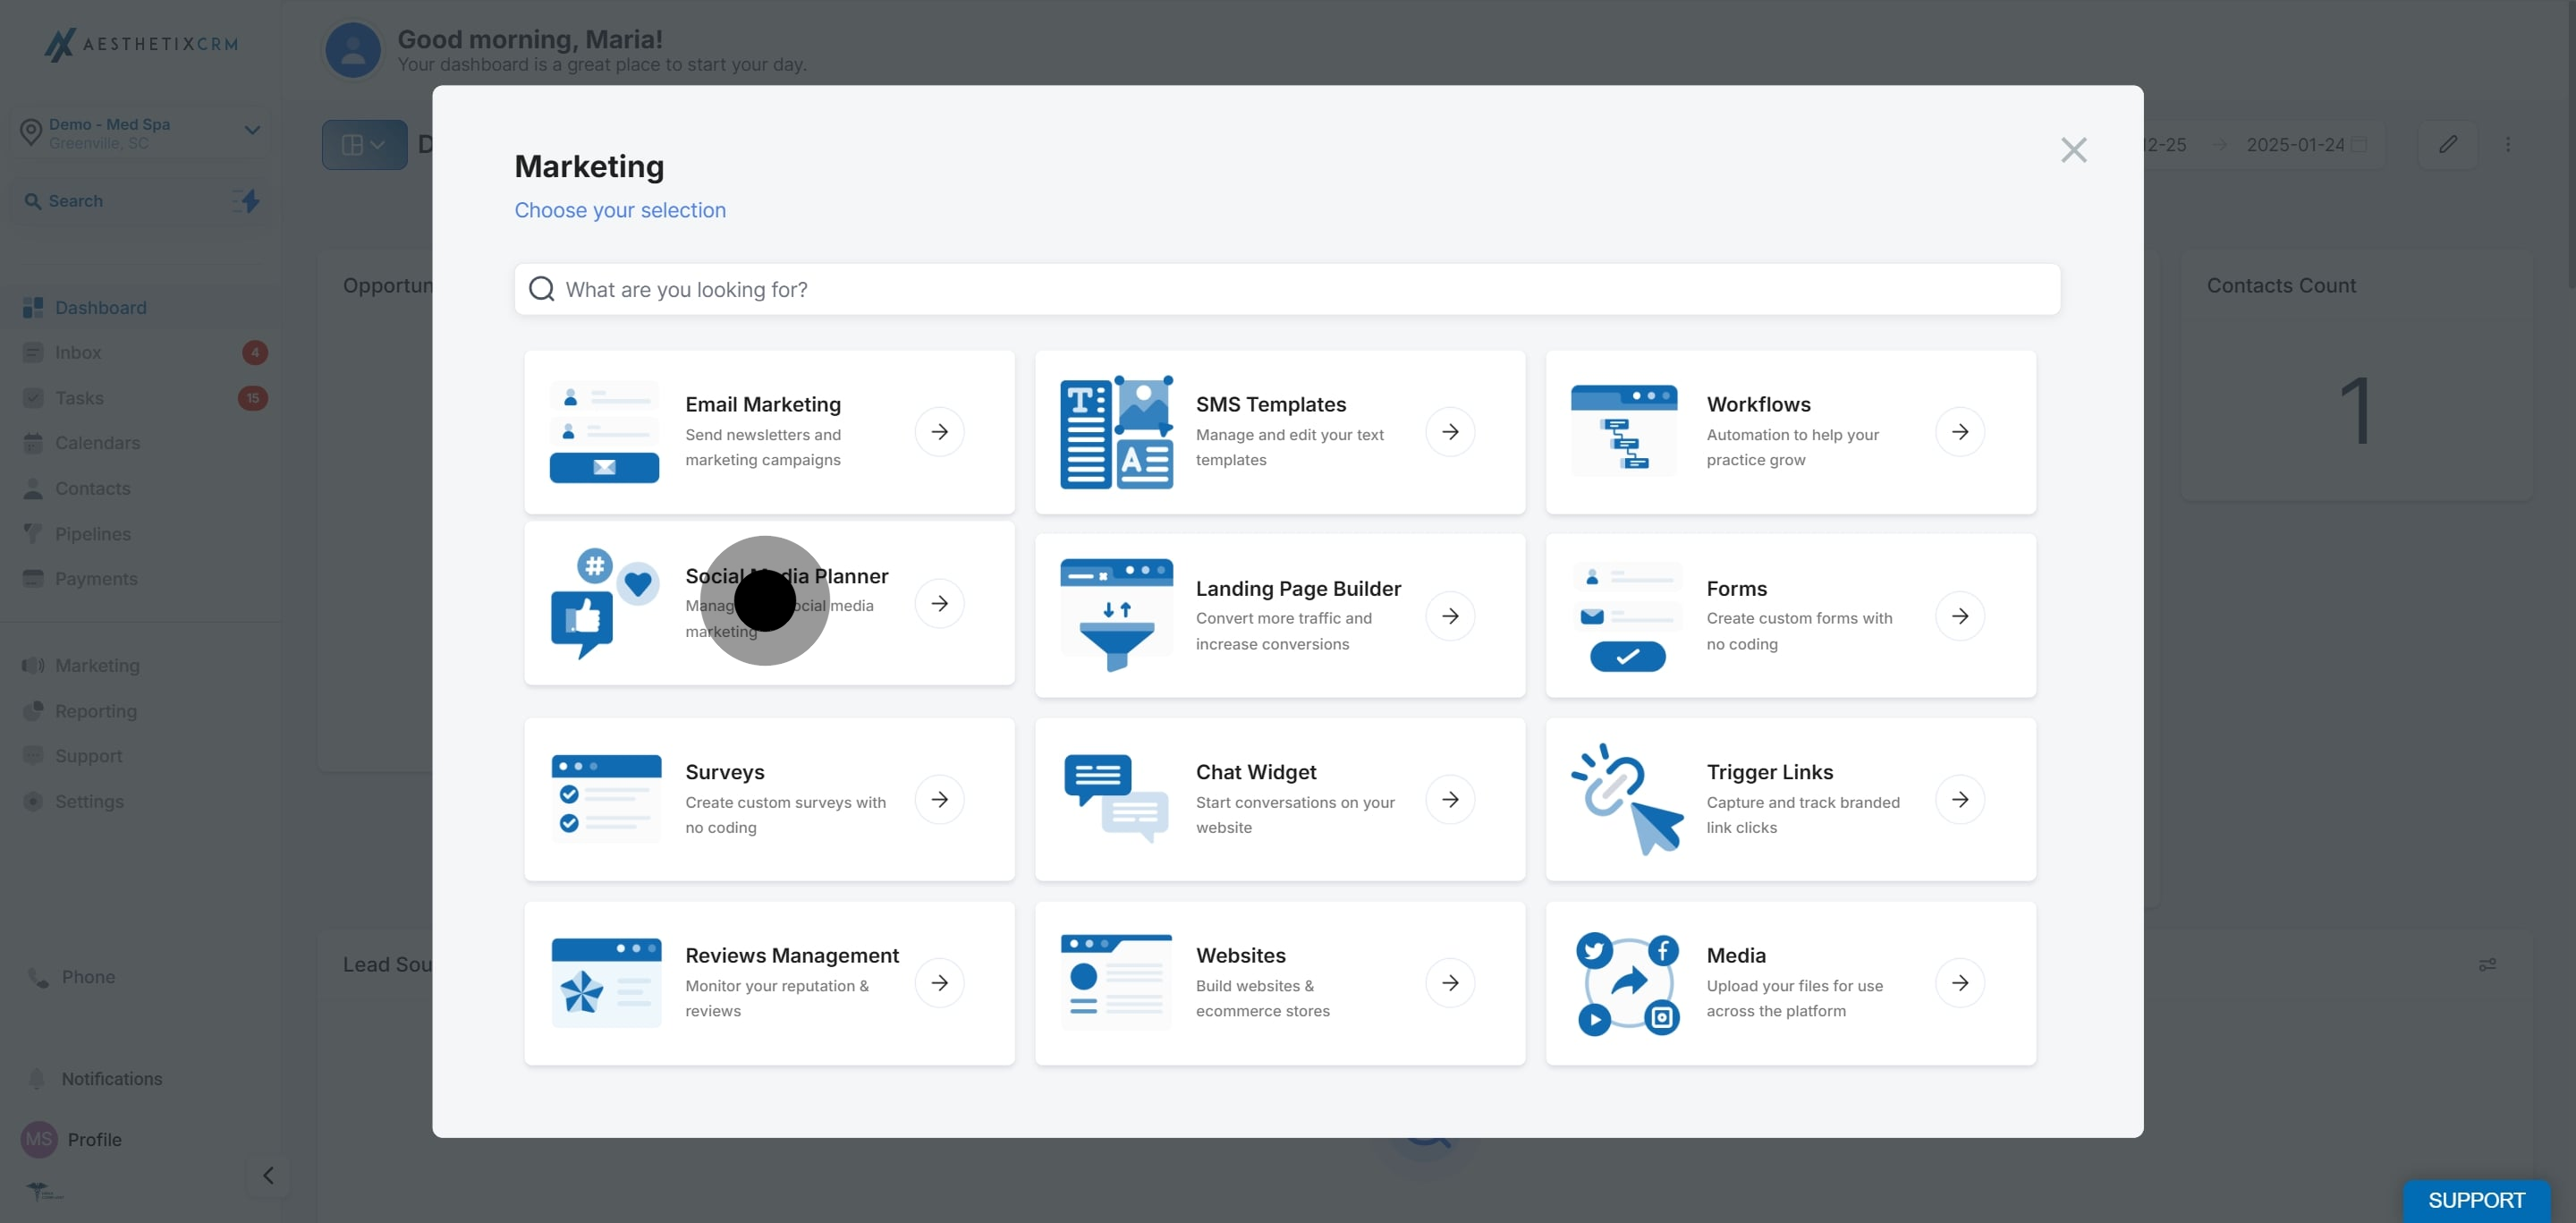
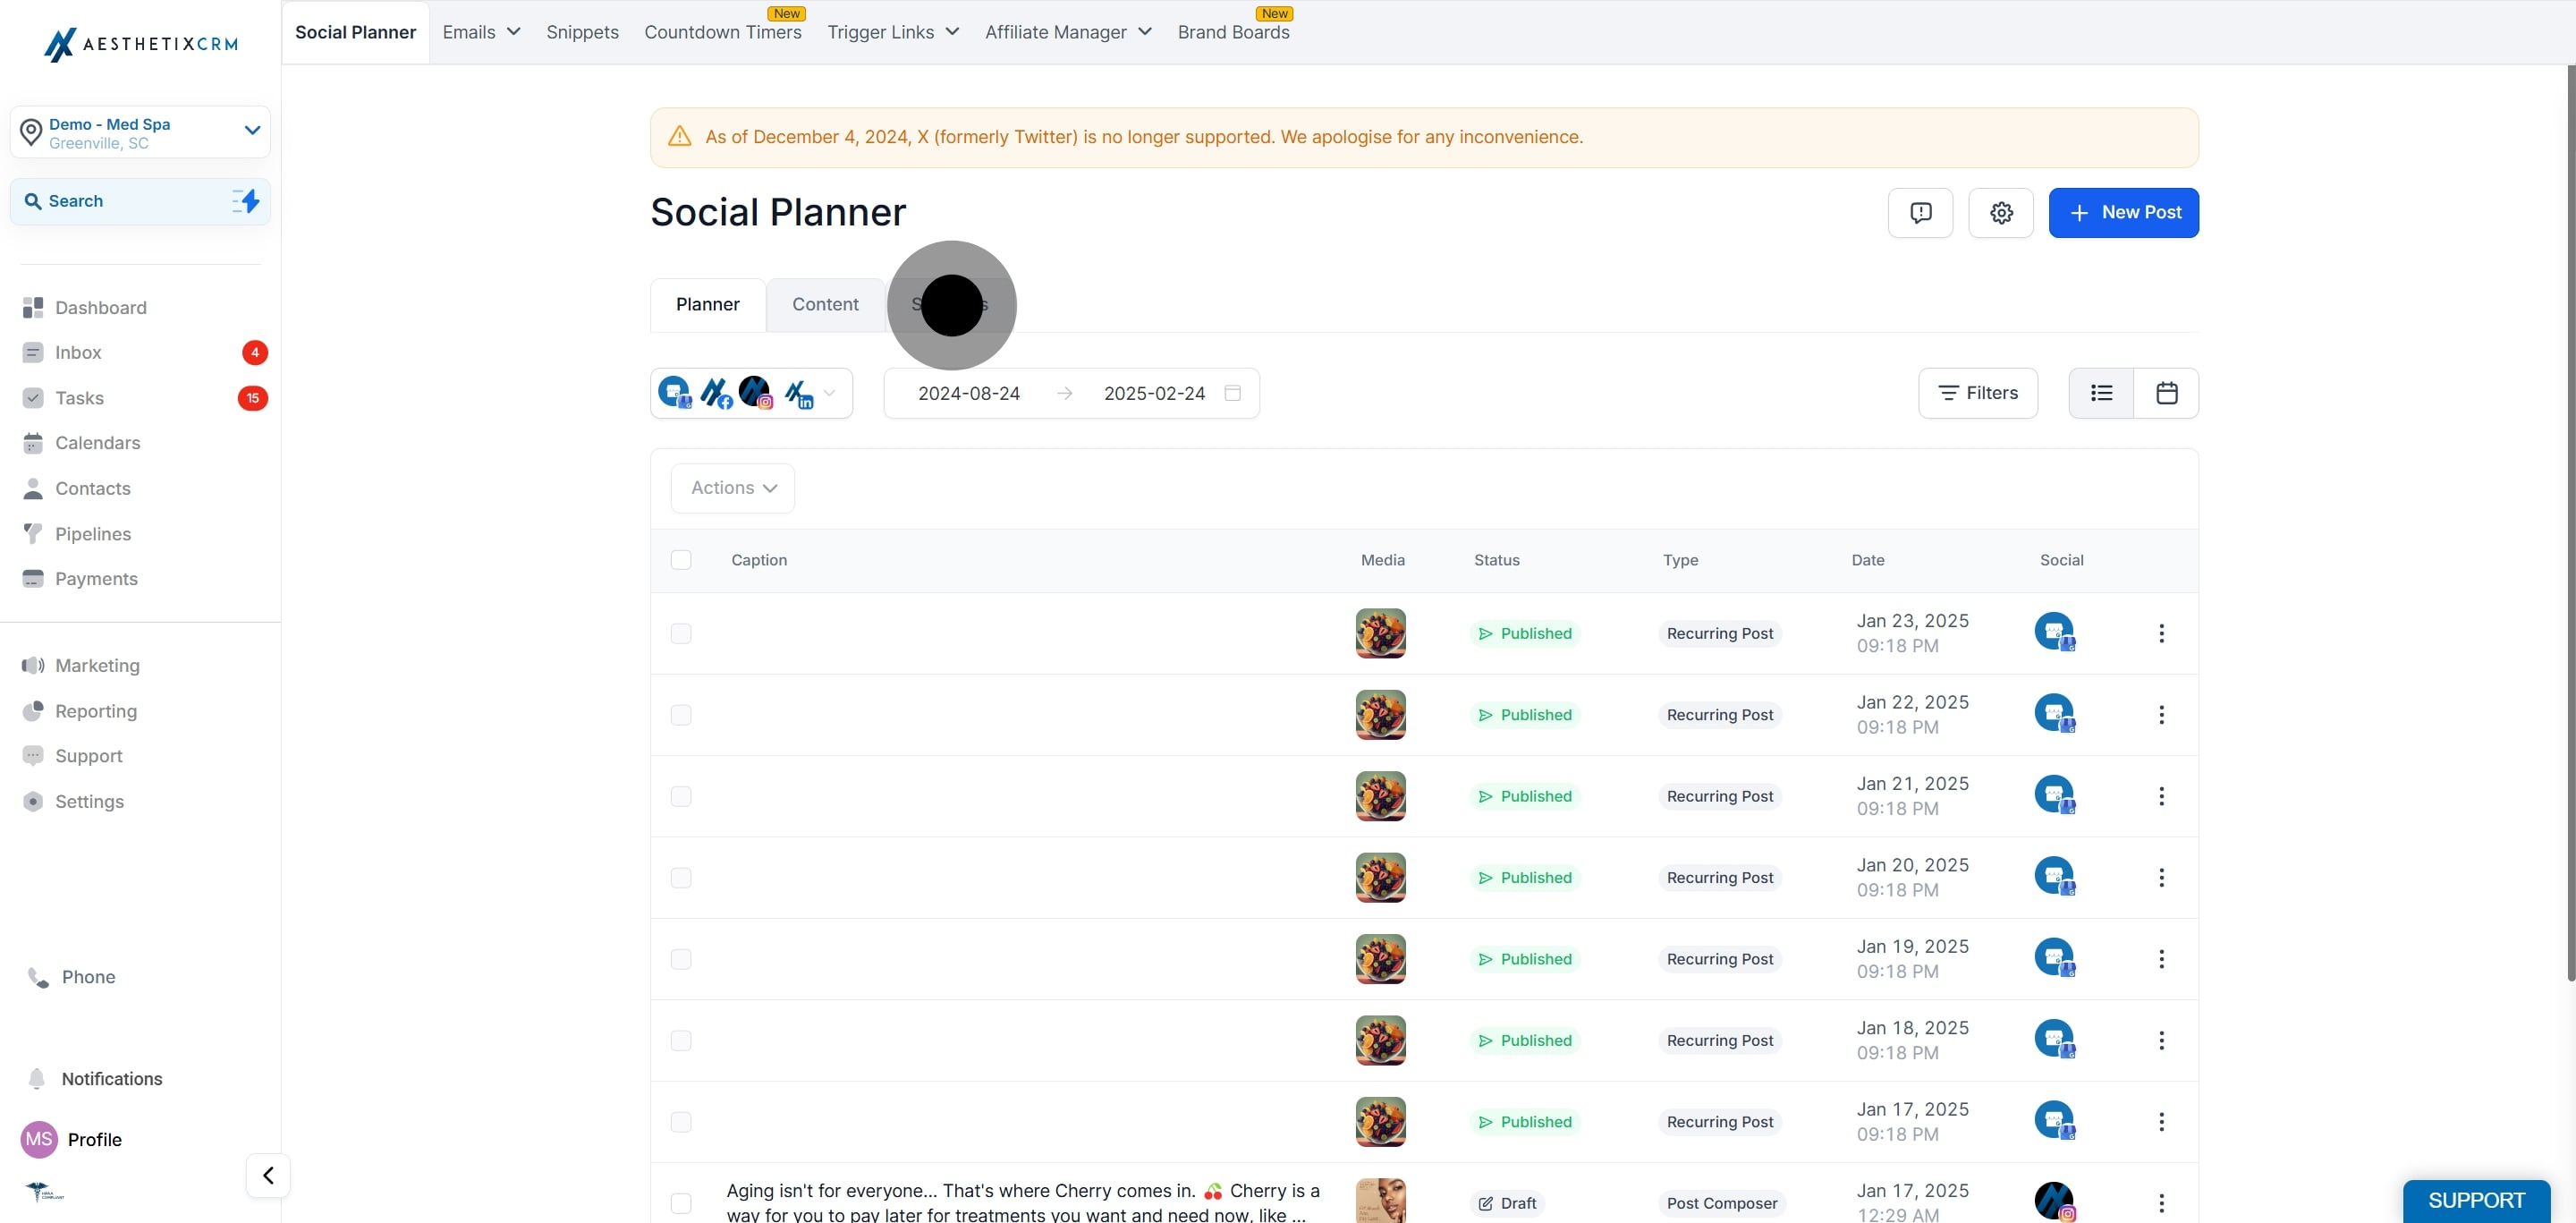
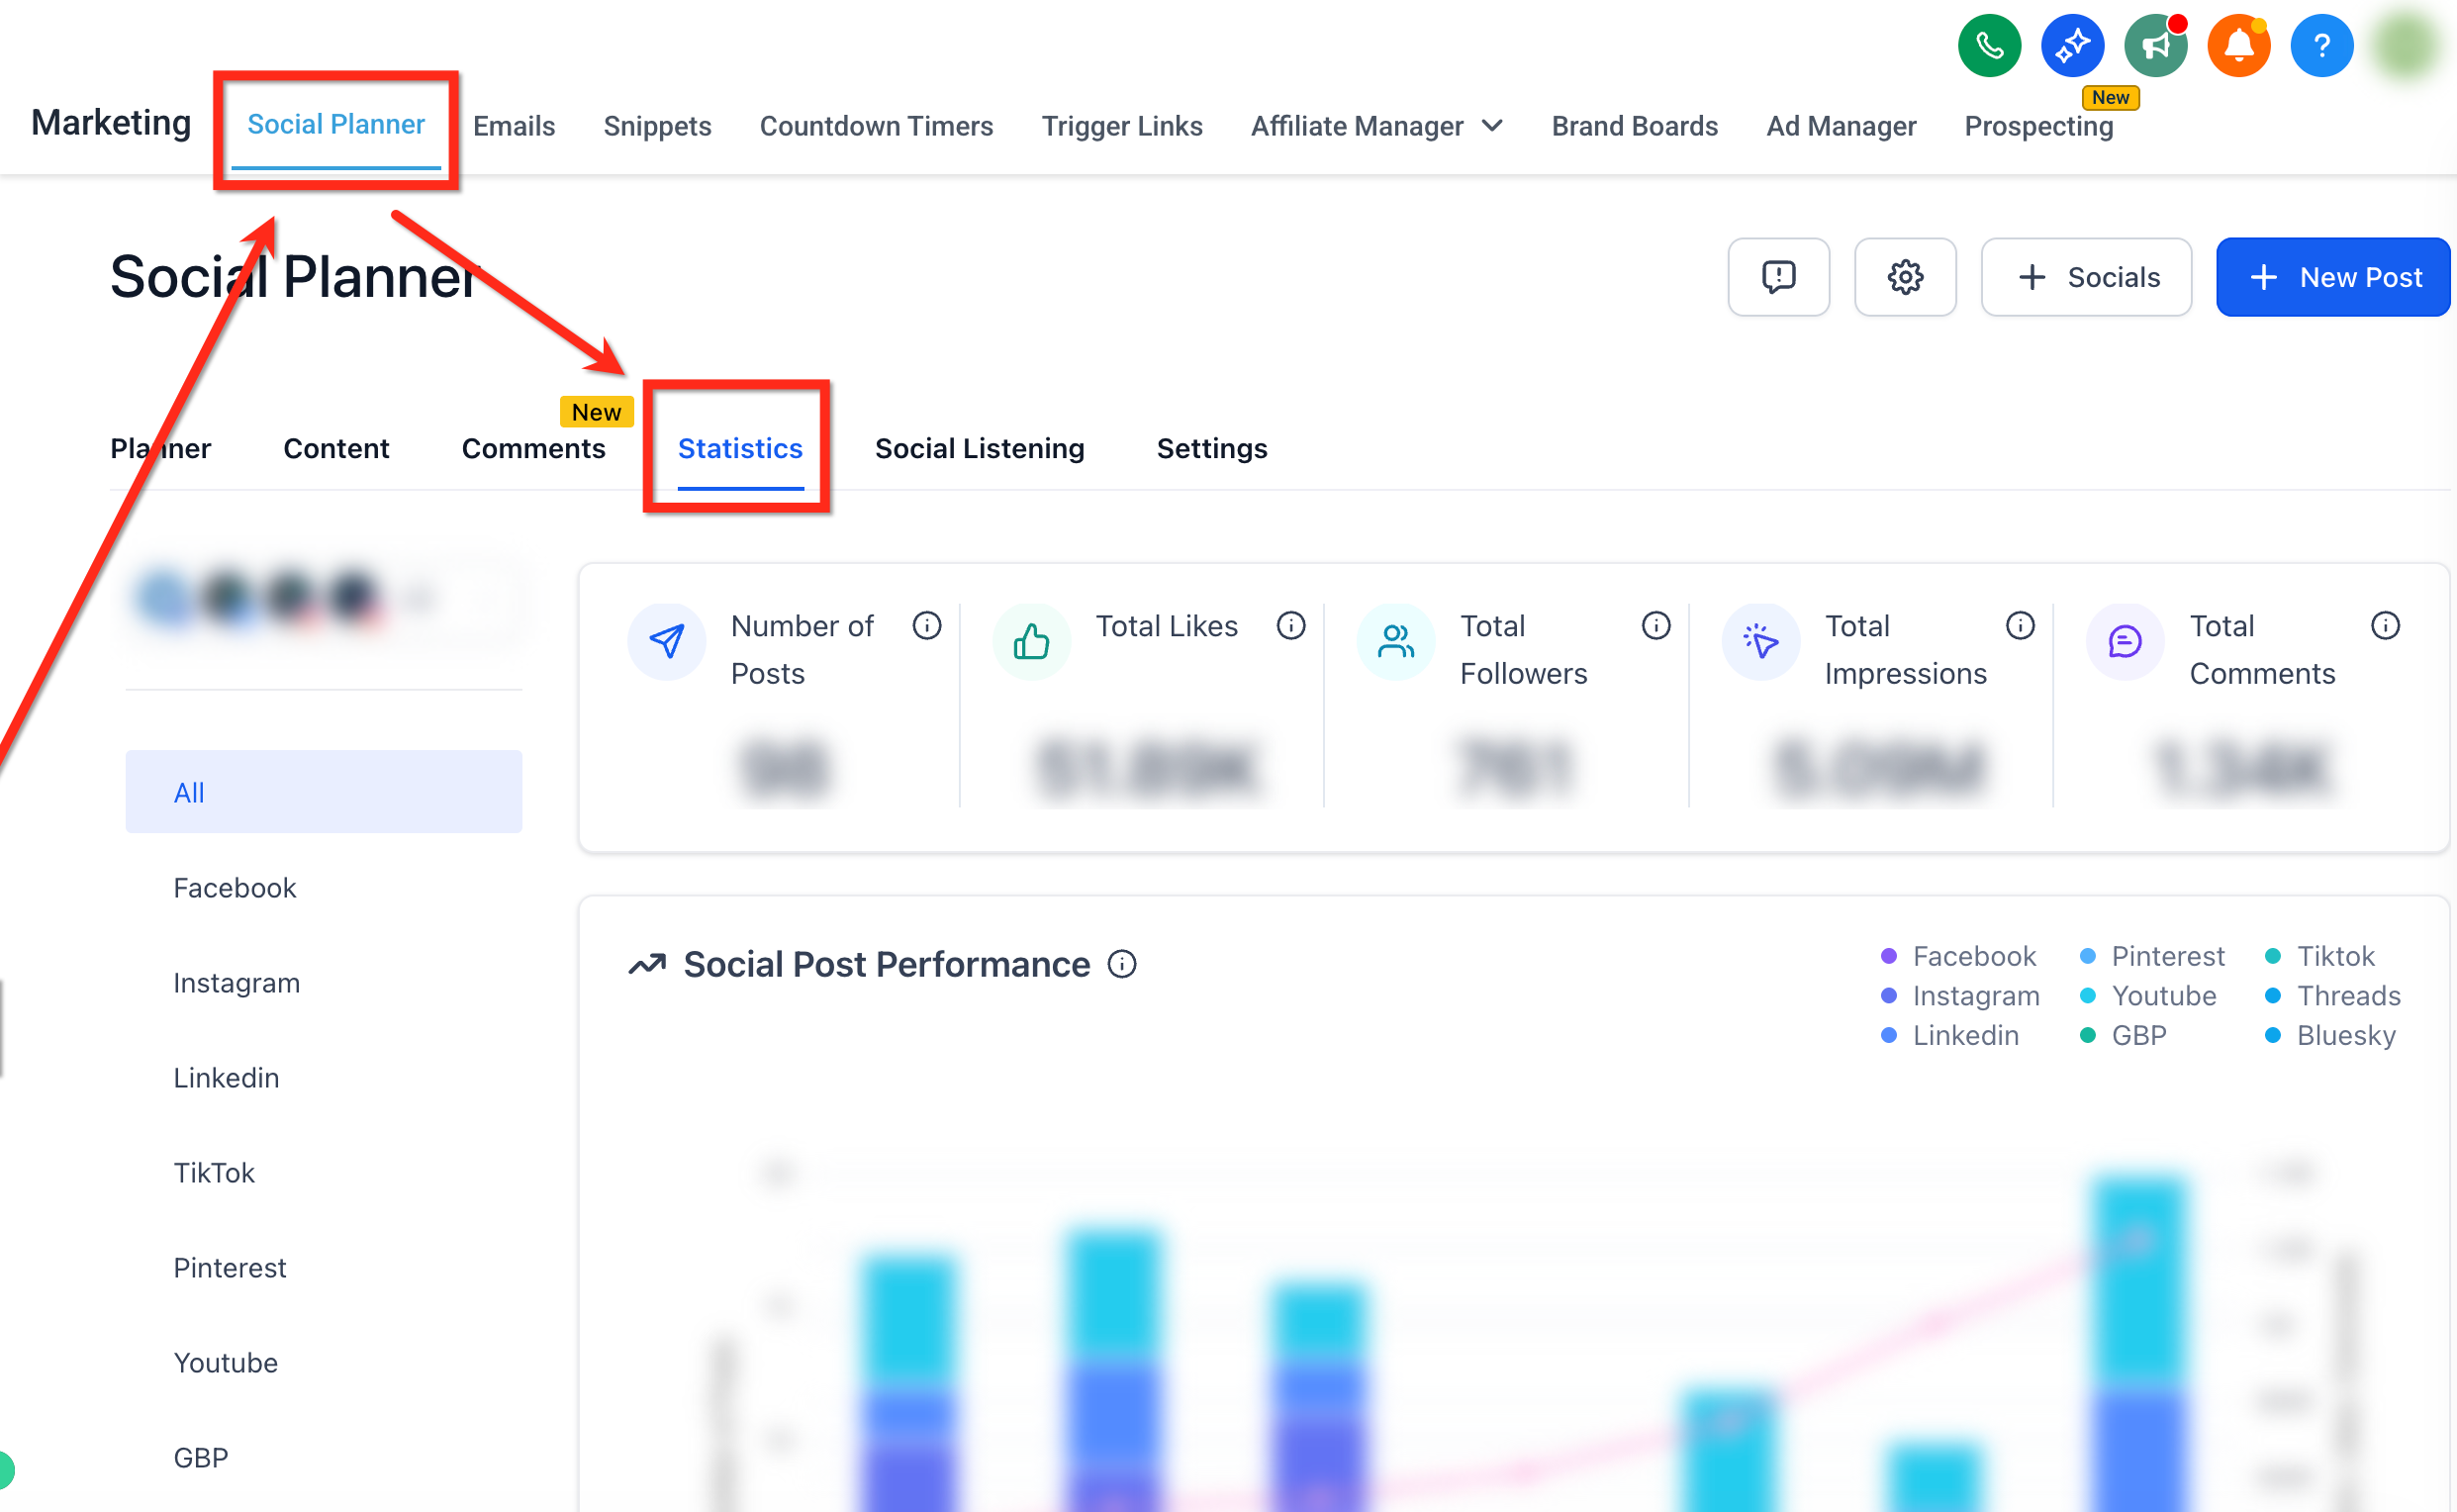
Metric availability varies by platform. Use the notes below to set expectations and keep analytics flowing without interruption.
Supported platforms: Facebook, Instagram, LinkedIn, YouTube, Pinterest, TikTok, Google Business Profile (GBP), Threads, and Bluesky.
Post-specific statistics appear in the post details modal (Planner list view).
Platforms supported: Facebook, Instagram, TikTok personal, LinkedIn page.
Platforms to be supported: YouTube, Pinterest.
Platforms not supported: Google Business Profile, TikTok Business, LinkedIn profile, communities.
TikTok
Only Business profiles are supported.
Data may take one or two days to reflect, due to TikTok API availability.
Takes n-2 days to reflect correct data (similar behavior is seen on other portals owing to API constraints).
Only LinkedIn Pages are supported, not LinkedIn profiles, owing to API constraints.
Demographic data is not supported by LinkedIn's API.
Total followers data is available only until n-2 days (n being the current day).
Threads
Impressions and post reach are not supported.
No follower count, gender data, or advanced engagement metrics.
A one-day (T-1) delay applies to all metrics except the post count.
Bluesky
Impressions are supported.
Follower metrics, demographics, and advanced engagement breakdowns are not supported.
A one-day (T-1) delay applies to all metrics except the post count.
Demographics are not supported by any of the newly released platforms.
Metric | YouTube | TikTok | GBP | Threads | Bluesky | ||||
|---|---|---|---|---|---|---|---|---|---|
No. of Posts | ✅ | ✅ | ✅ | ✅ | ✅ | ✅ | ❌ | ✅ | ✅ |
Likes | ✅ | ✅ | ✅ | ✅ | ❌ | ✅ | ❌ | ✅ | ✅ |
Comments | ✅ | ✅ | ✅ | ✅ | ❌ | ✅ | ❌ | ✅ | ✅ |
Followers | ✅ | ✅ | ✅ | ✅ | ❌ | ✅ | ❌ | ✅ | ✅ |
Impressions | ✅ | ✅ | ✅ | ❌ | ✅ | ✅ | ✅ | ✅ | ❌ |
Post Reach | ✅ | ✅ | ✅ | ✅ | ❌ | ❌ | ✅ | ❌ | ❌ |
Engagement | ✅ | ✅ | ✅ | ✅ | ❌ | ✅ | ❌ | ✅ | ✅ |
Top Performing Posts | ✅ | ✅ | ✅ | ✅ | ✅ | ✅ | ❌ | ❌ | ❌ |
Gender Demography | ❌ | ✅* | ❌ | ❌ | ❌ | ❌ | ❌ | ❌ | ❌ |
*Instagram demographics require at least 100 followers. Follower-related stats may be limited below that threshold.
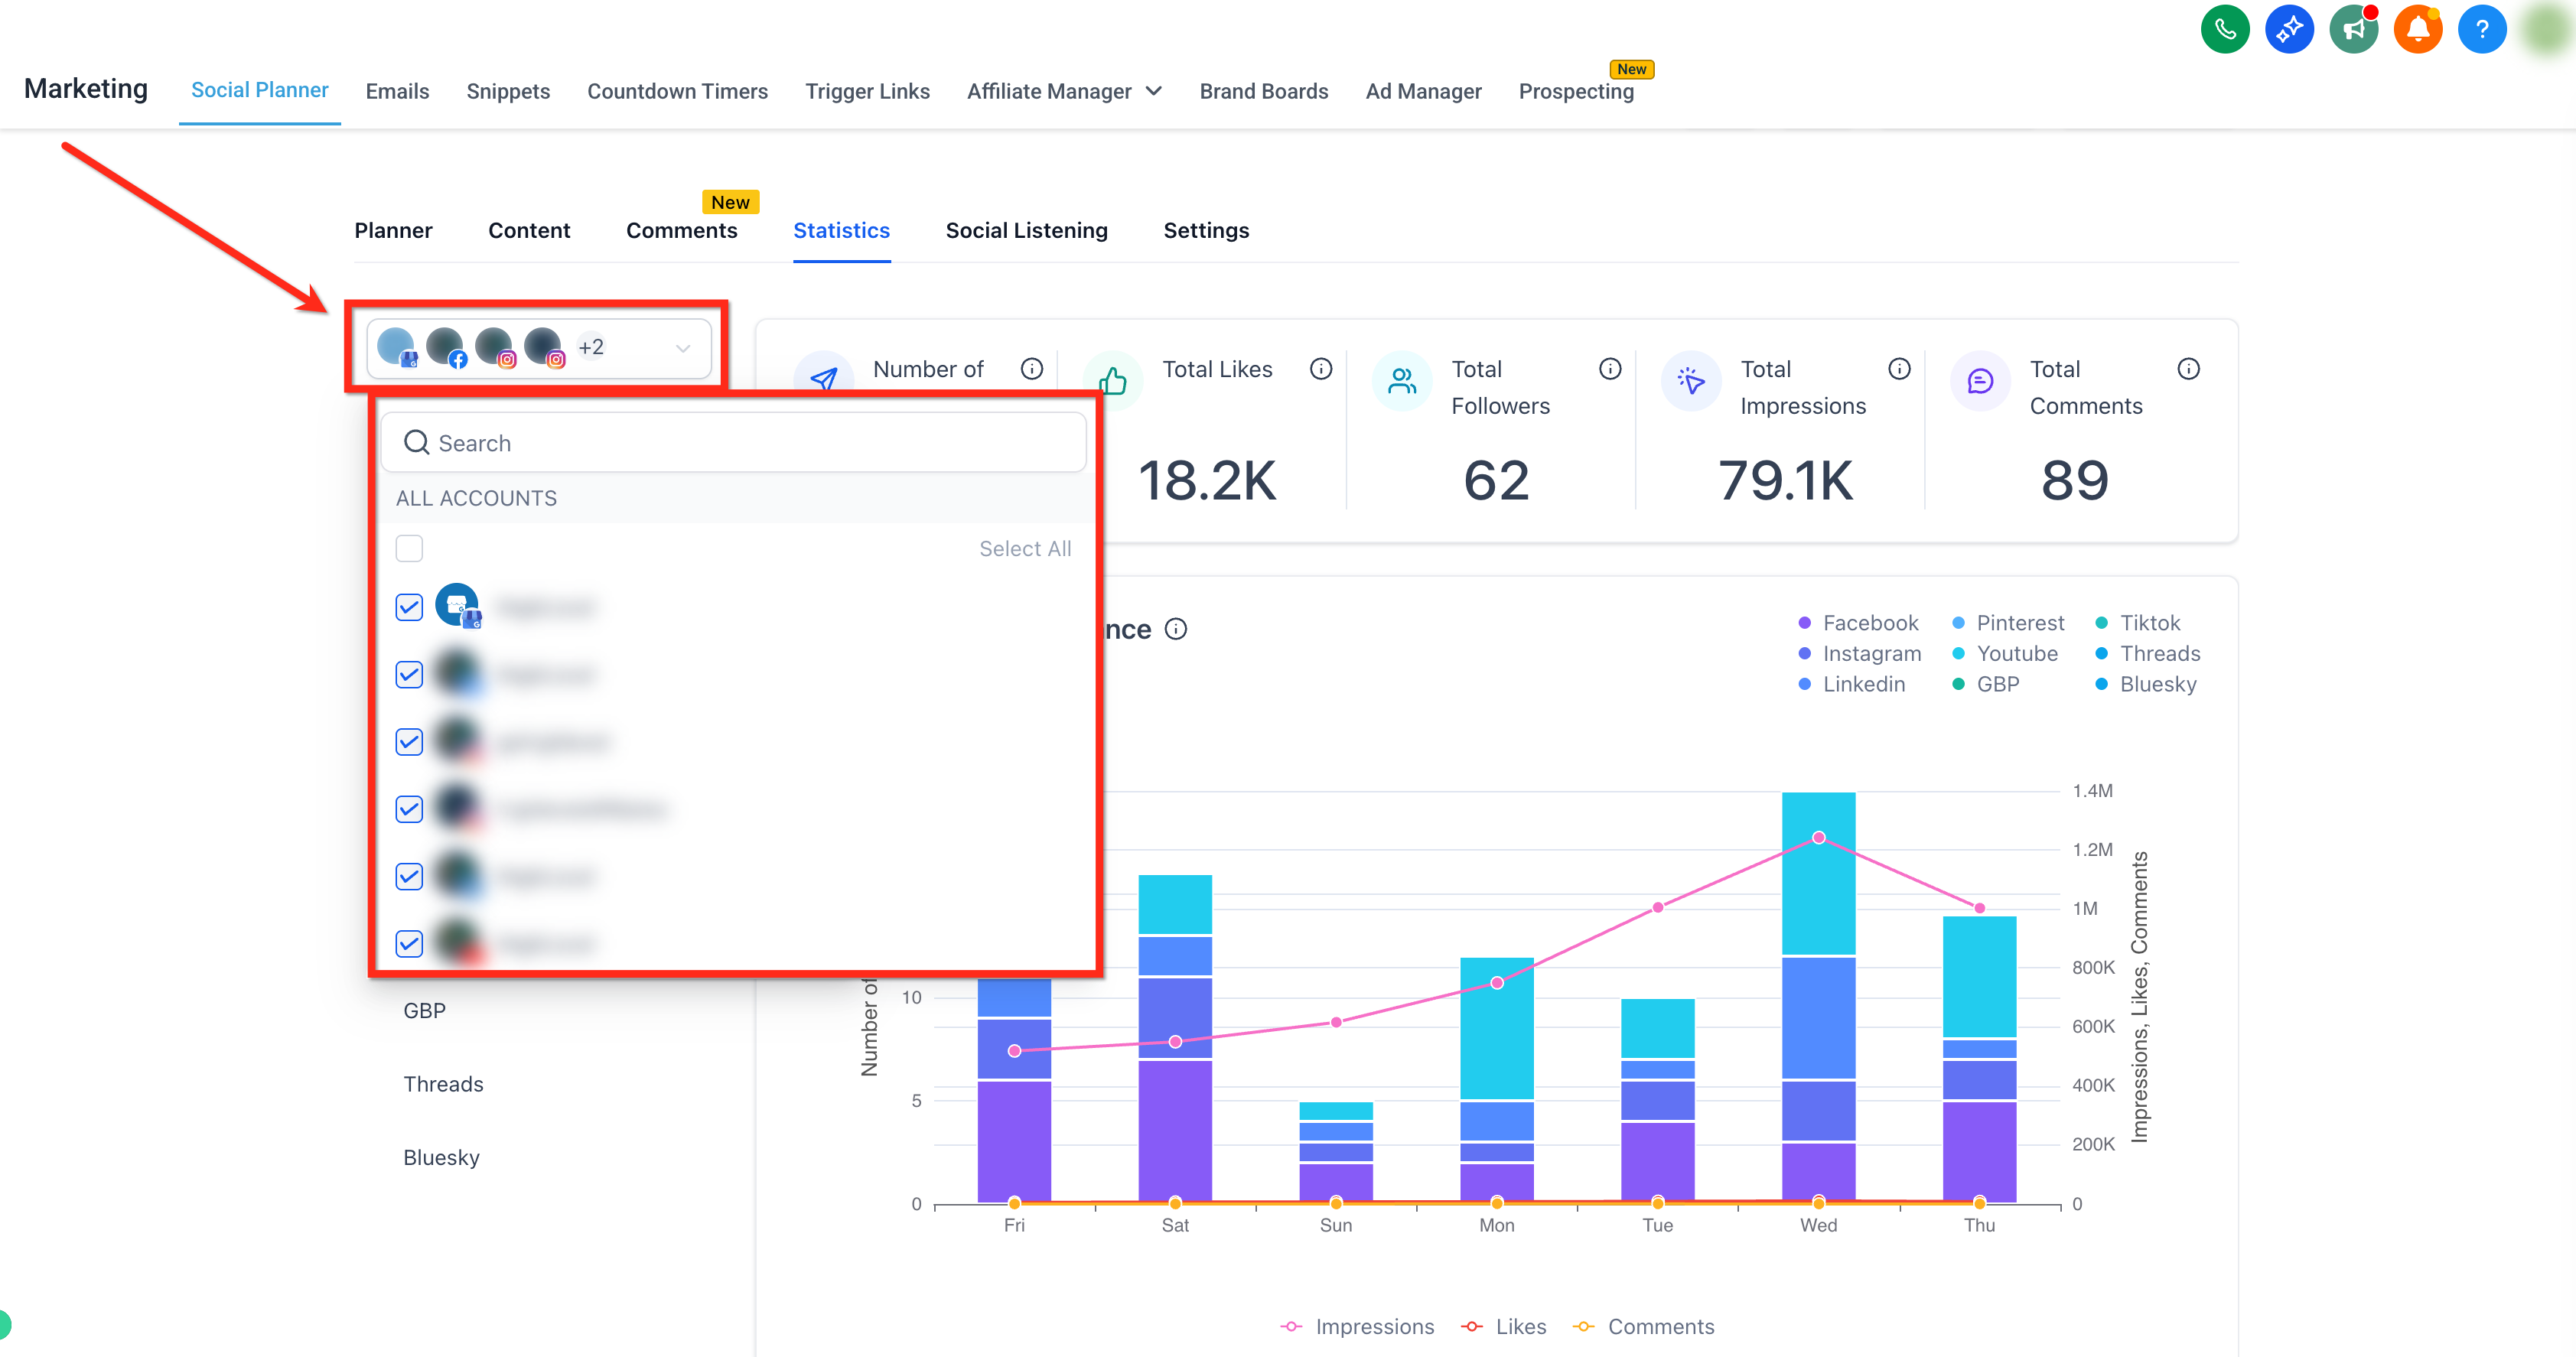
To filter based on accounts, open the dropdown in the upper-left and check the boxes for the accounts you want included in the metrics.
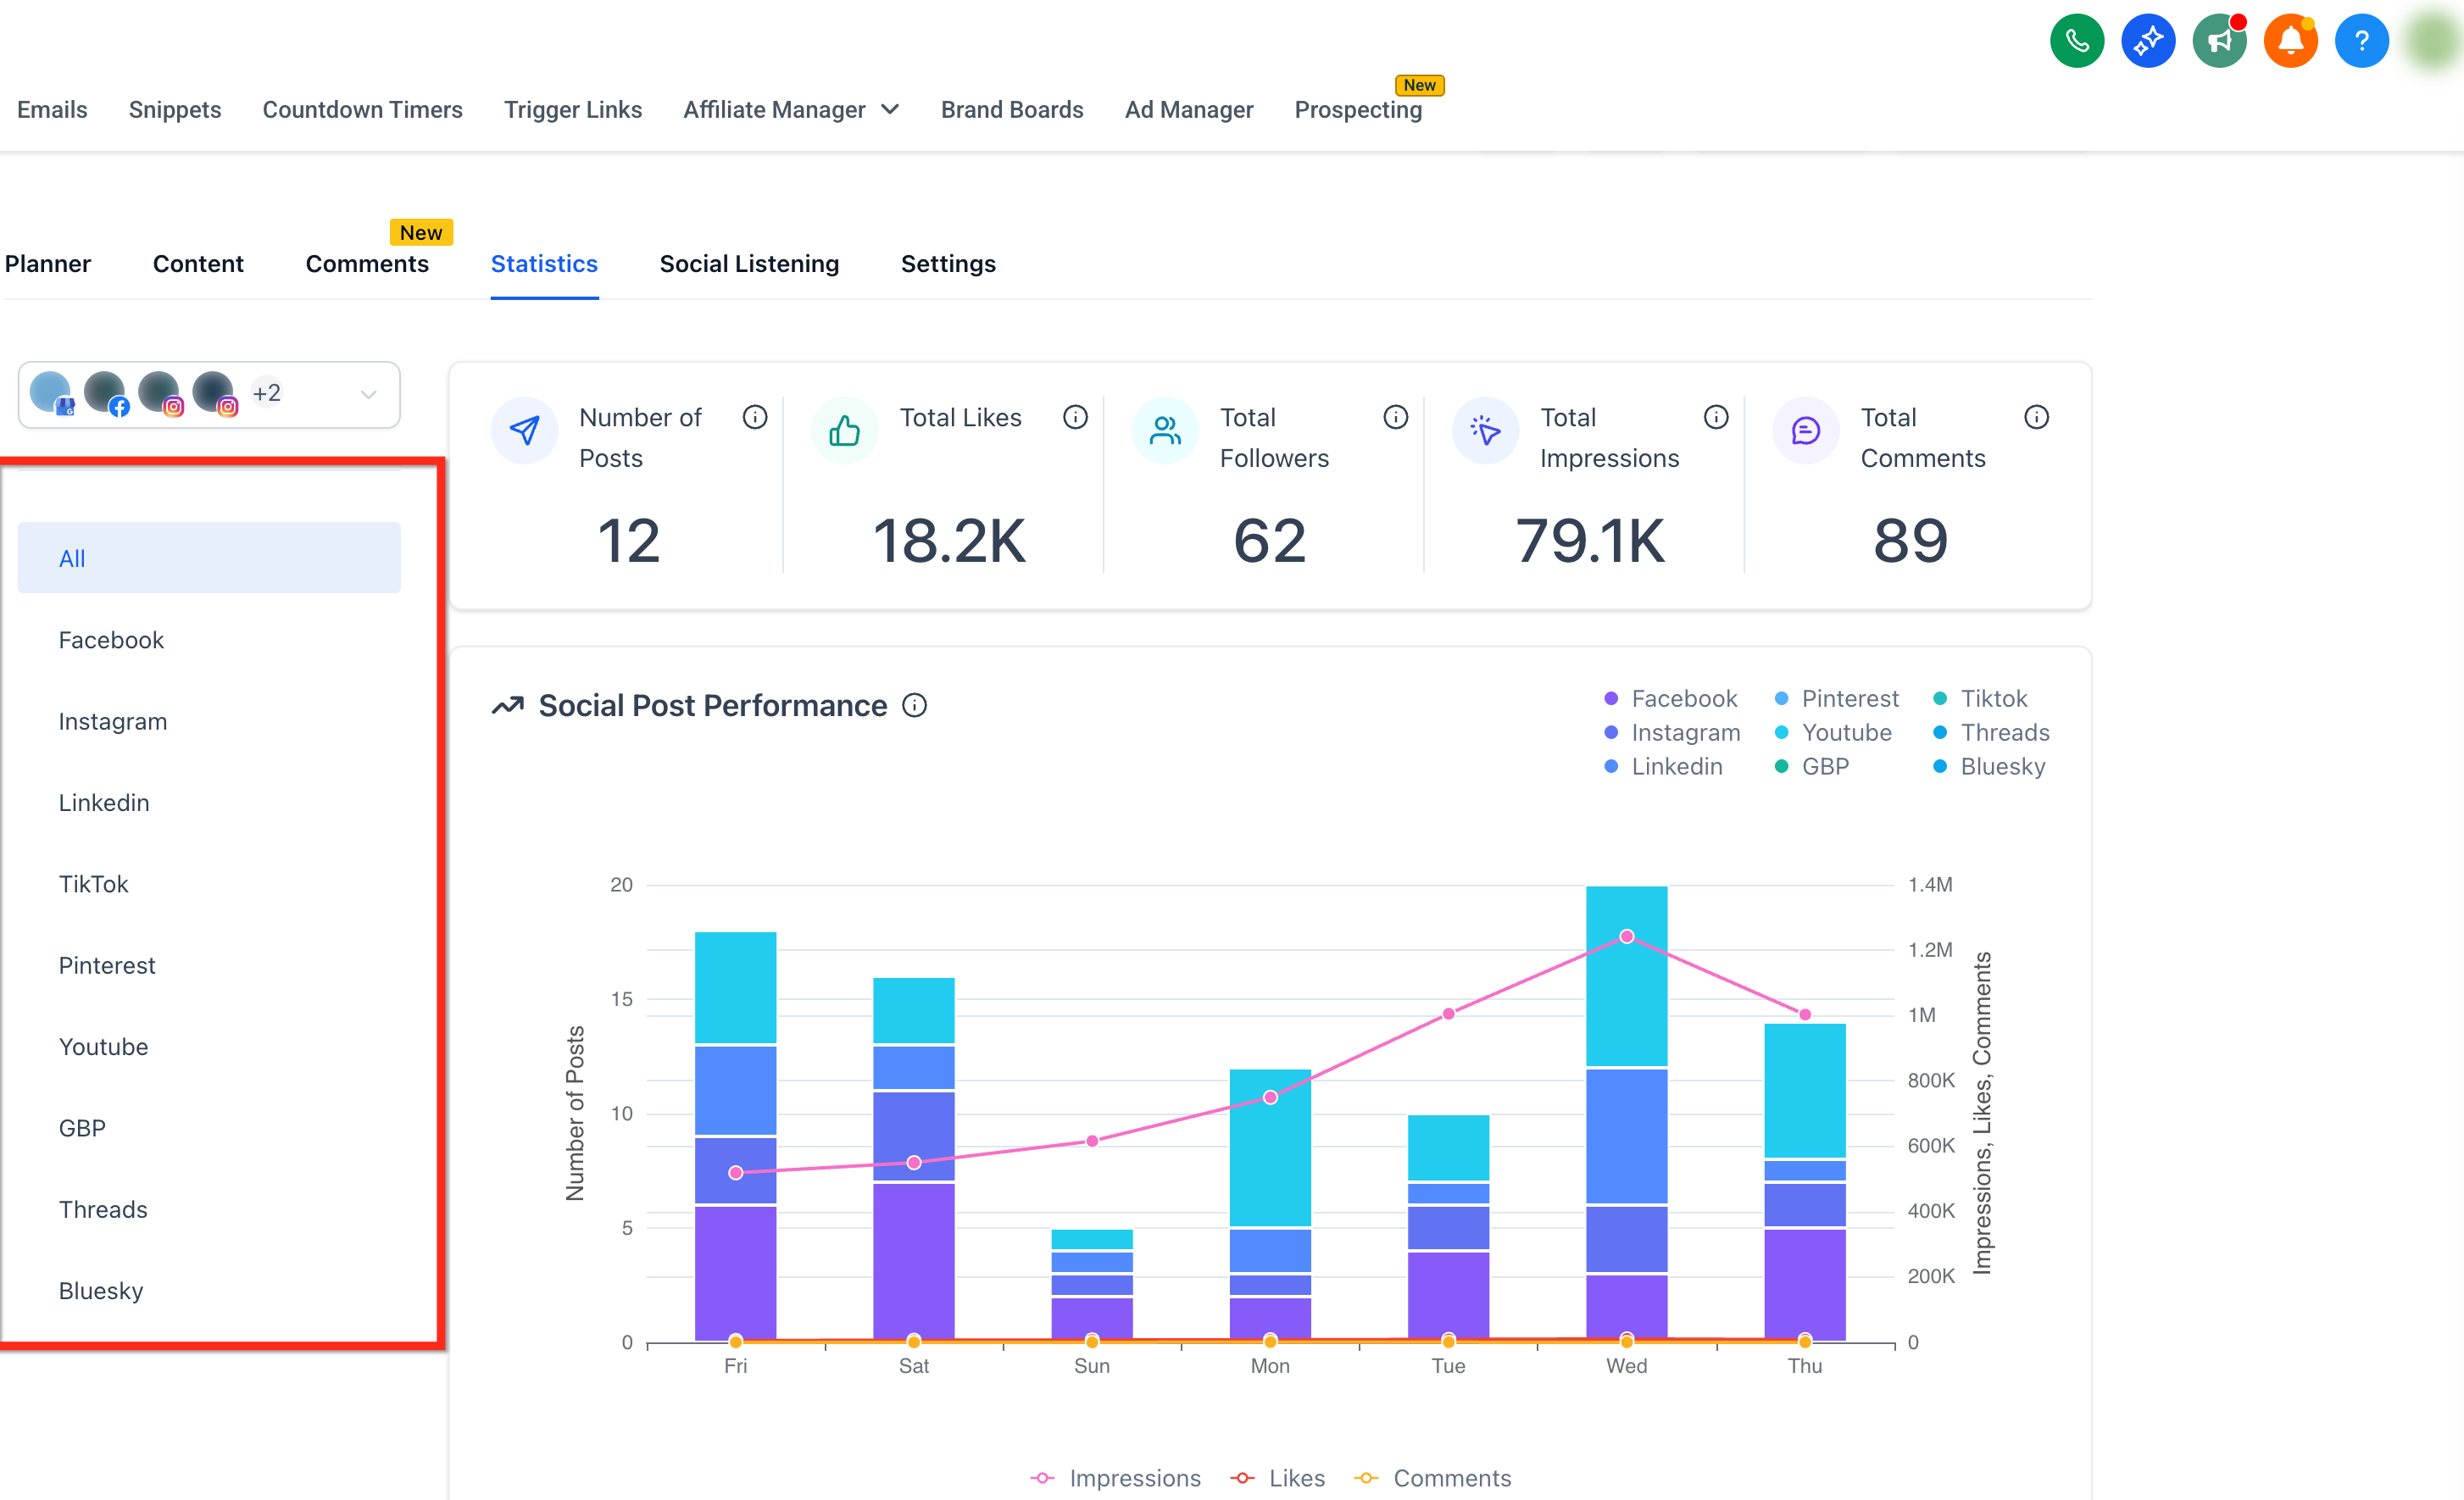
Use the selector bar on the left to filter results by social media platform. Choose All for a cross-platform rollup, or select a specific platform (for example, Threads or Bluesky) to narrow the results.
Tip: Hover over the tooltip (i) next to any metric for definitions, supported platforms, and time-range details.
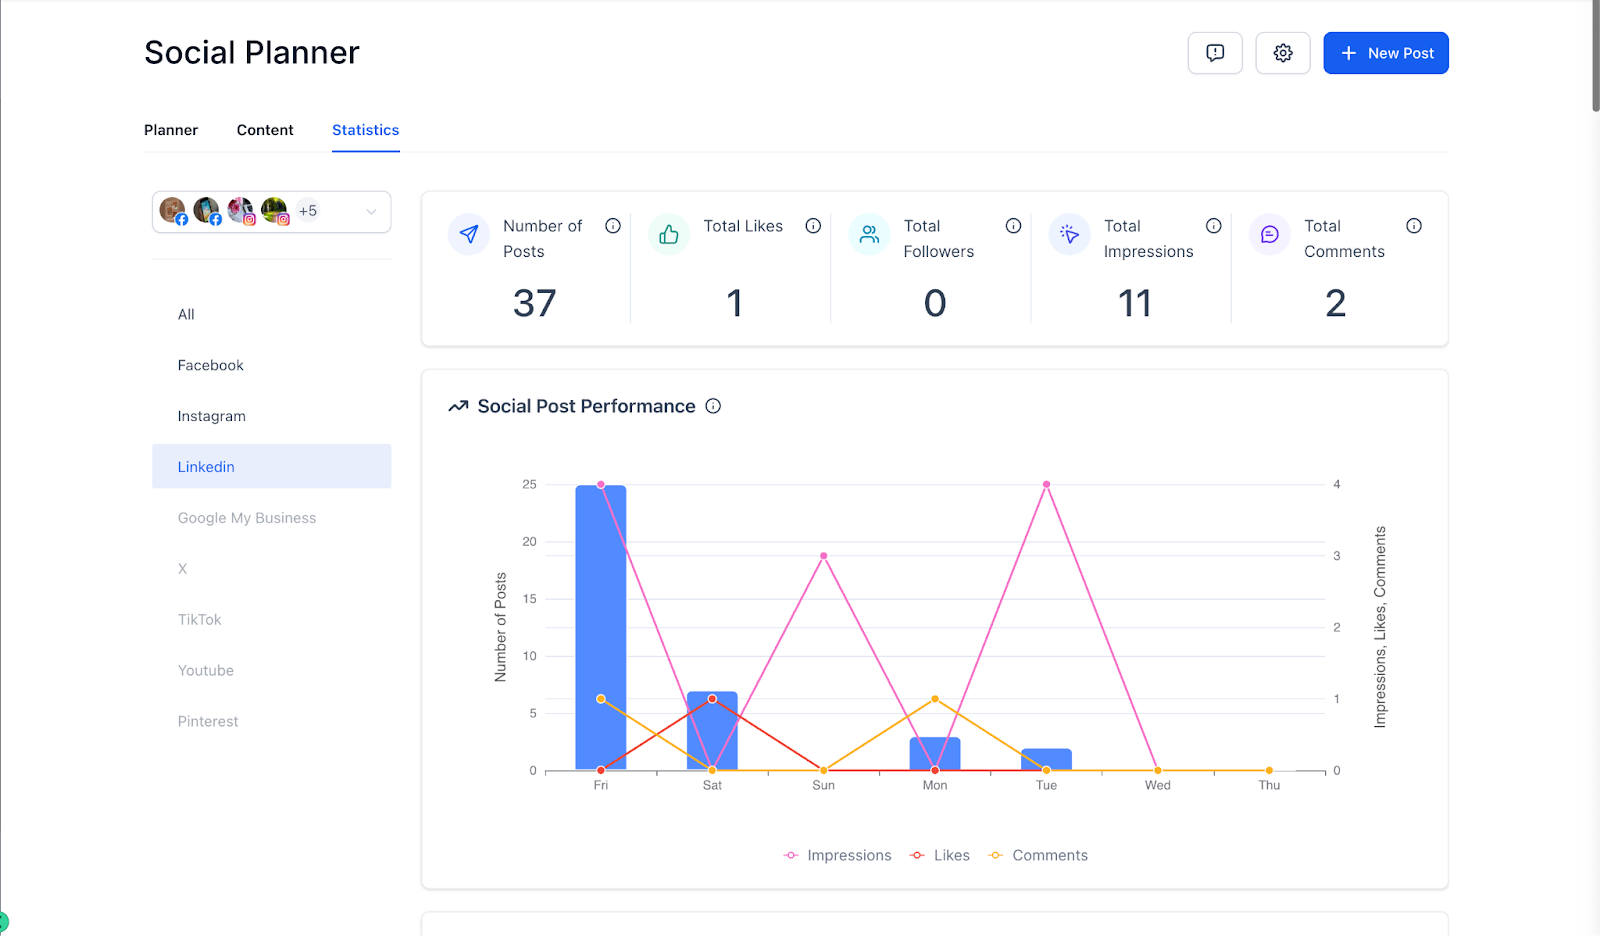
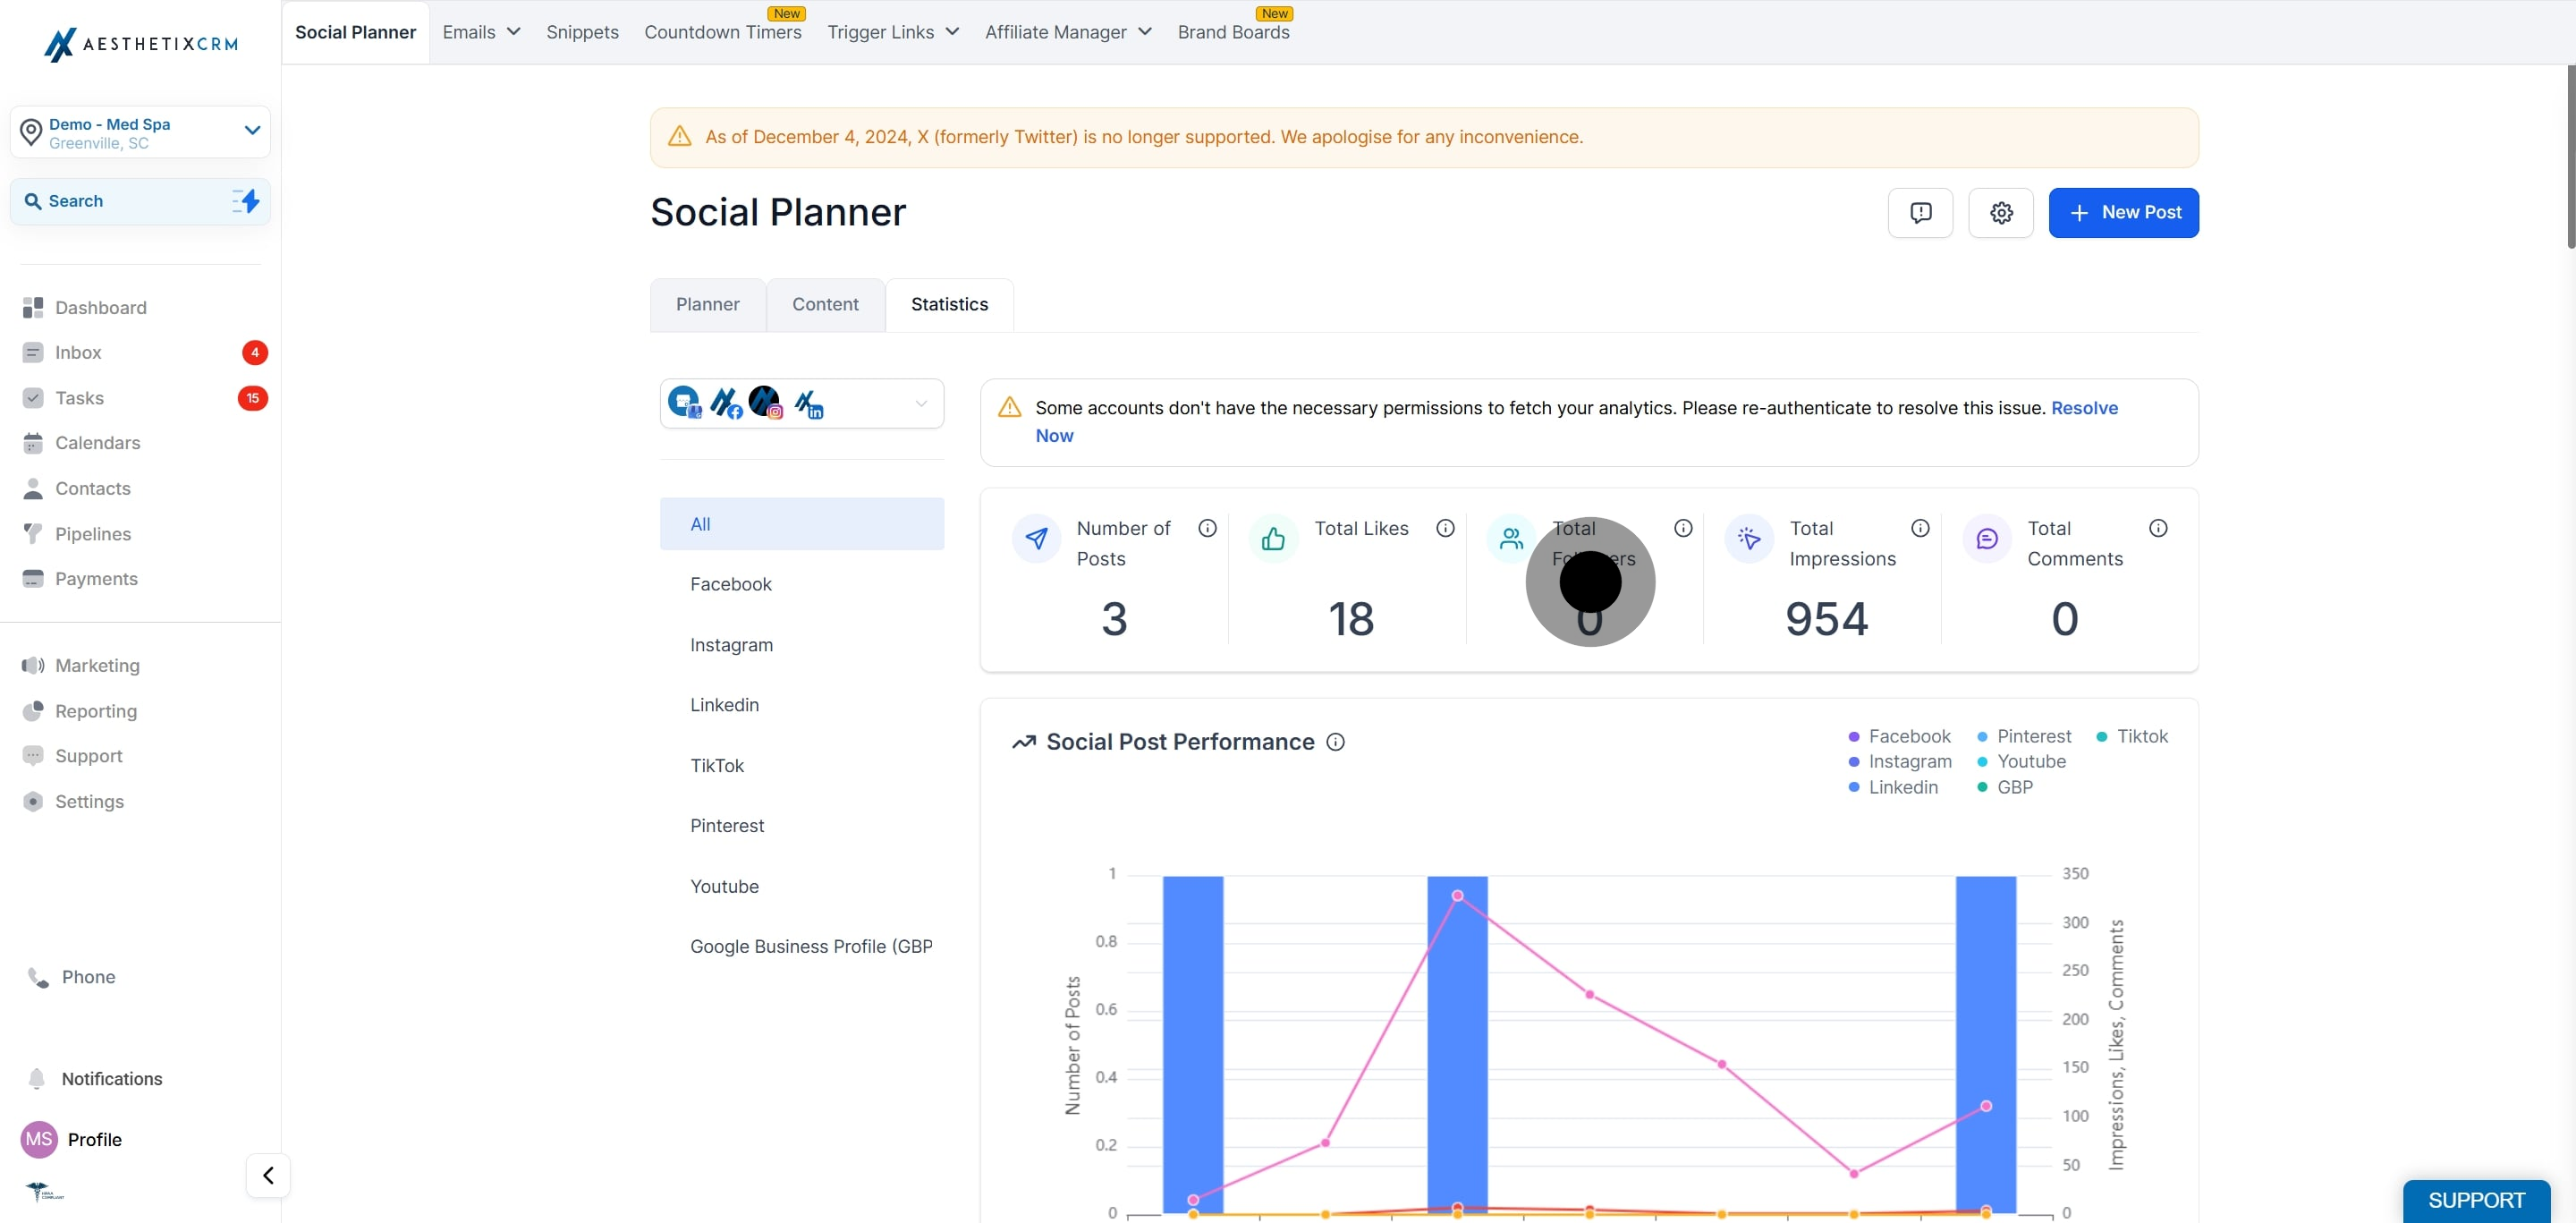
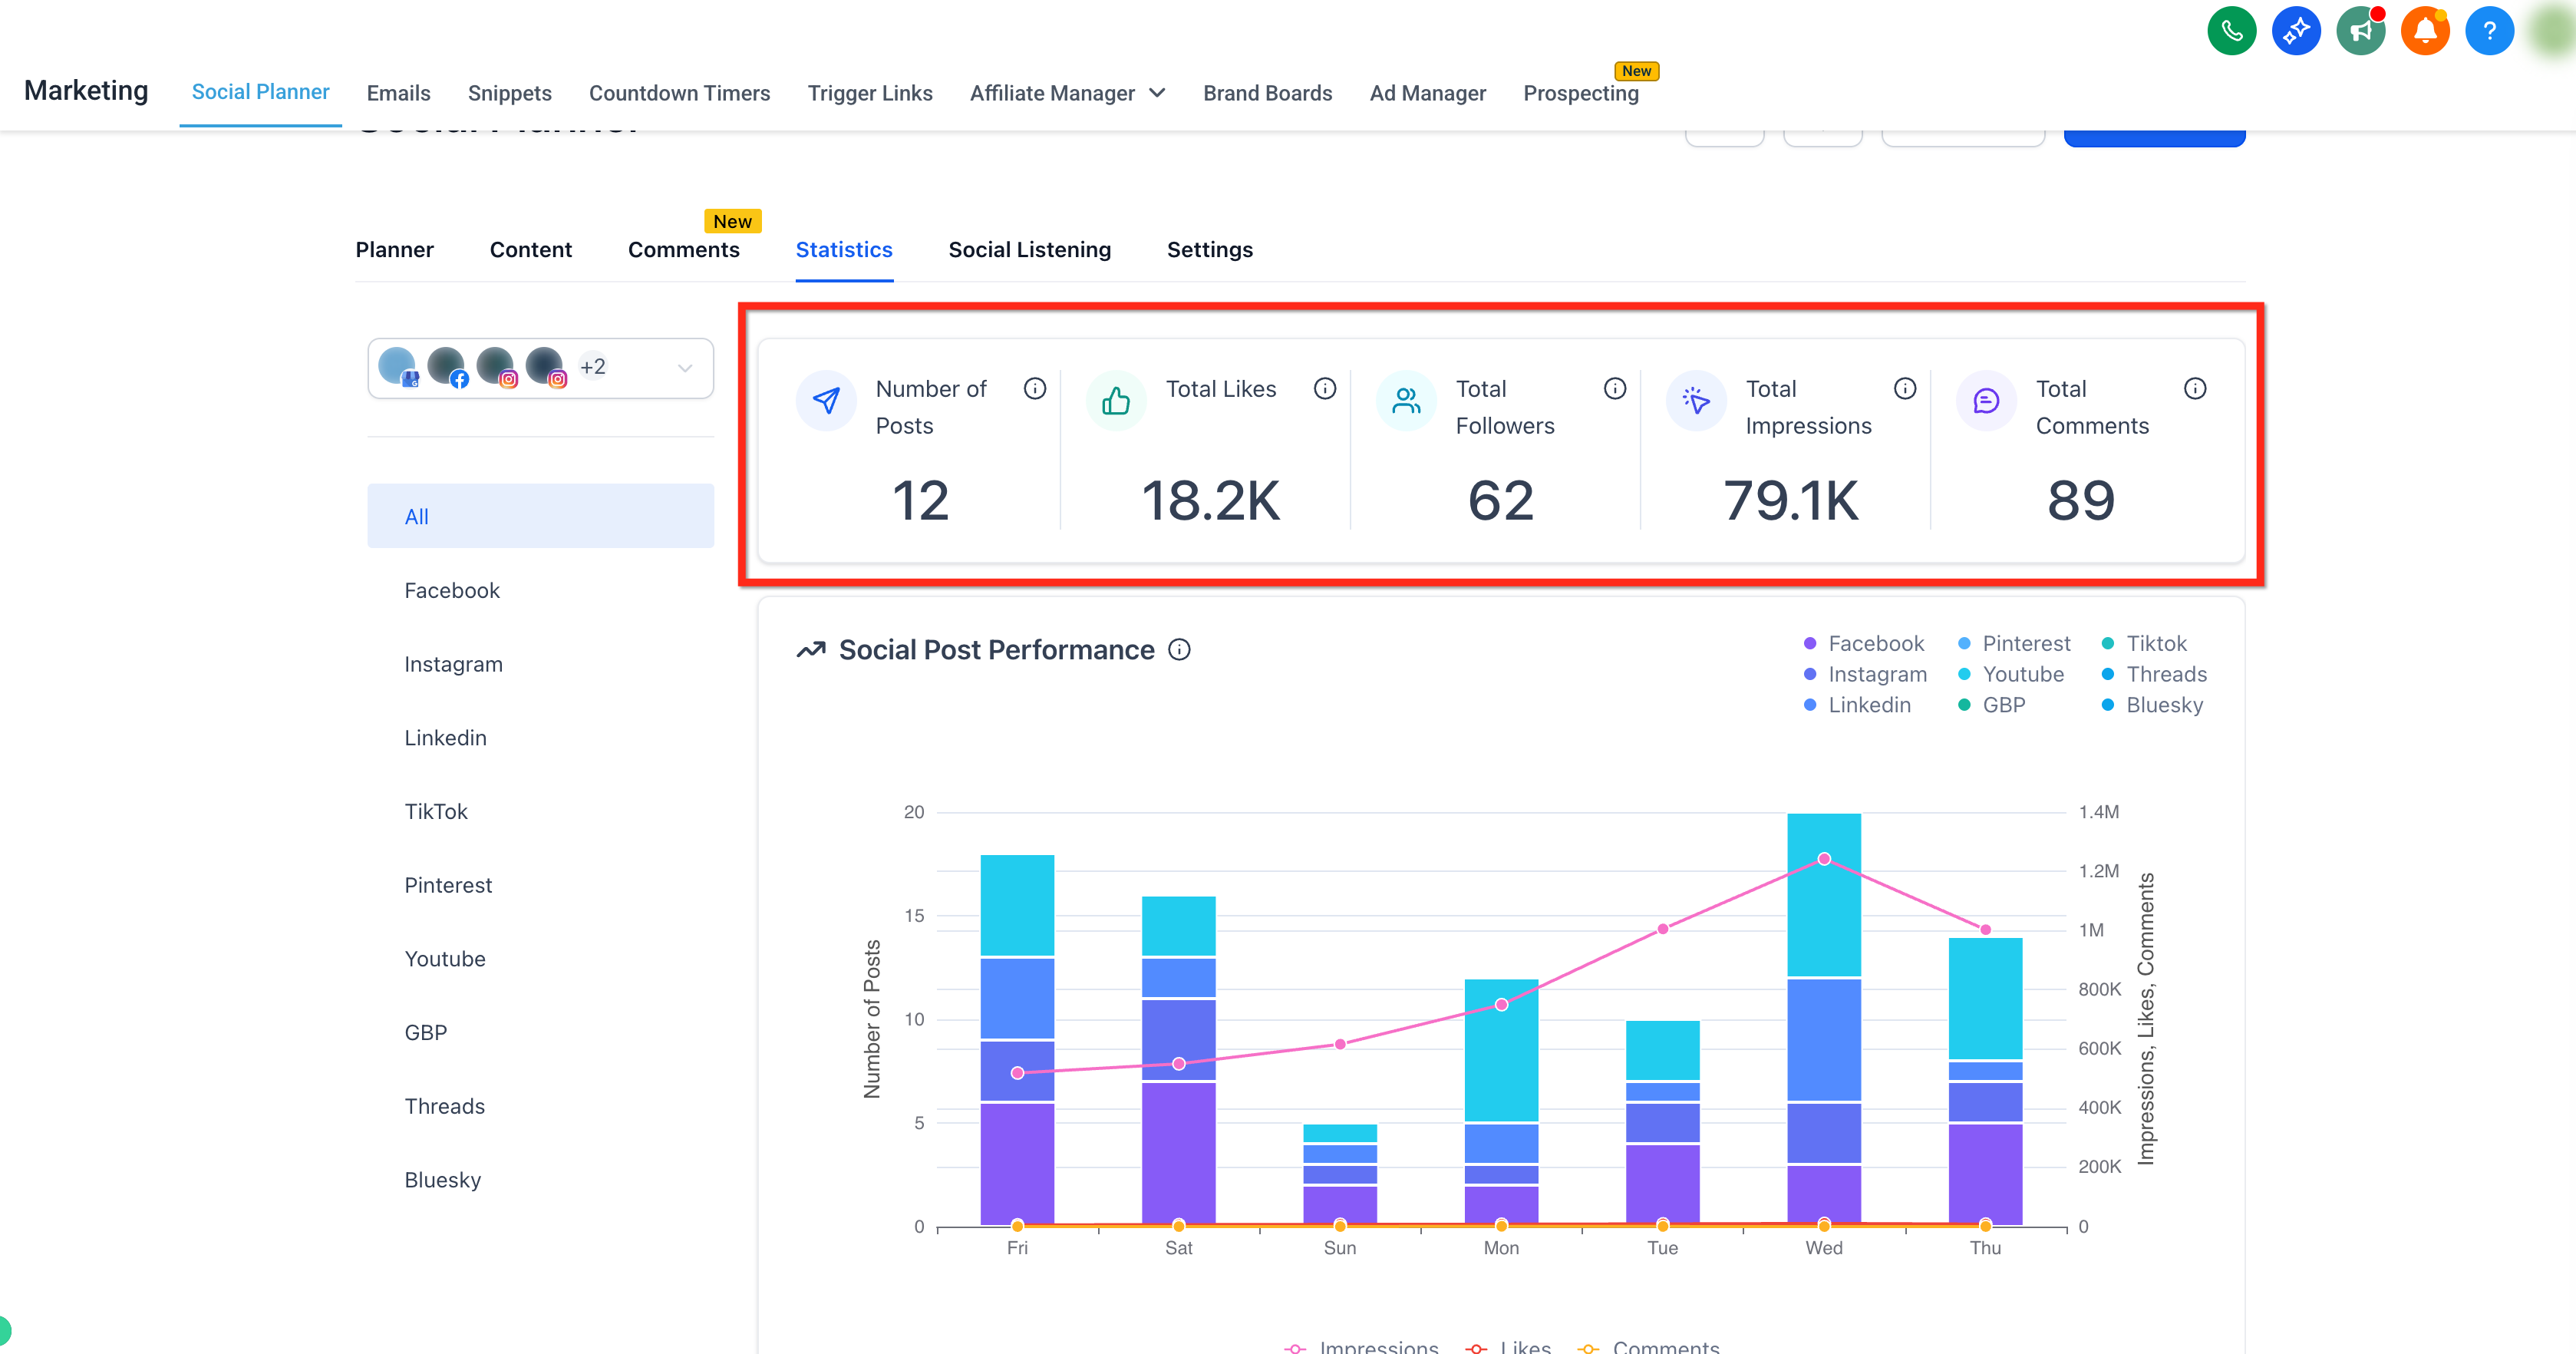
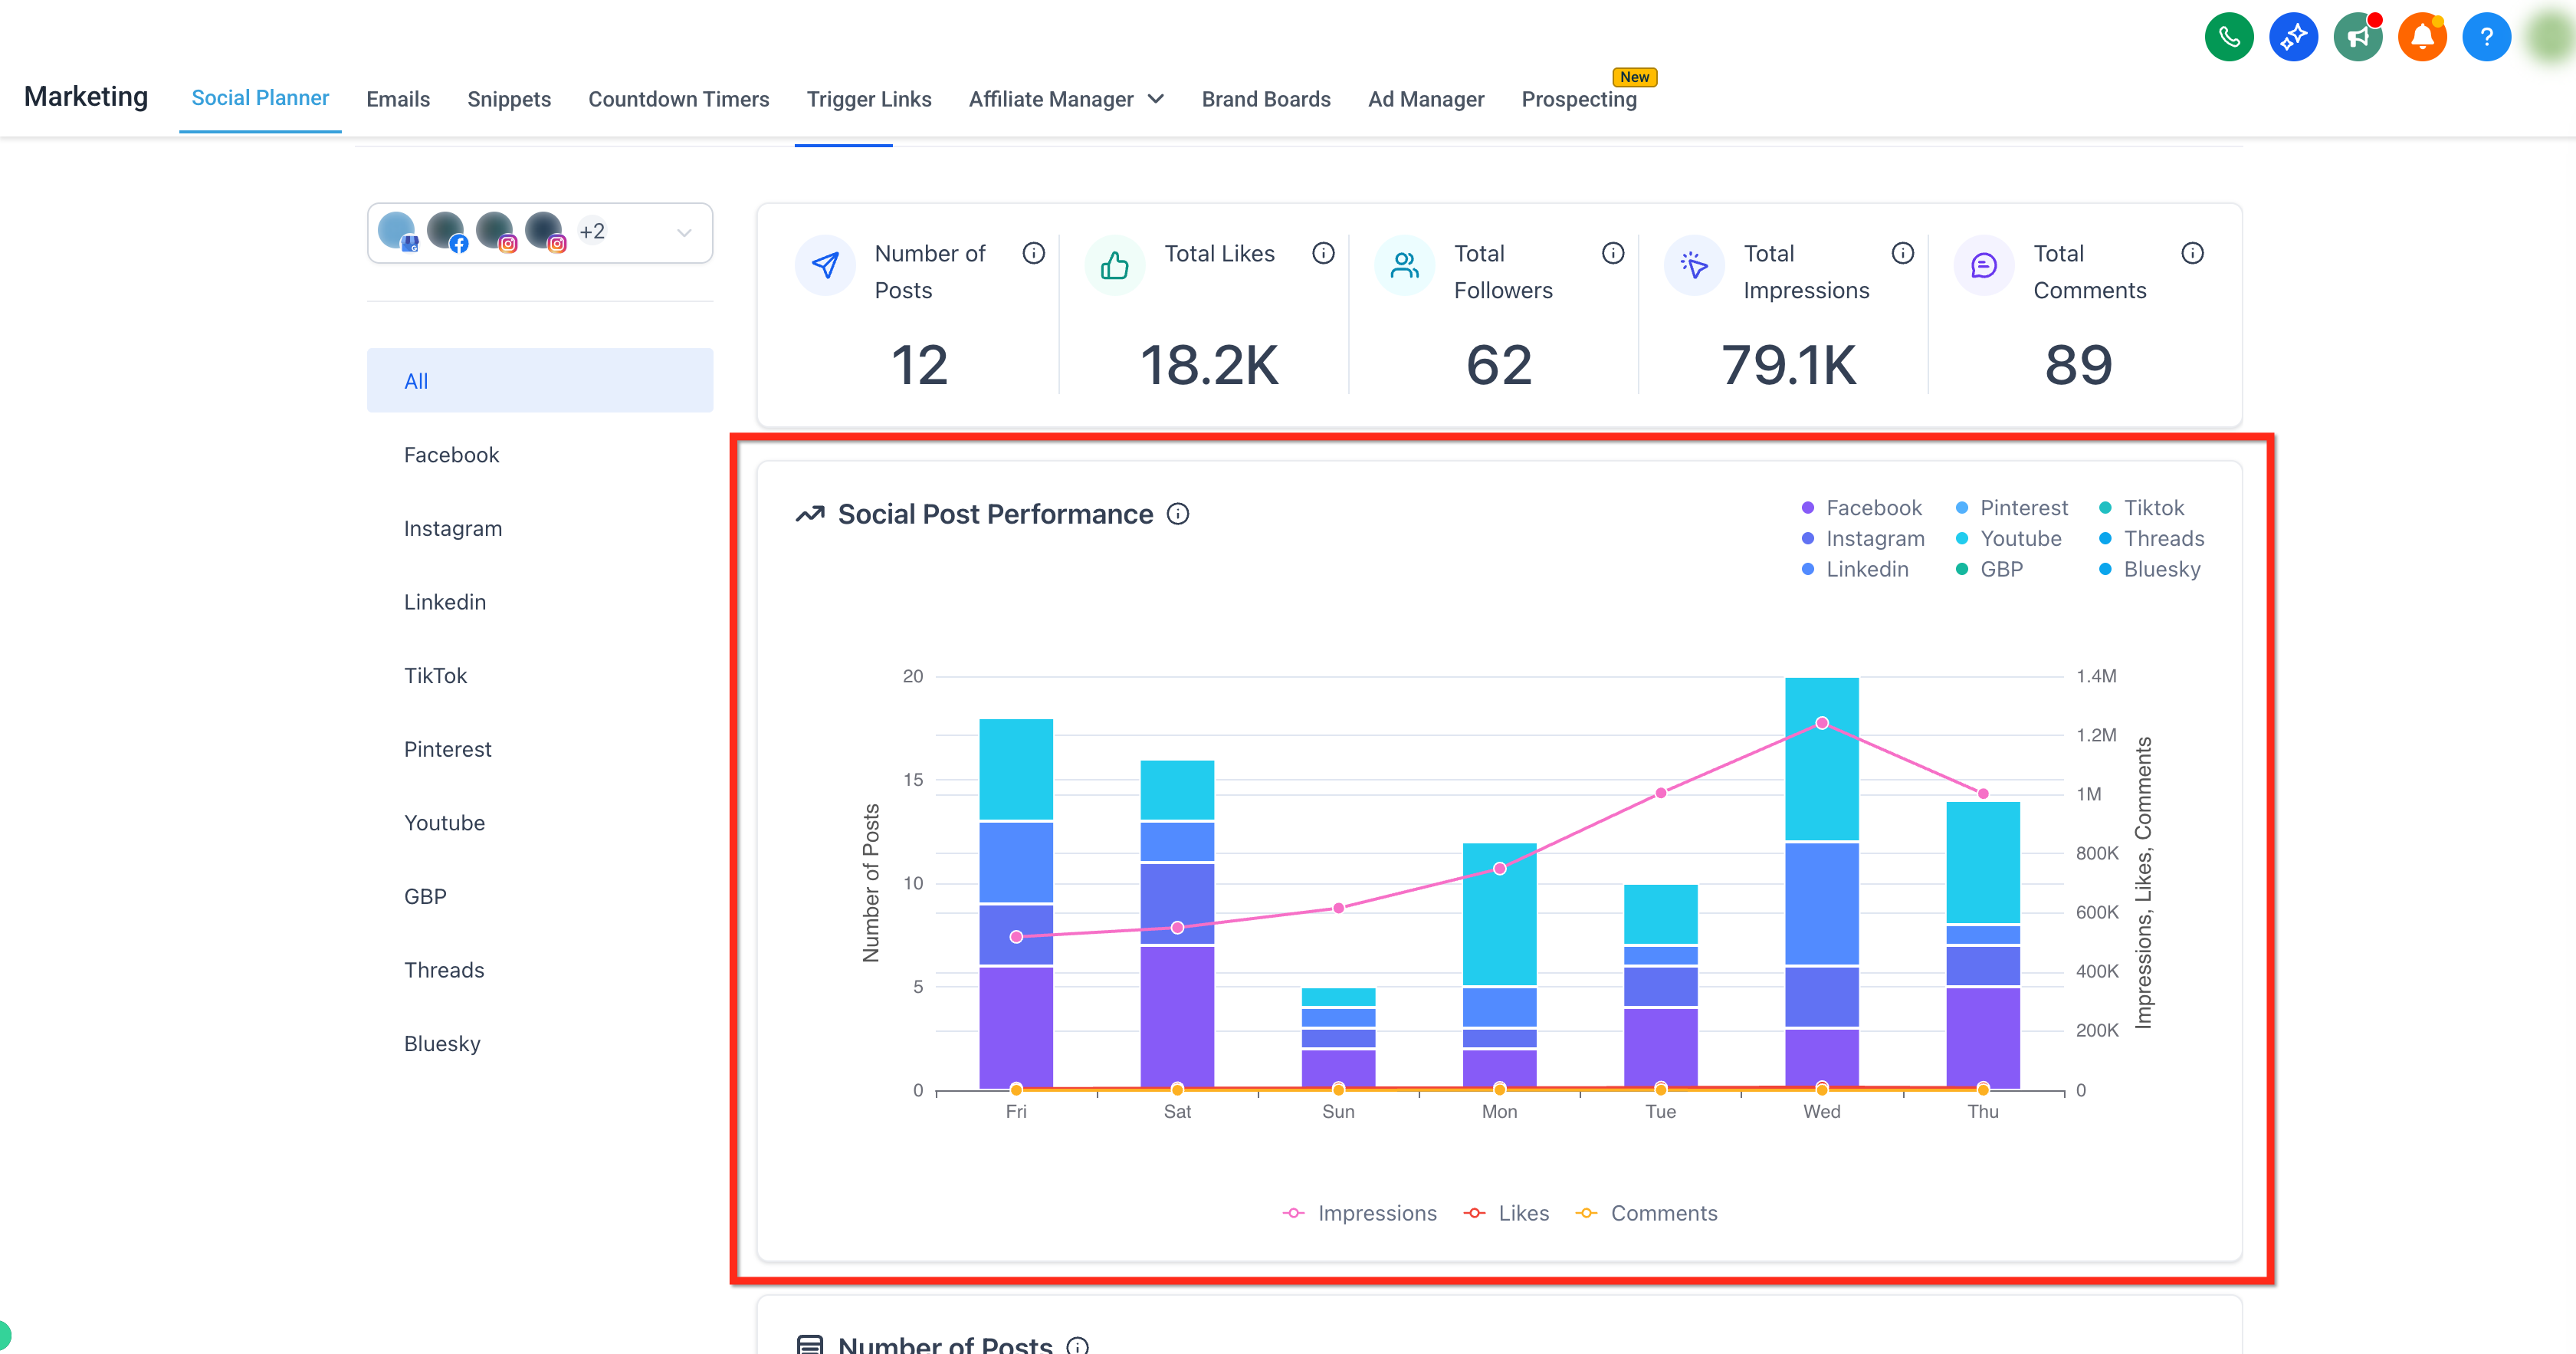
Track the number of posts, likes, followers, impressions, and comments across all platforms at a glance.
Number of Posts: Total posts published across all selected social accounts.
Total Likes: Total likes on posts published across all selected accounts.
Total Followers: Total unique followers who joined across all selected social accounts.
Impressions: Total unique impressions on published posts across all selected social accounts.
Comments: Total count of comments on published posts across all selected social accounts.
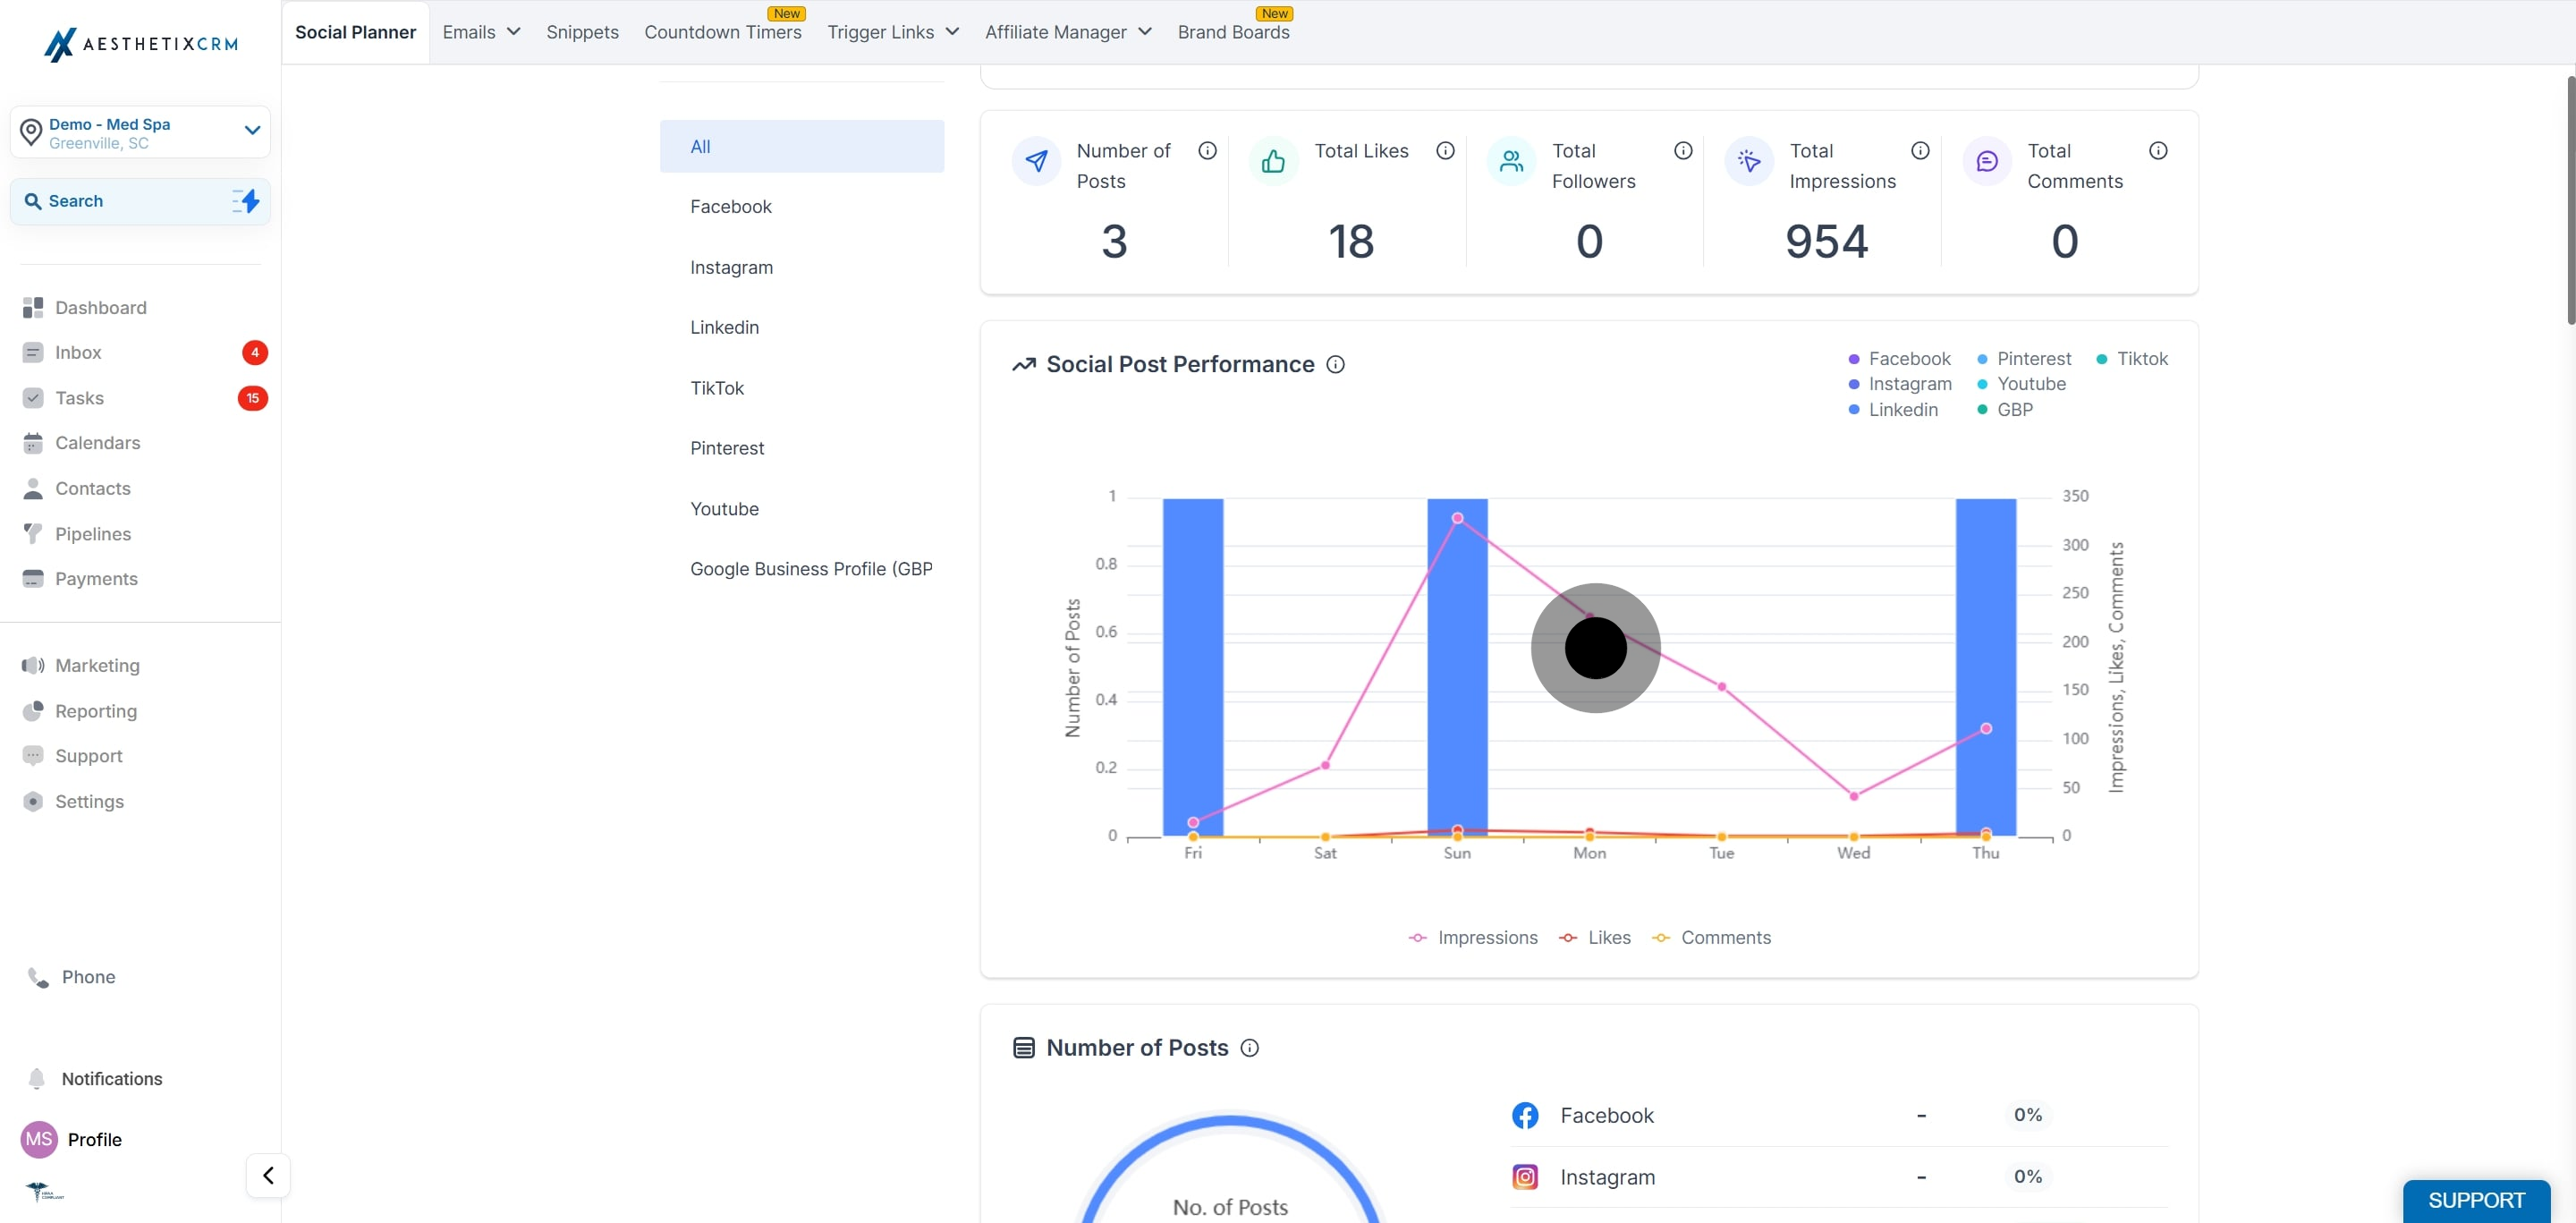
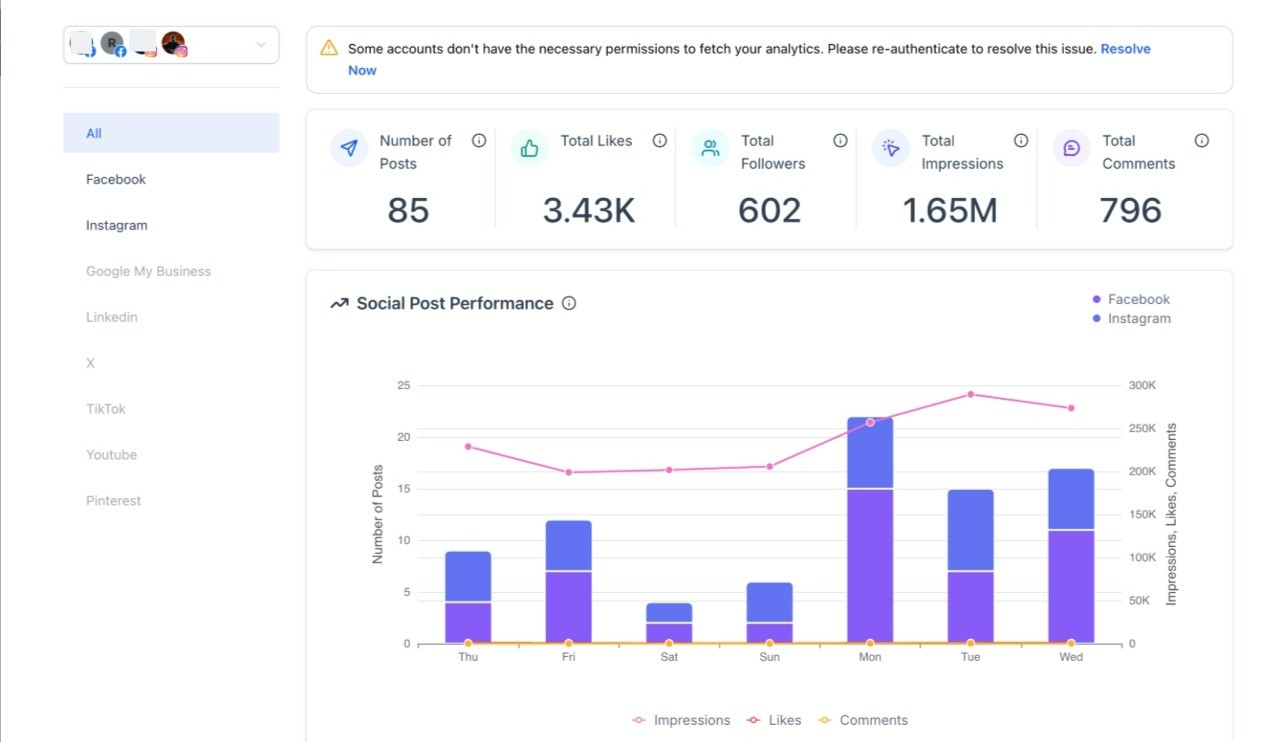
Visualize your social post performance with an interactive graph. Published posts appear as bars, alongside daily totals for impressions, likes, and comments as lines, so you can track posting trends and weekly performance at a glance.
Bar graph (weekly posts): Shows the number of posts published per week across all selected platforms.
Line graph (engagement): The overlaying lines represent the total interactions (comments, likes, and shares) per day, regardless of when the posts were published.
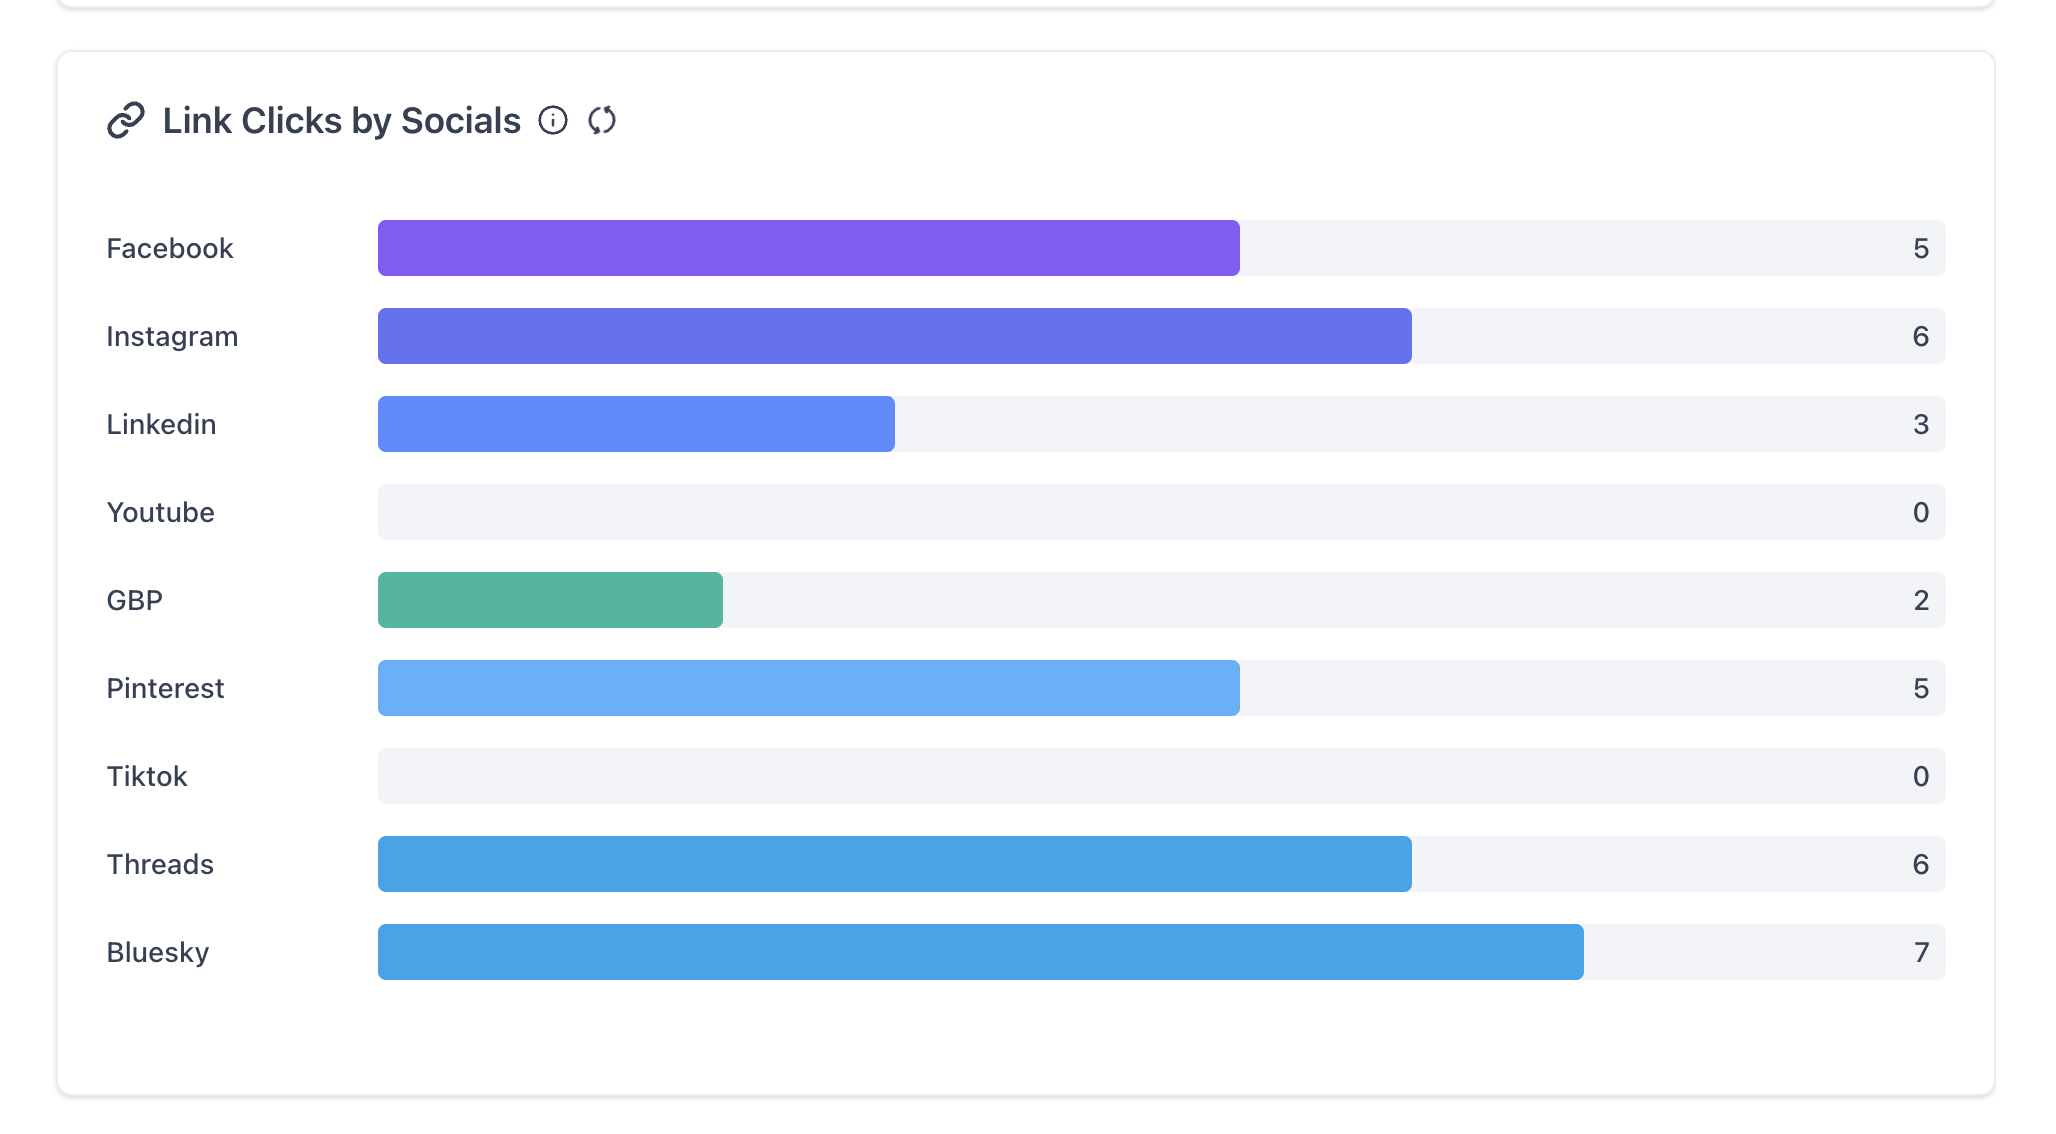
The total number of link clicks from posts published across all selected social accounts, broken down by platform. Tracking is available only for shortened links created through the Social Planner link shortener.
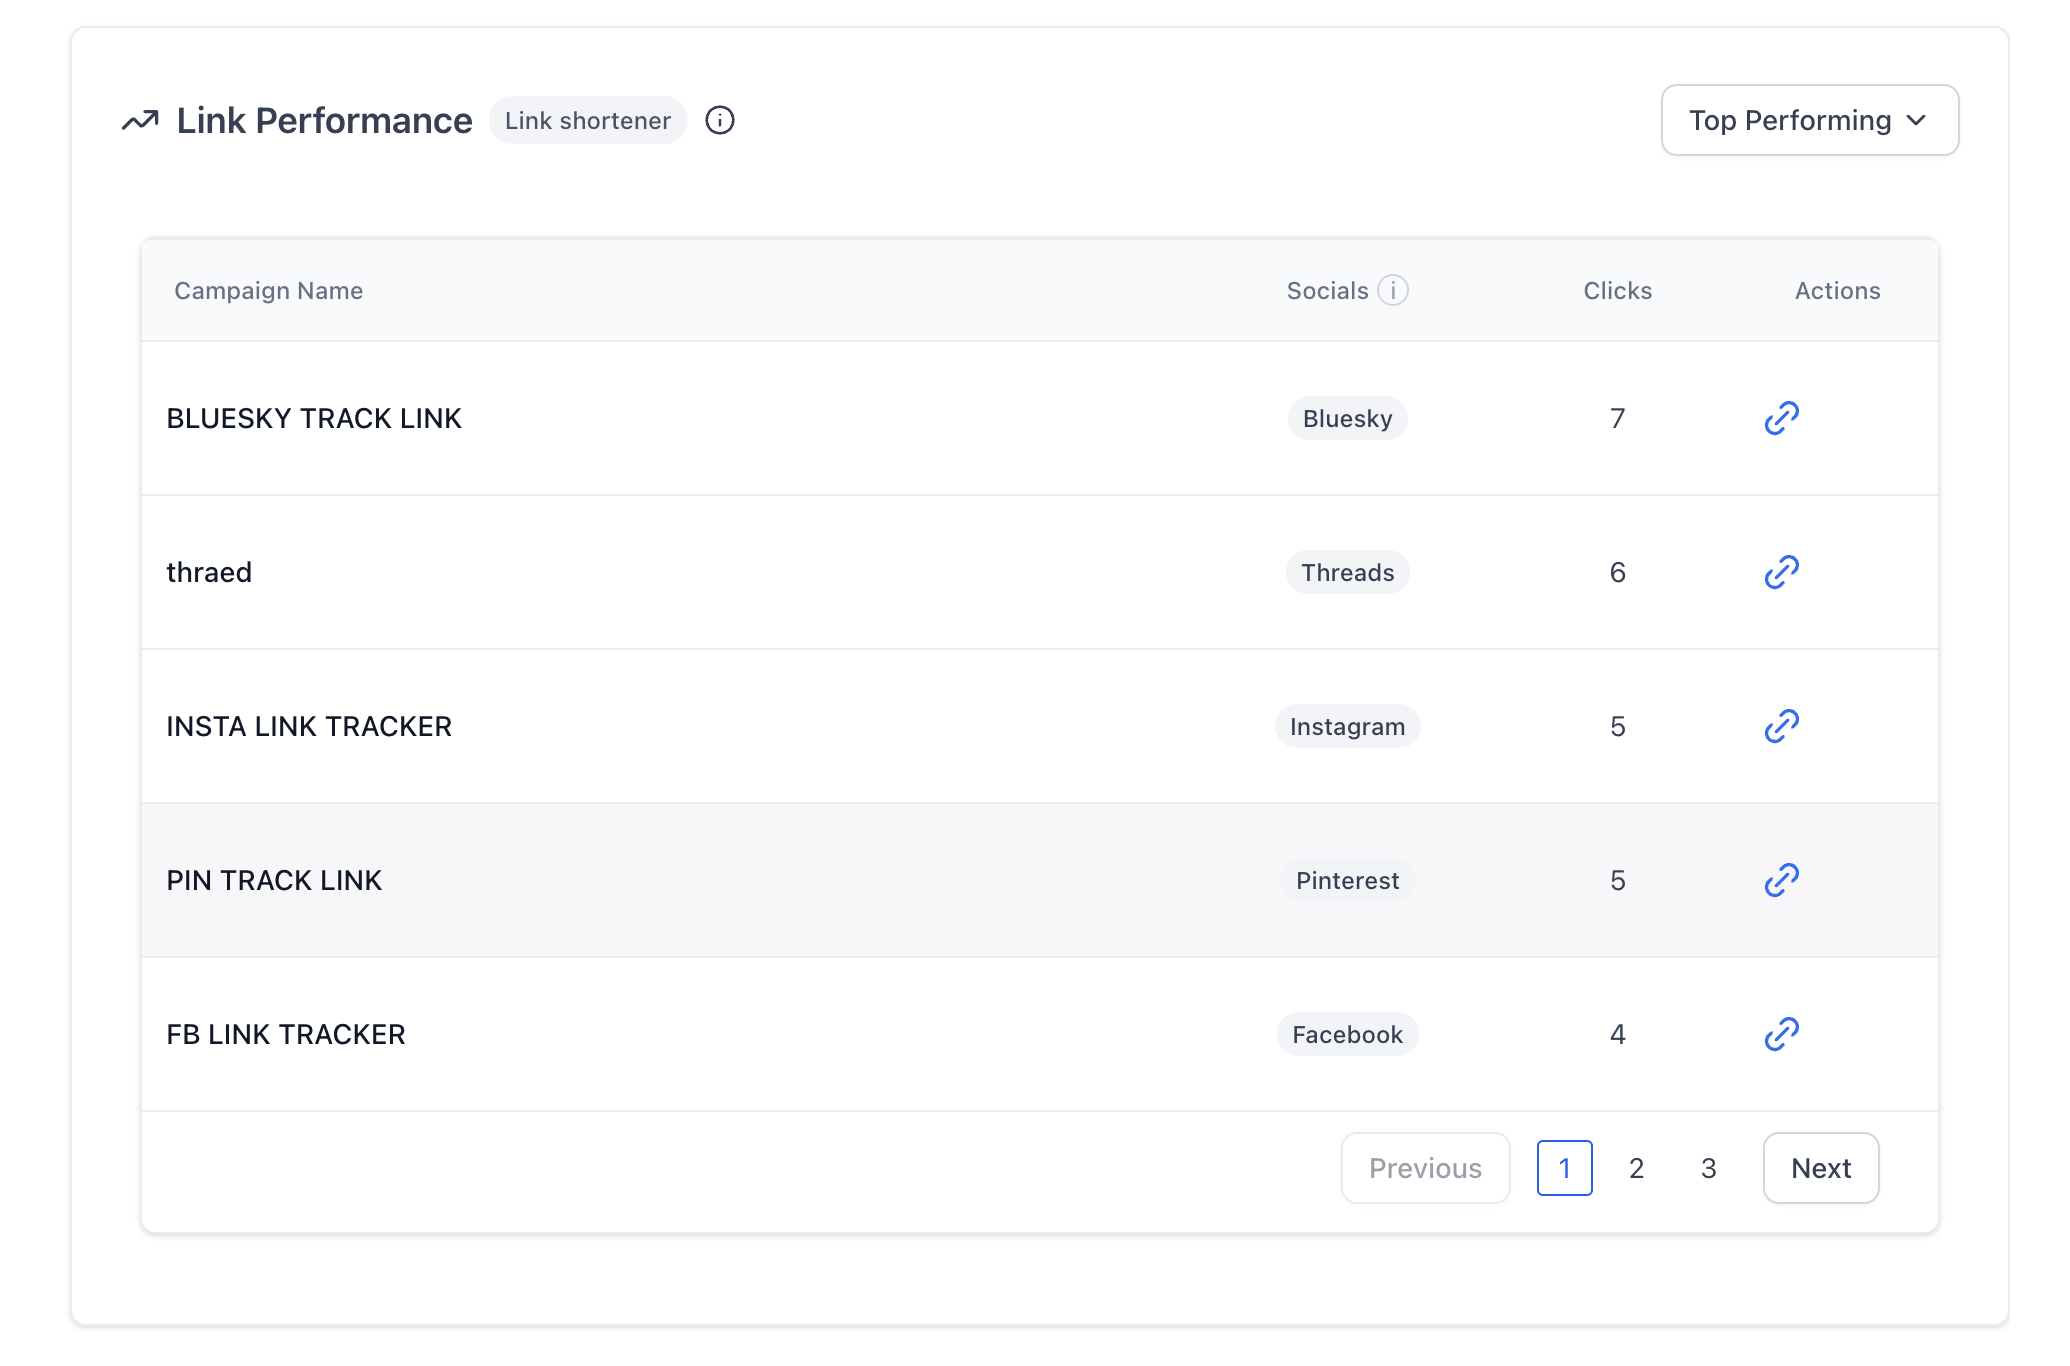
Track the performance of your shortened links across all social platforms, including total clicks per link belonging to a campaign. As with link clicks, tracking is available only for shortened links created through the Social Planner link shortener.
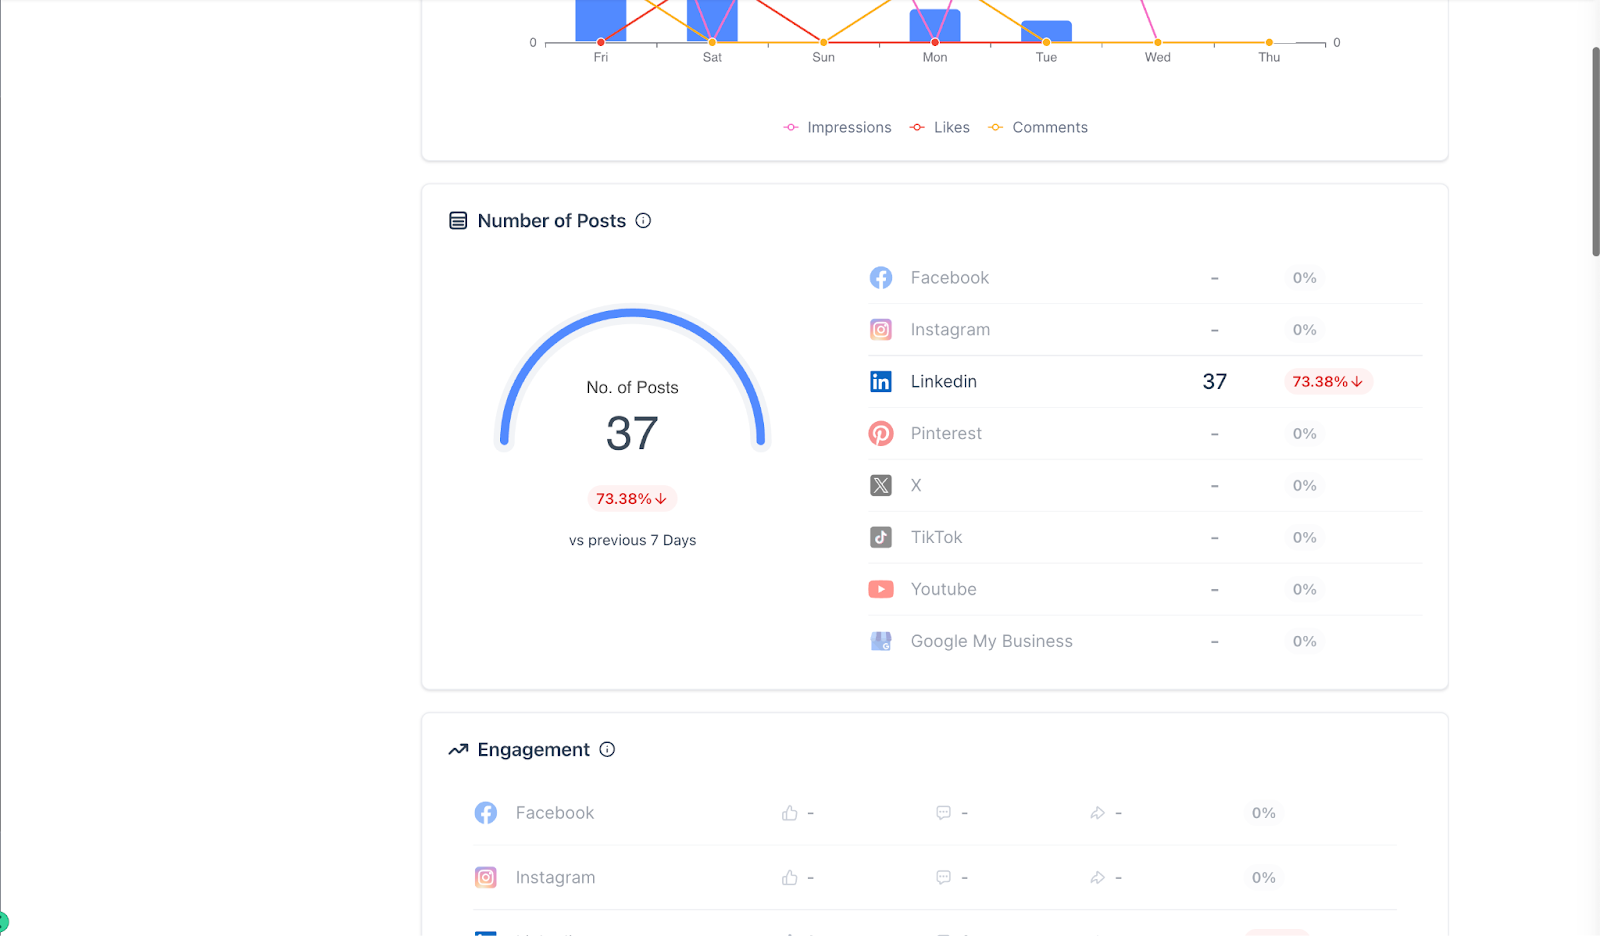
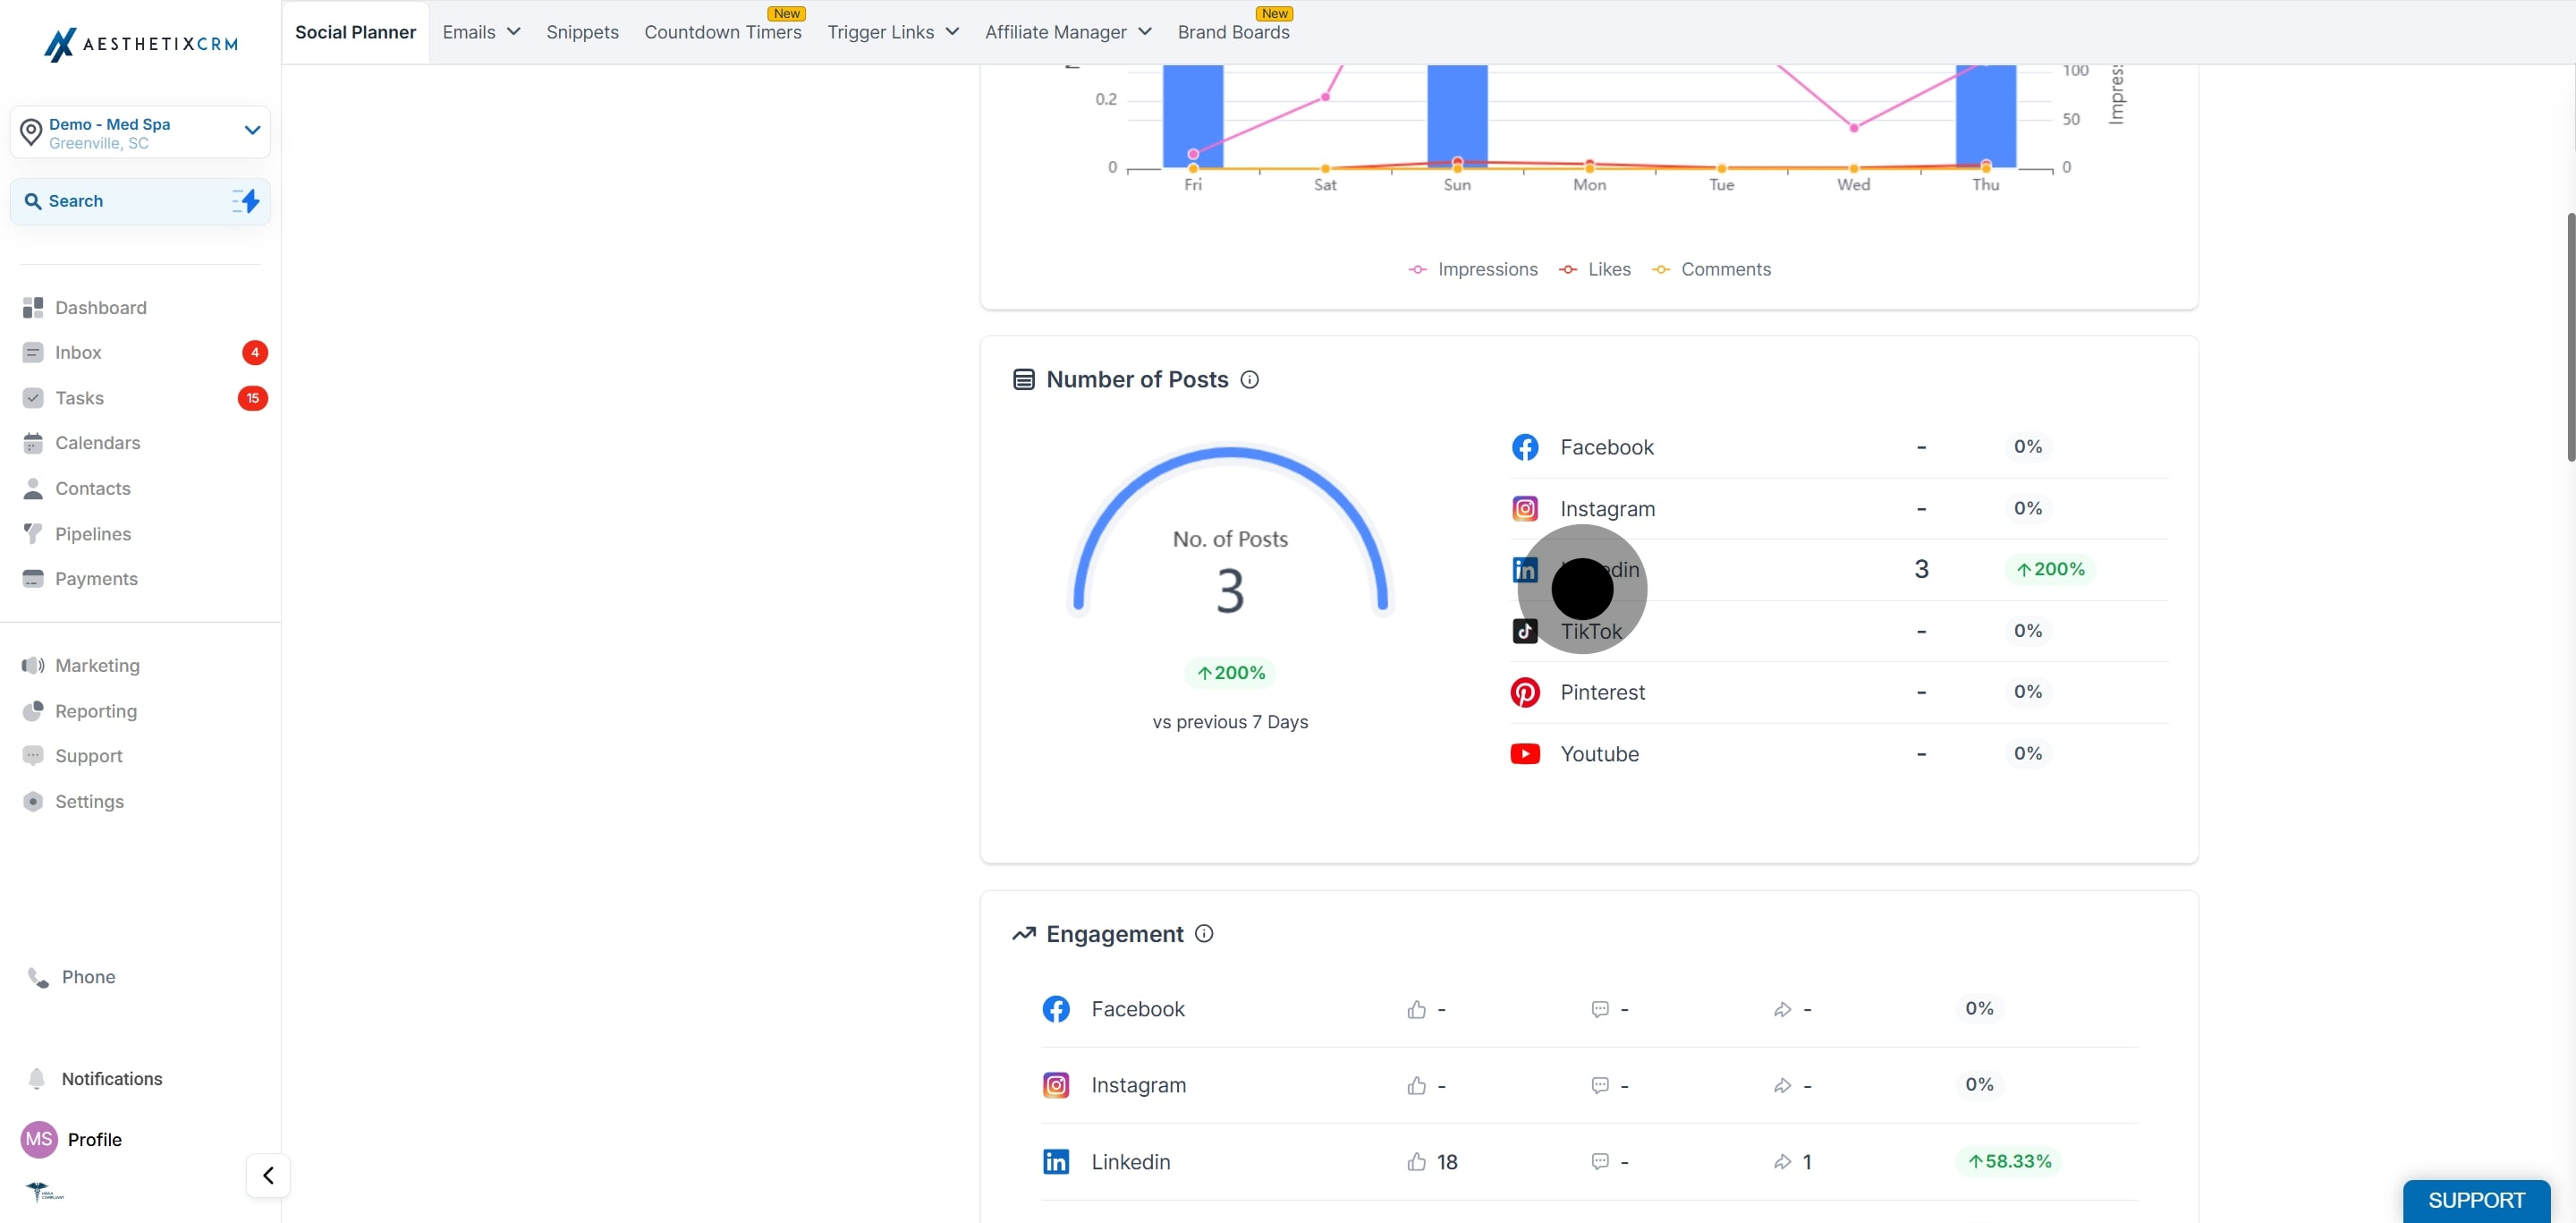
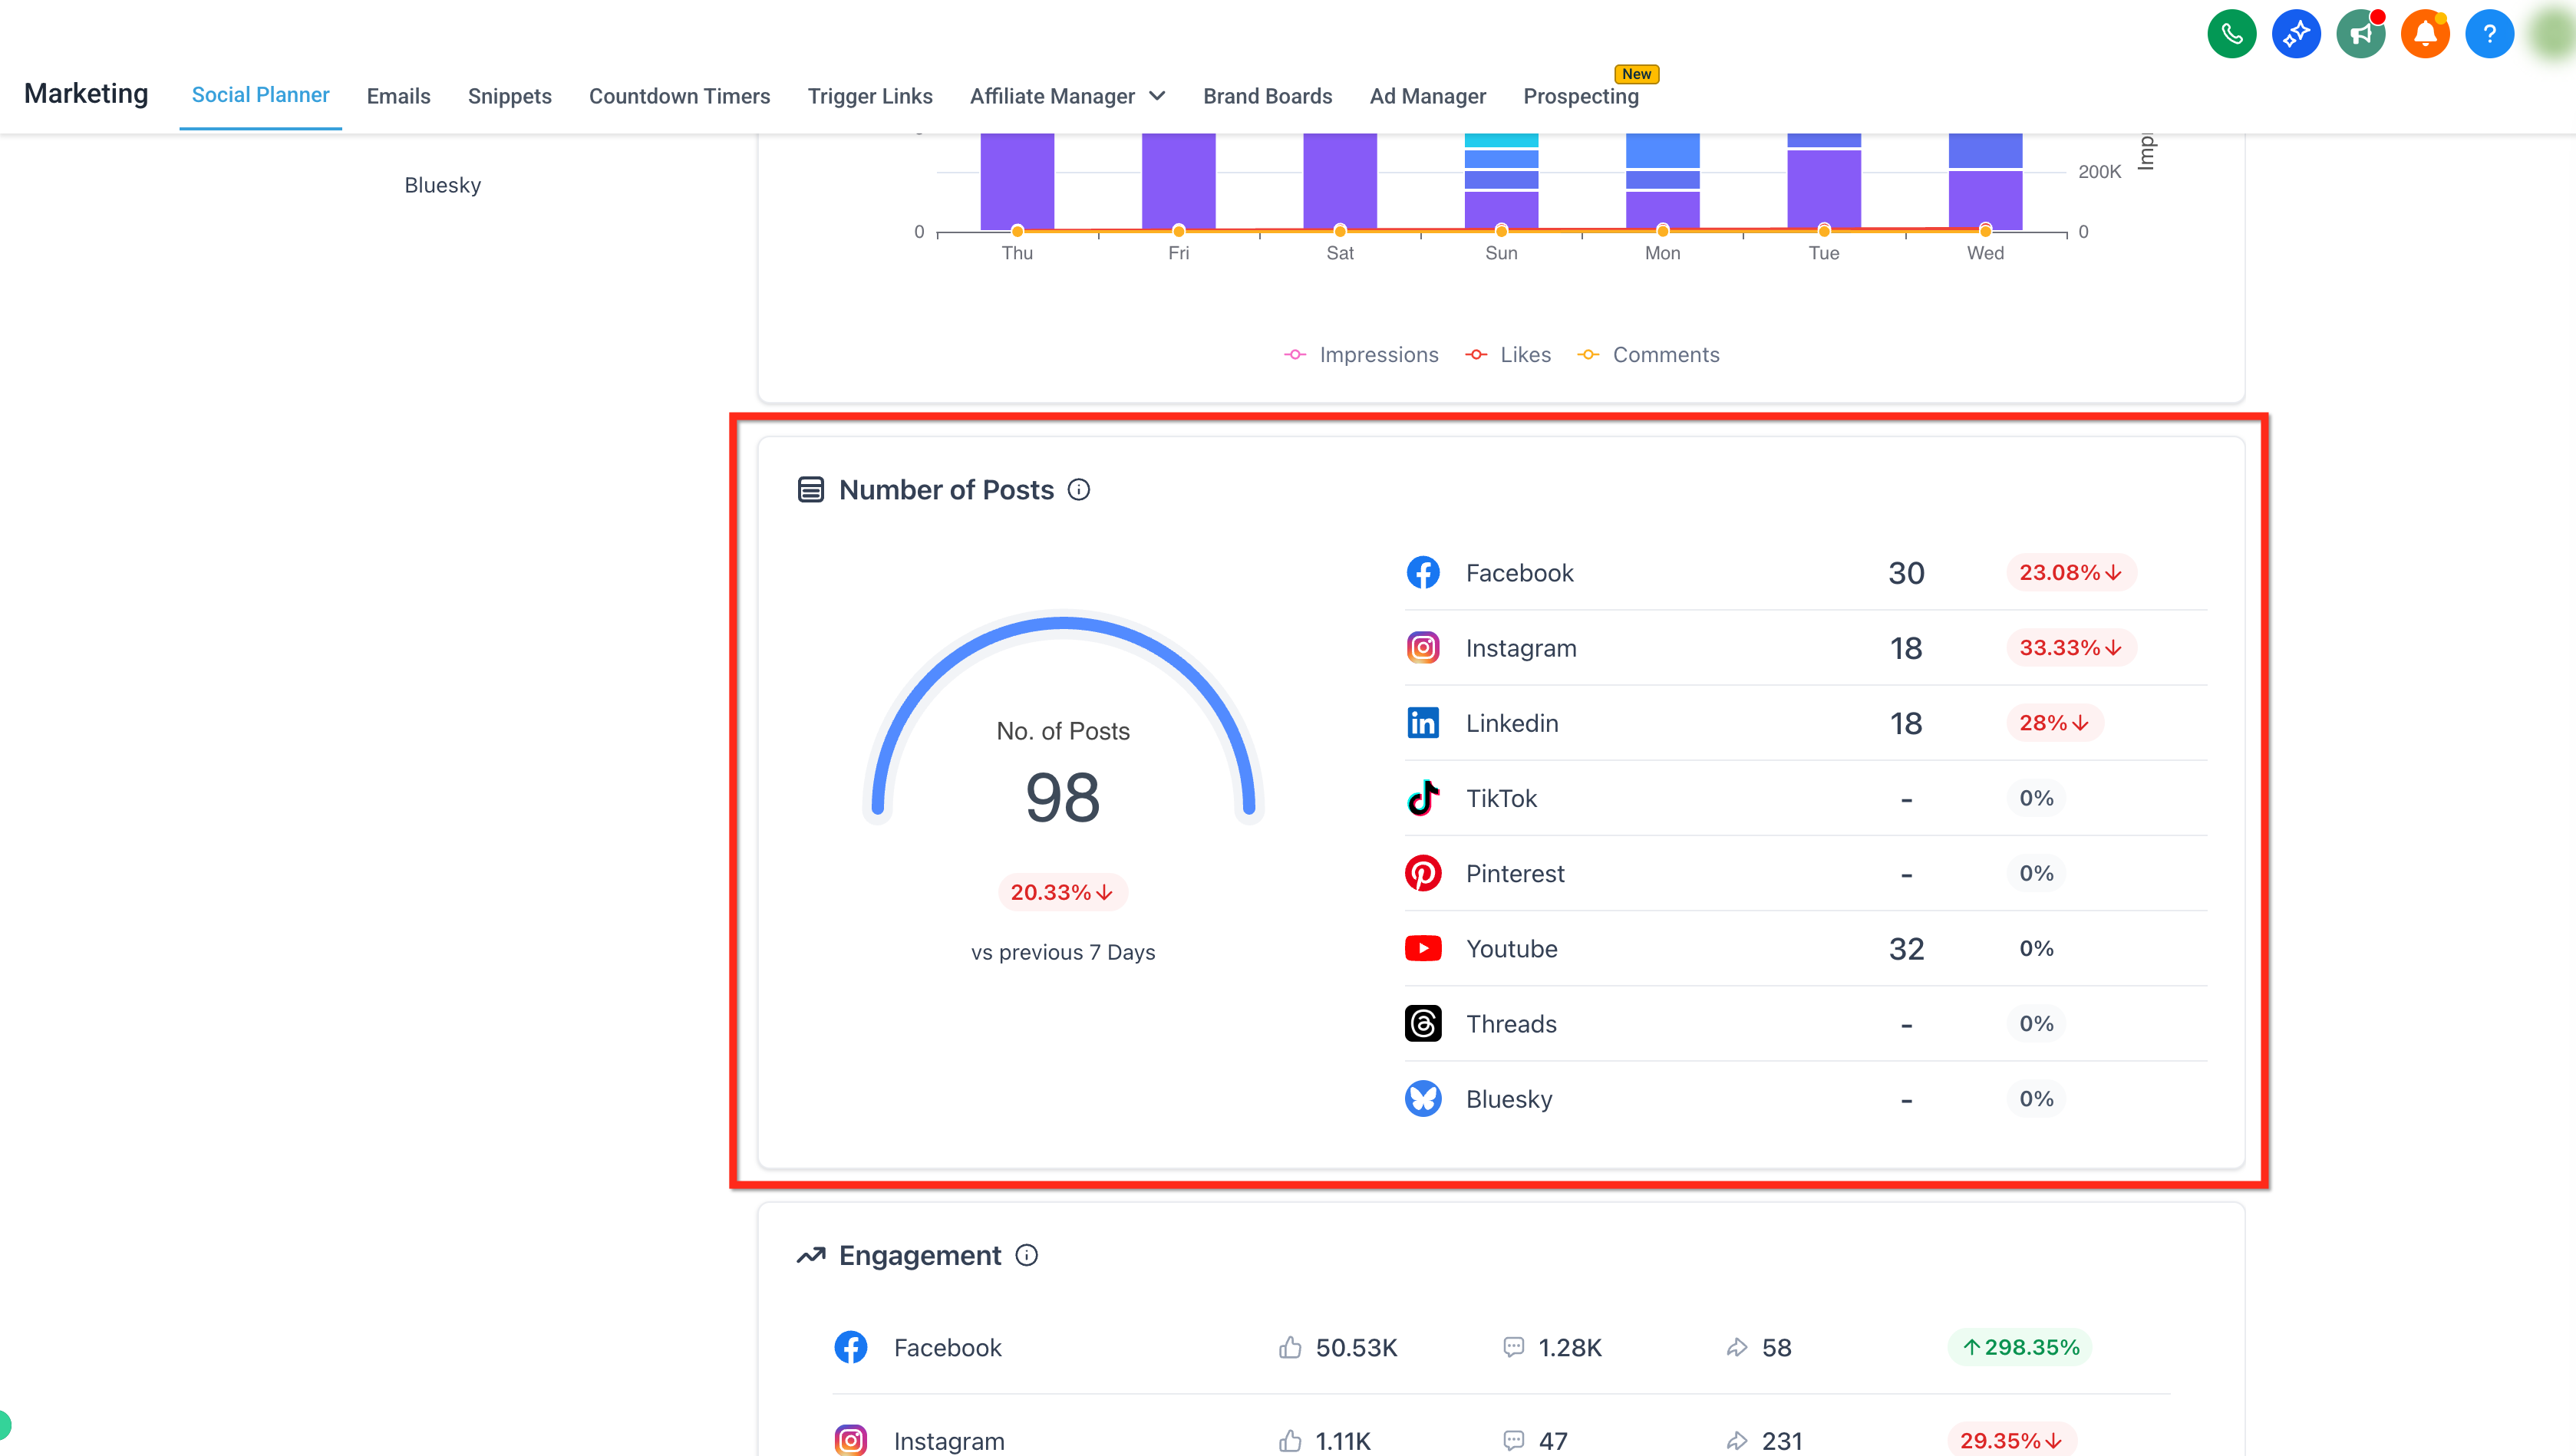
Shows the platform-wise total number of posts published across all selected social accounts, comparing the current week's posts to the previous week's.
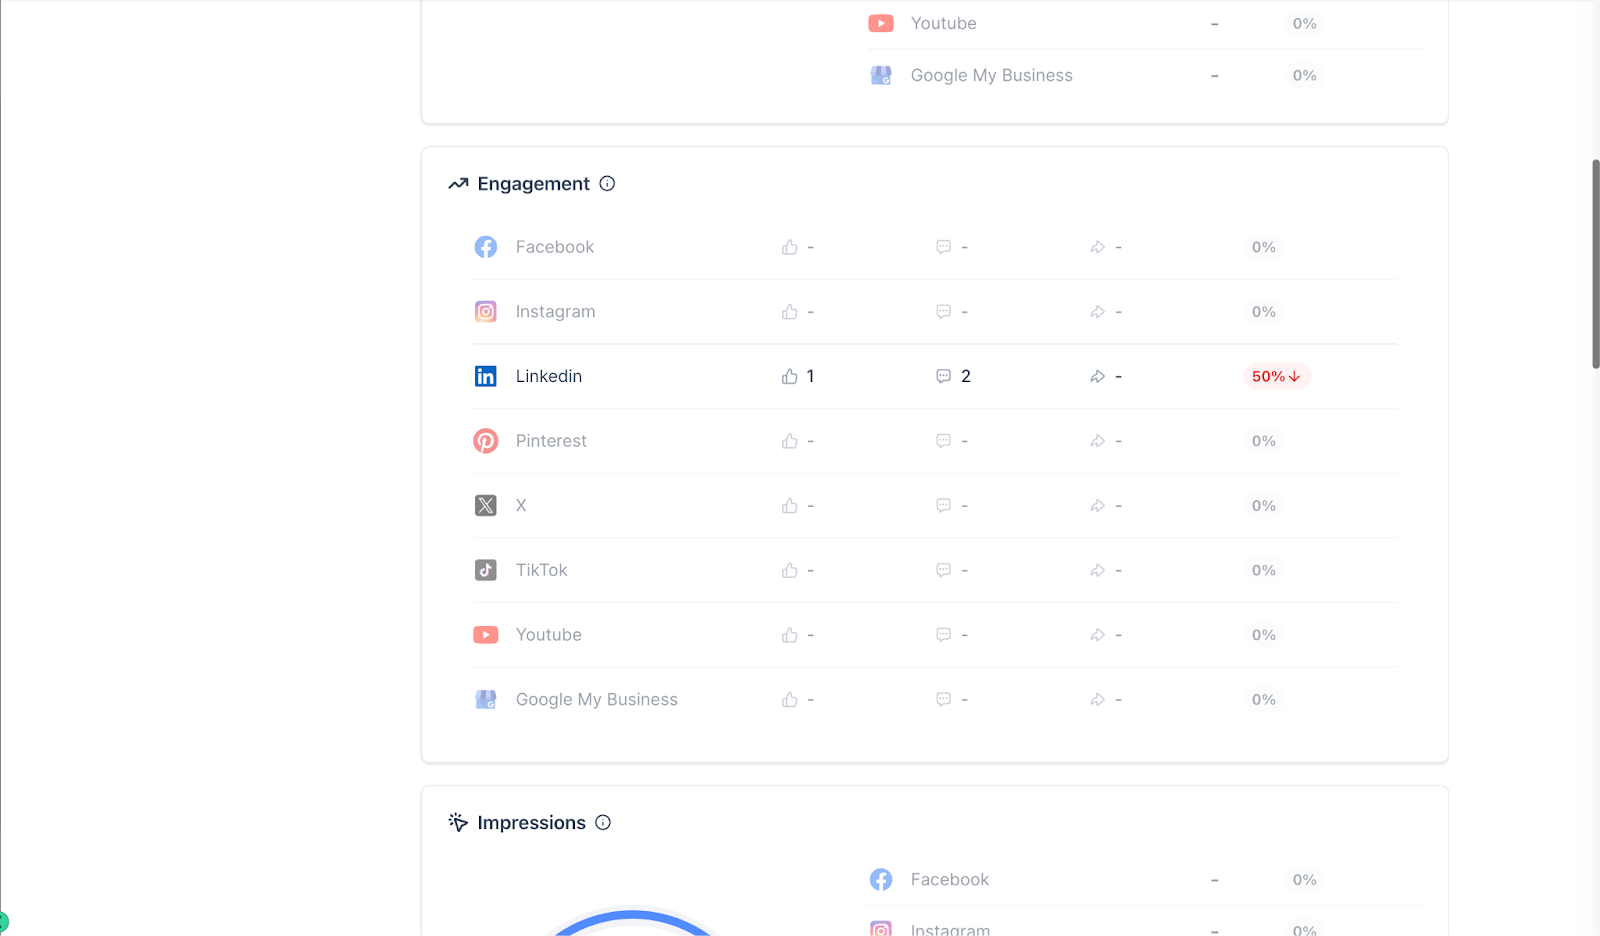
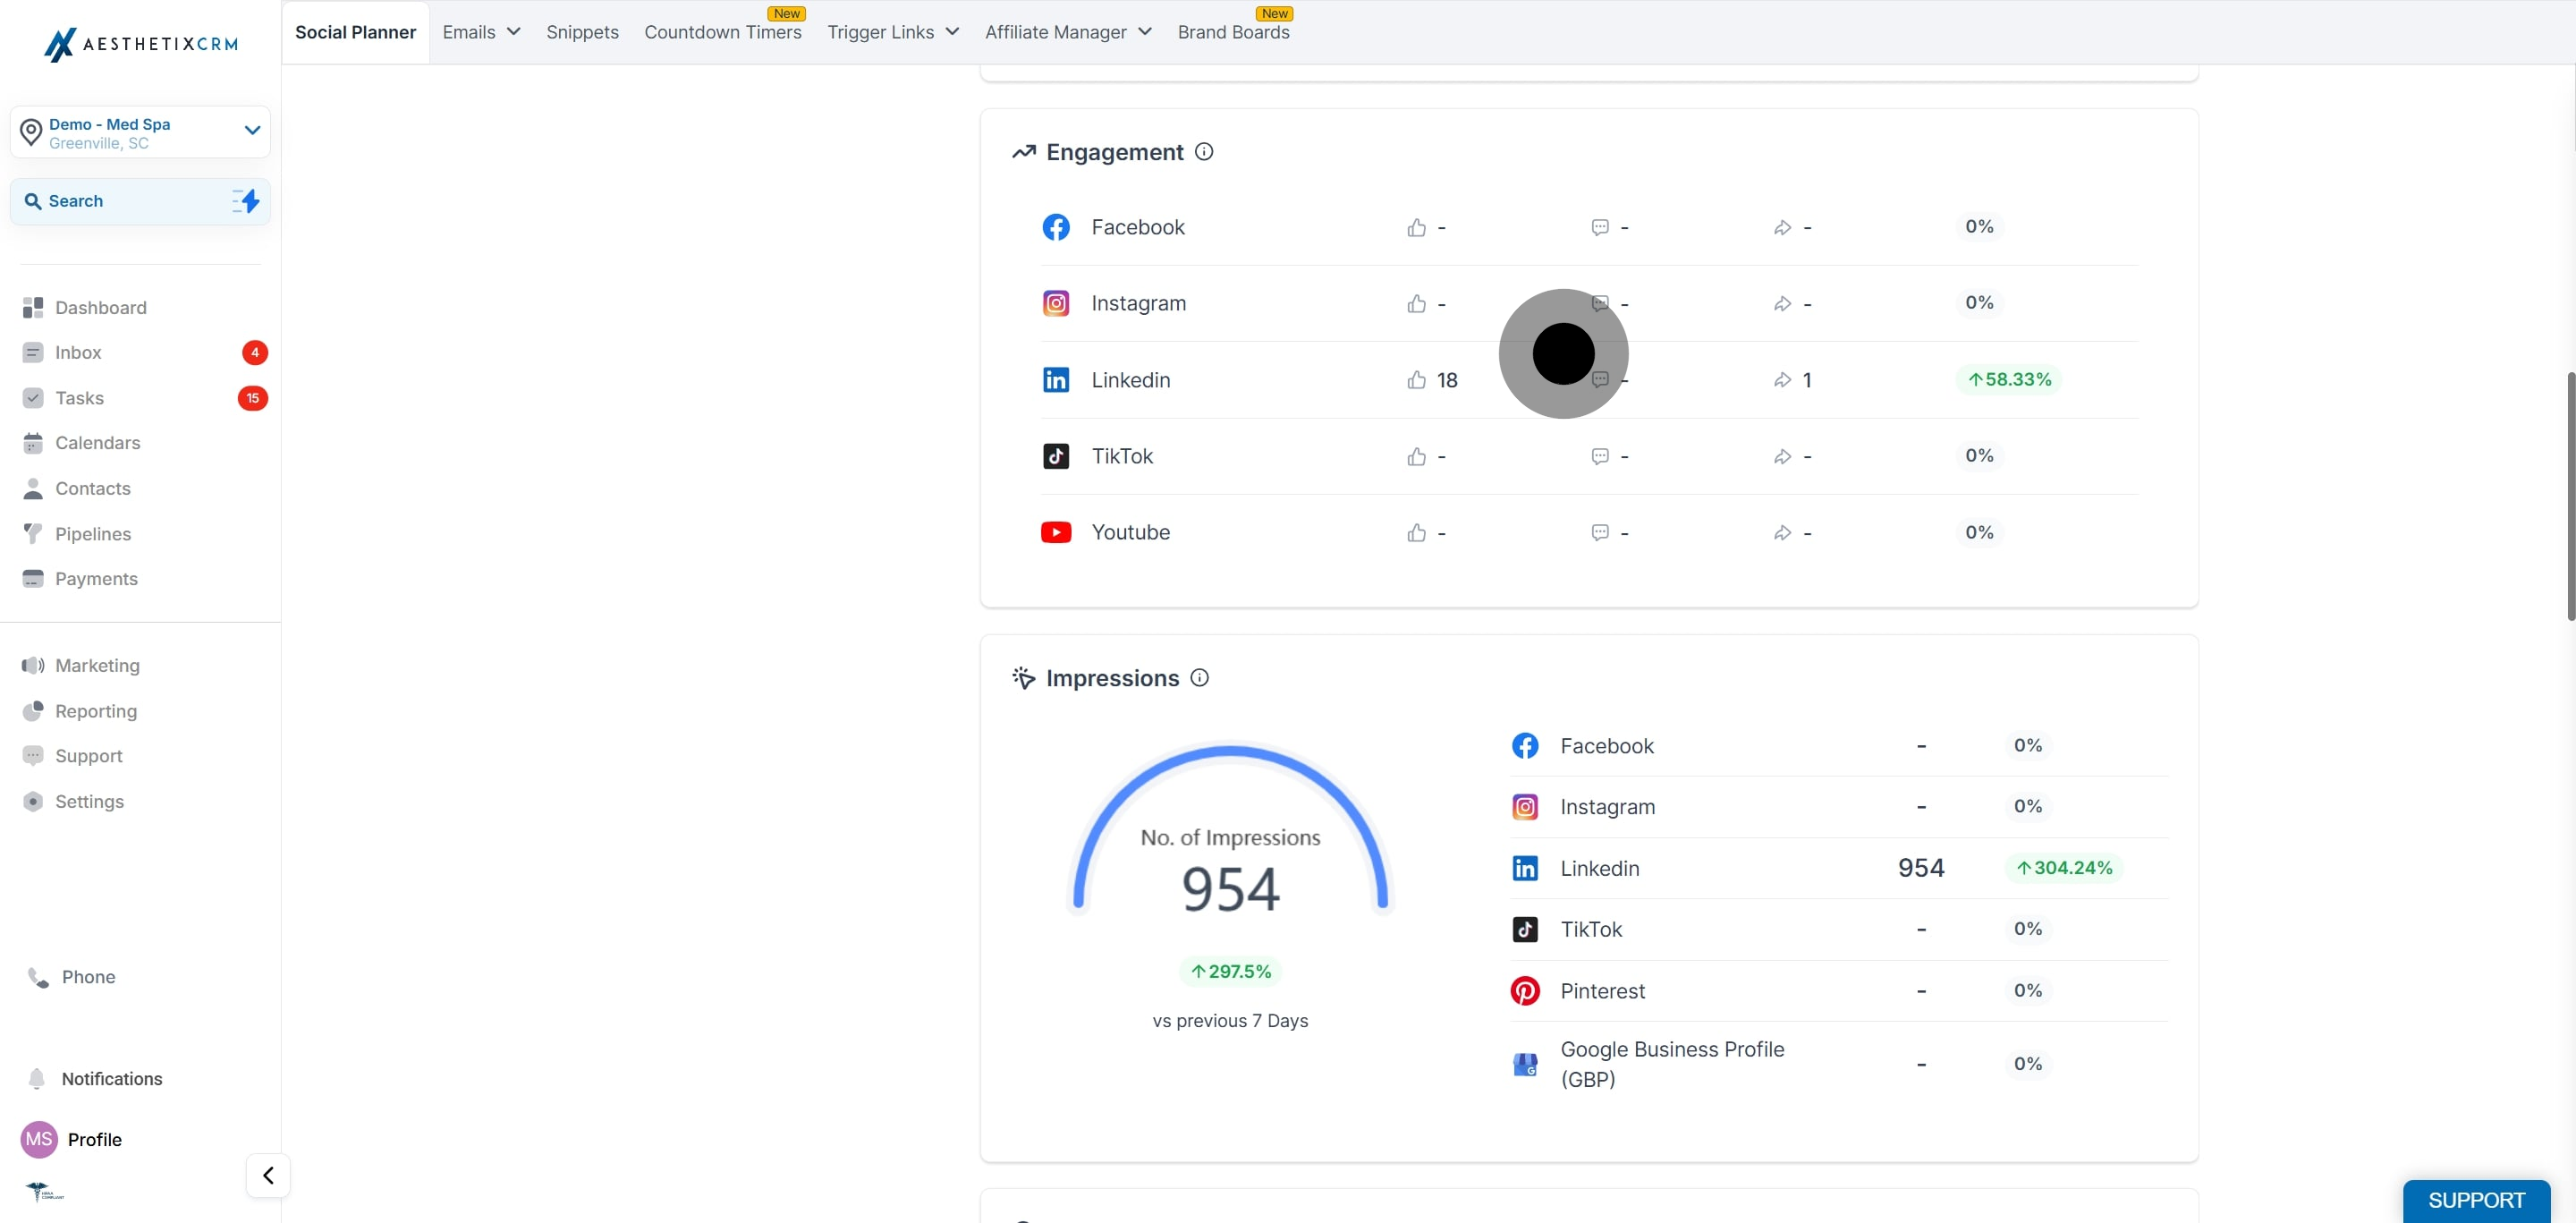
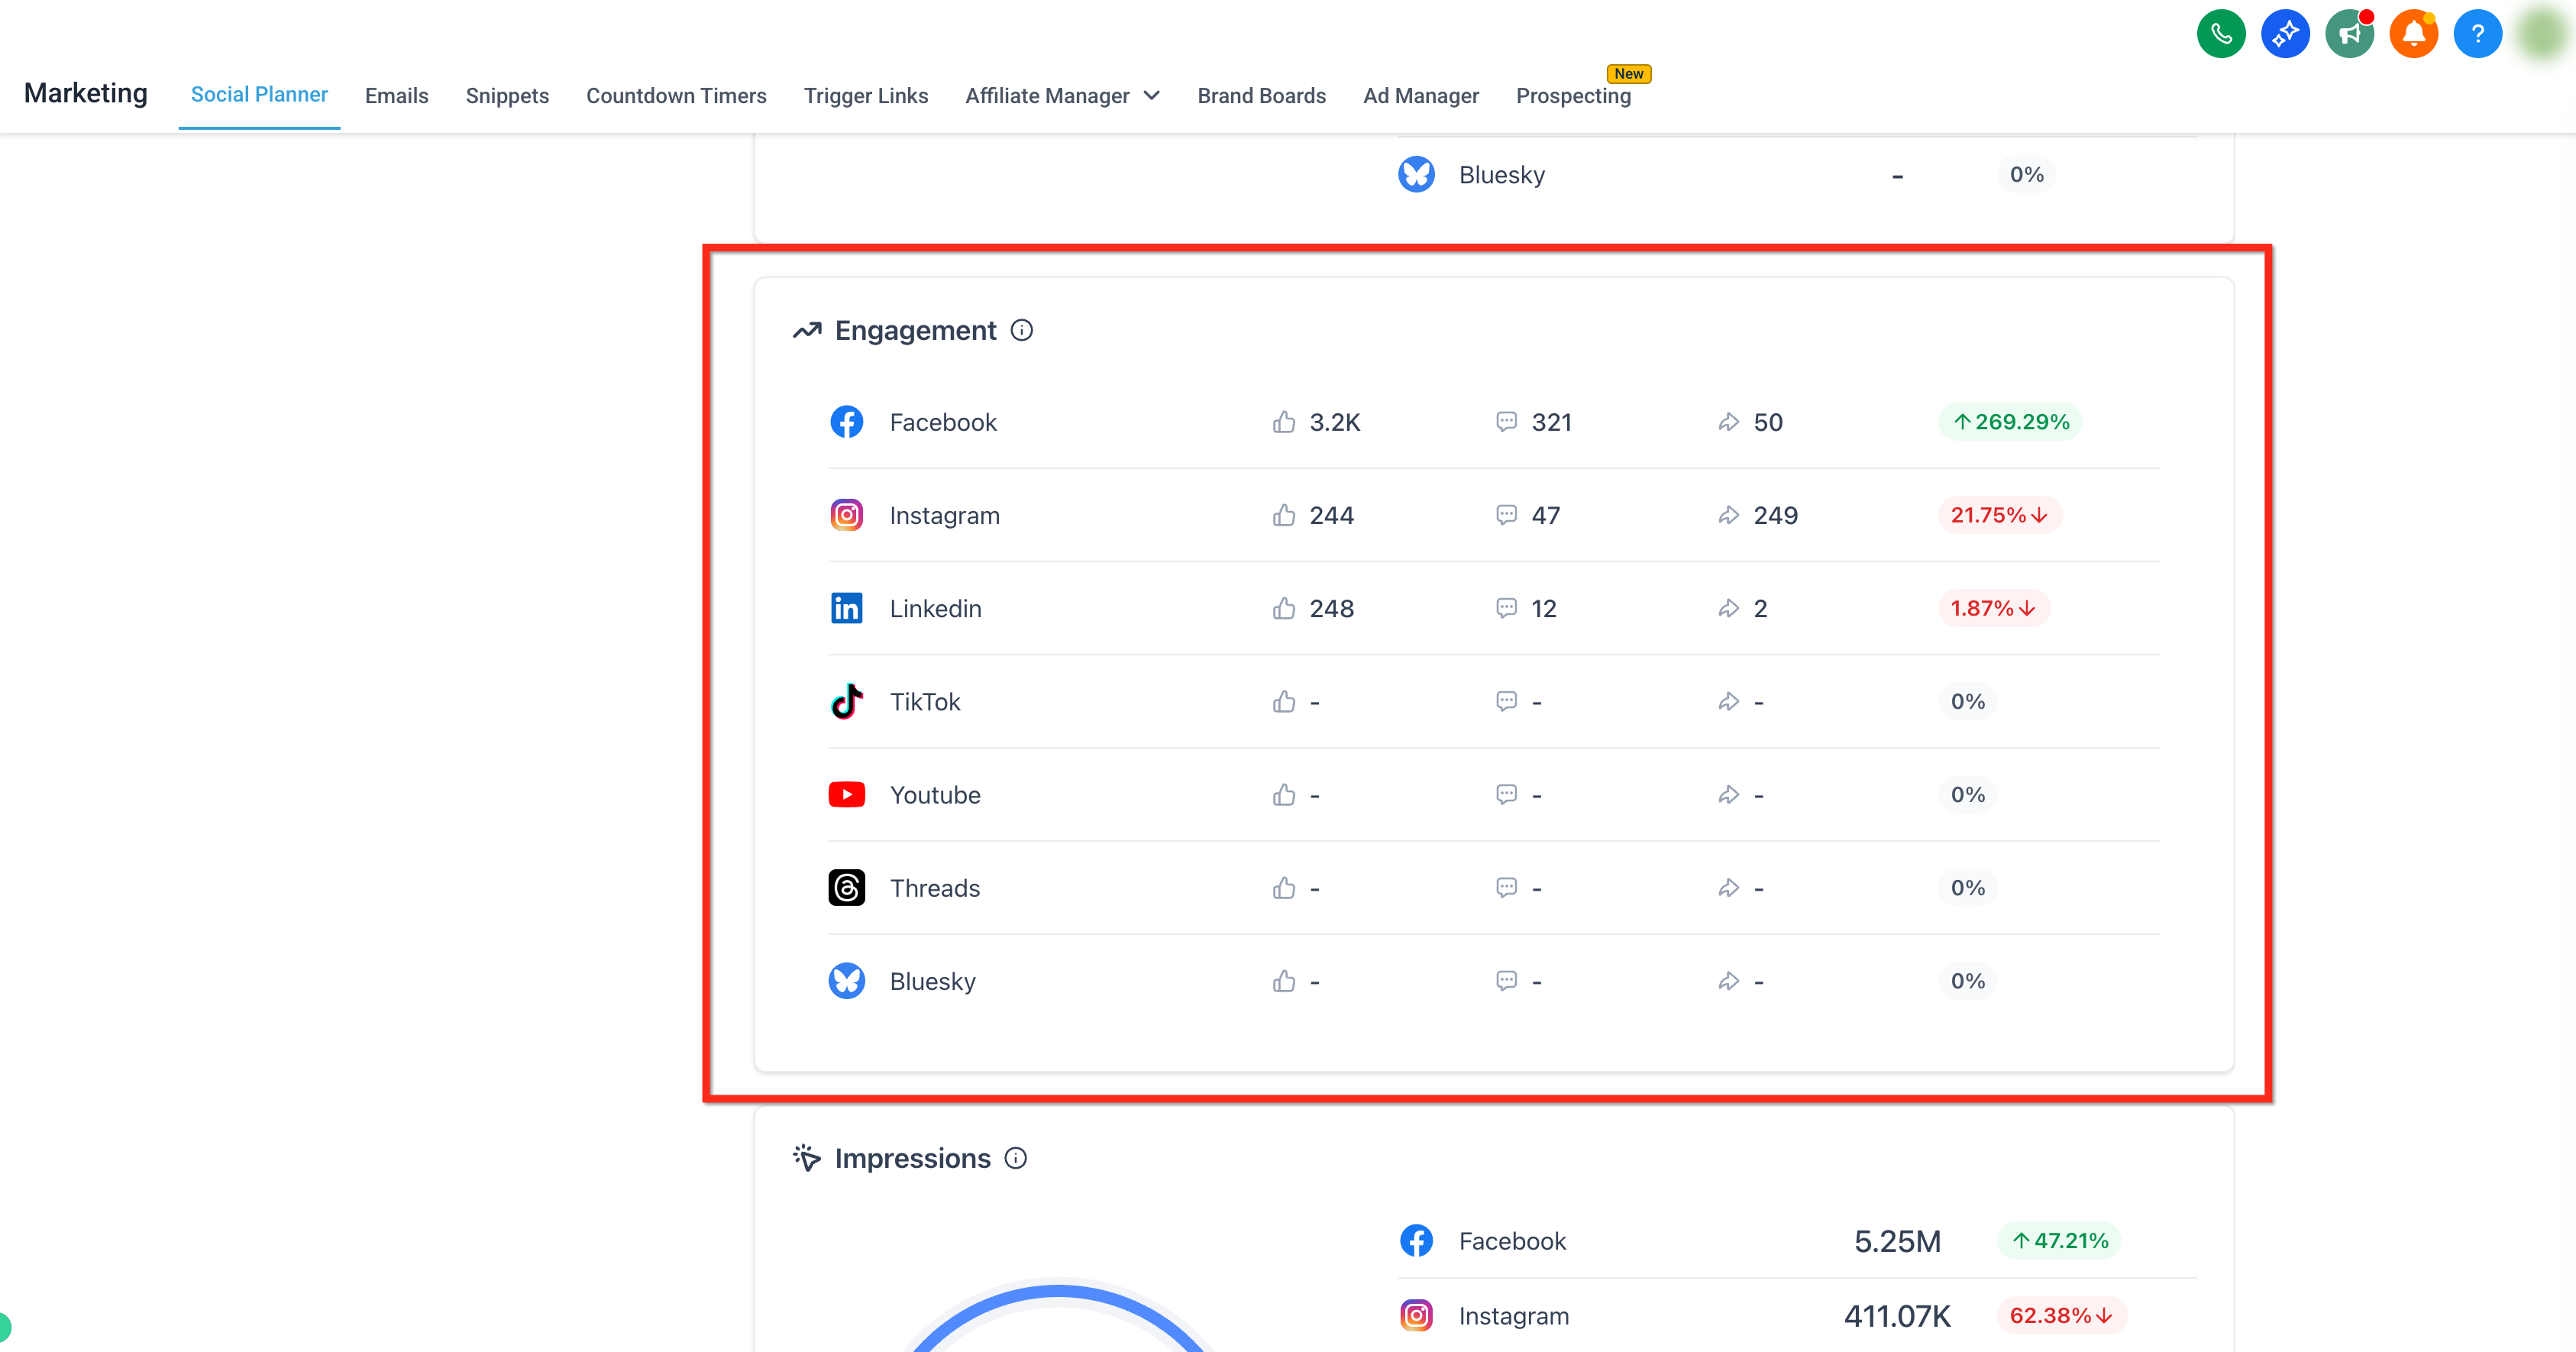
The unique number of likes, comments, and shares received by published posts, broken down by platform. The engagement percentage reflects the change in this week's data compared to the previous week.
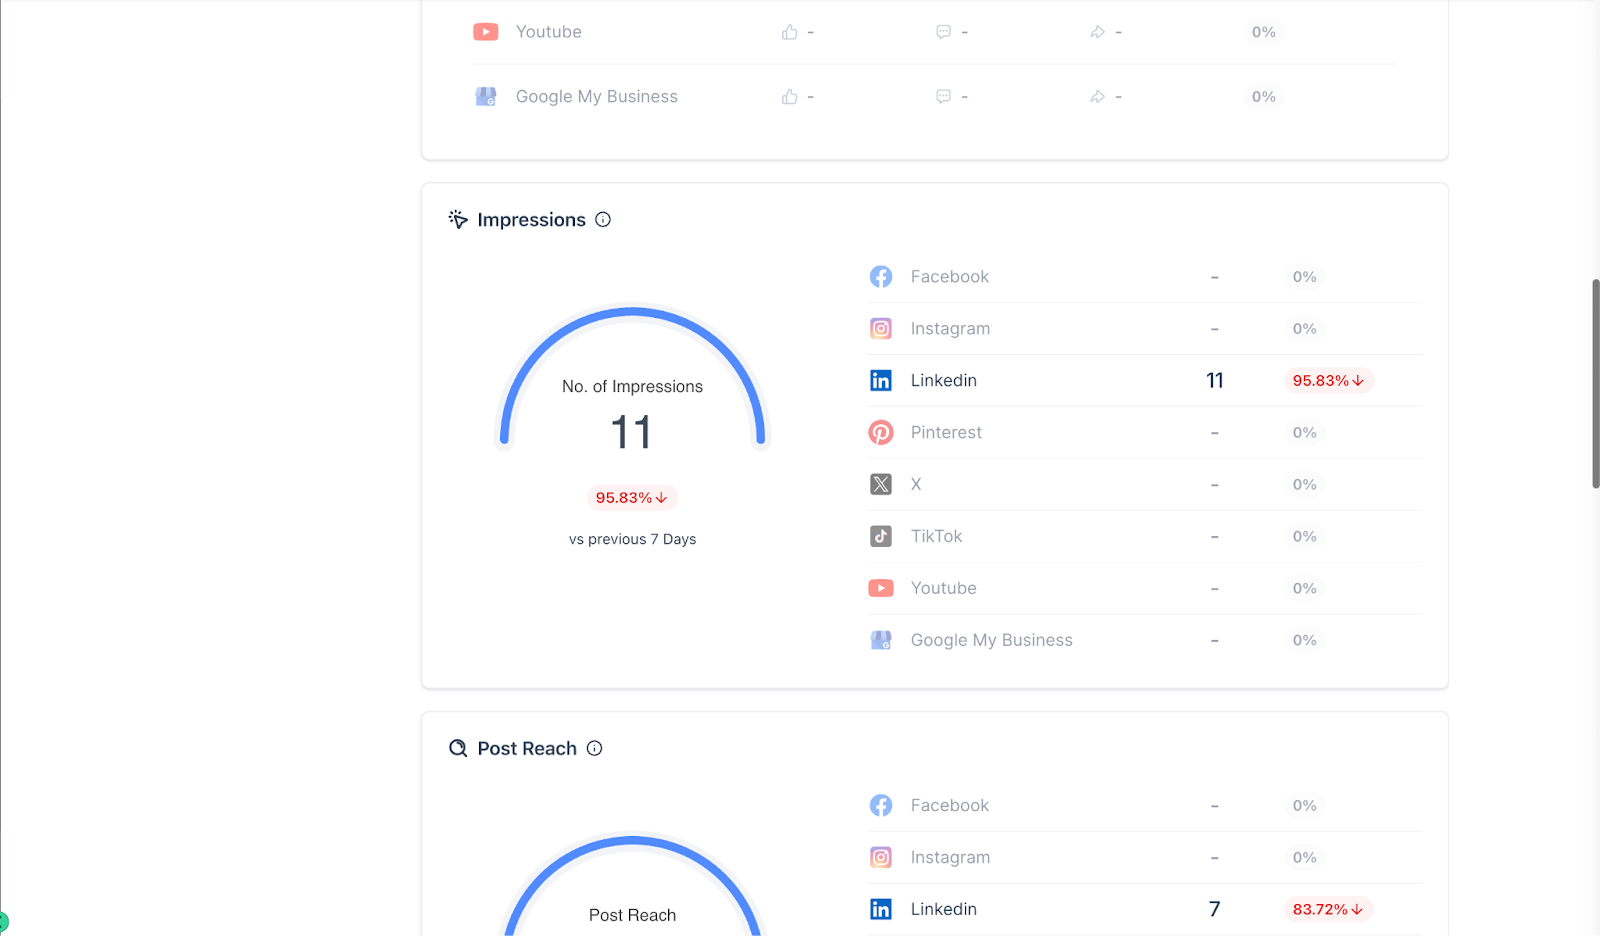
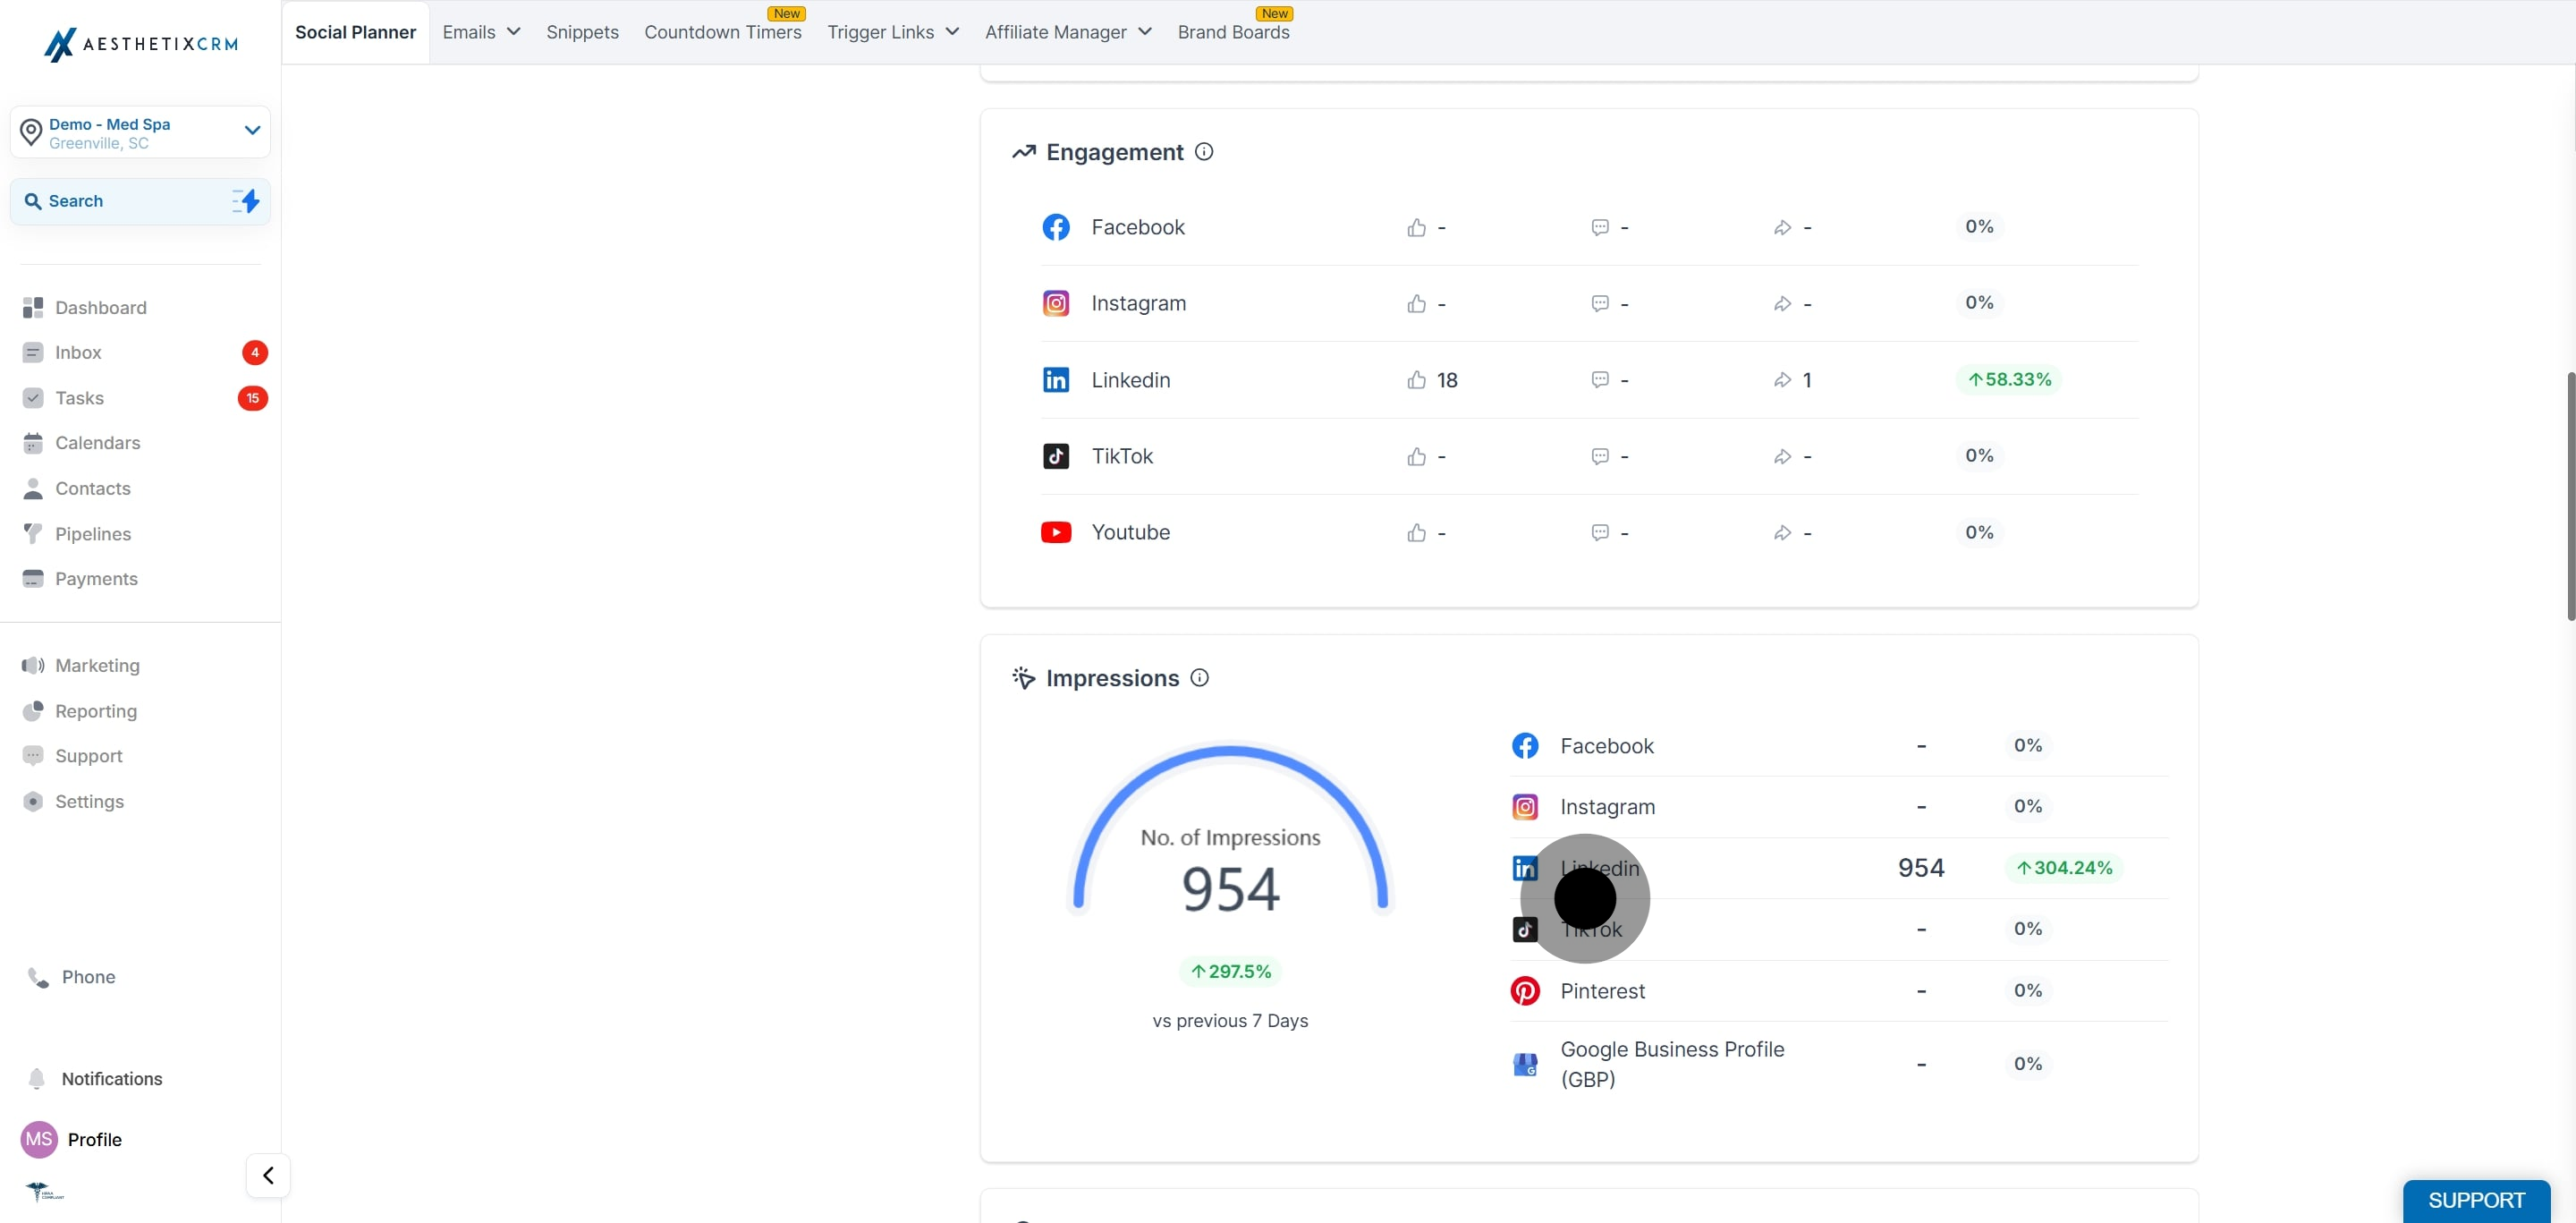
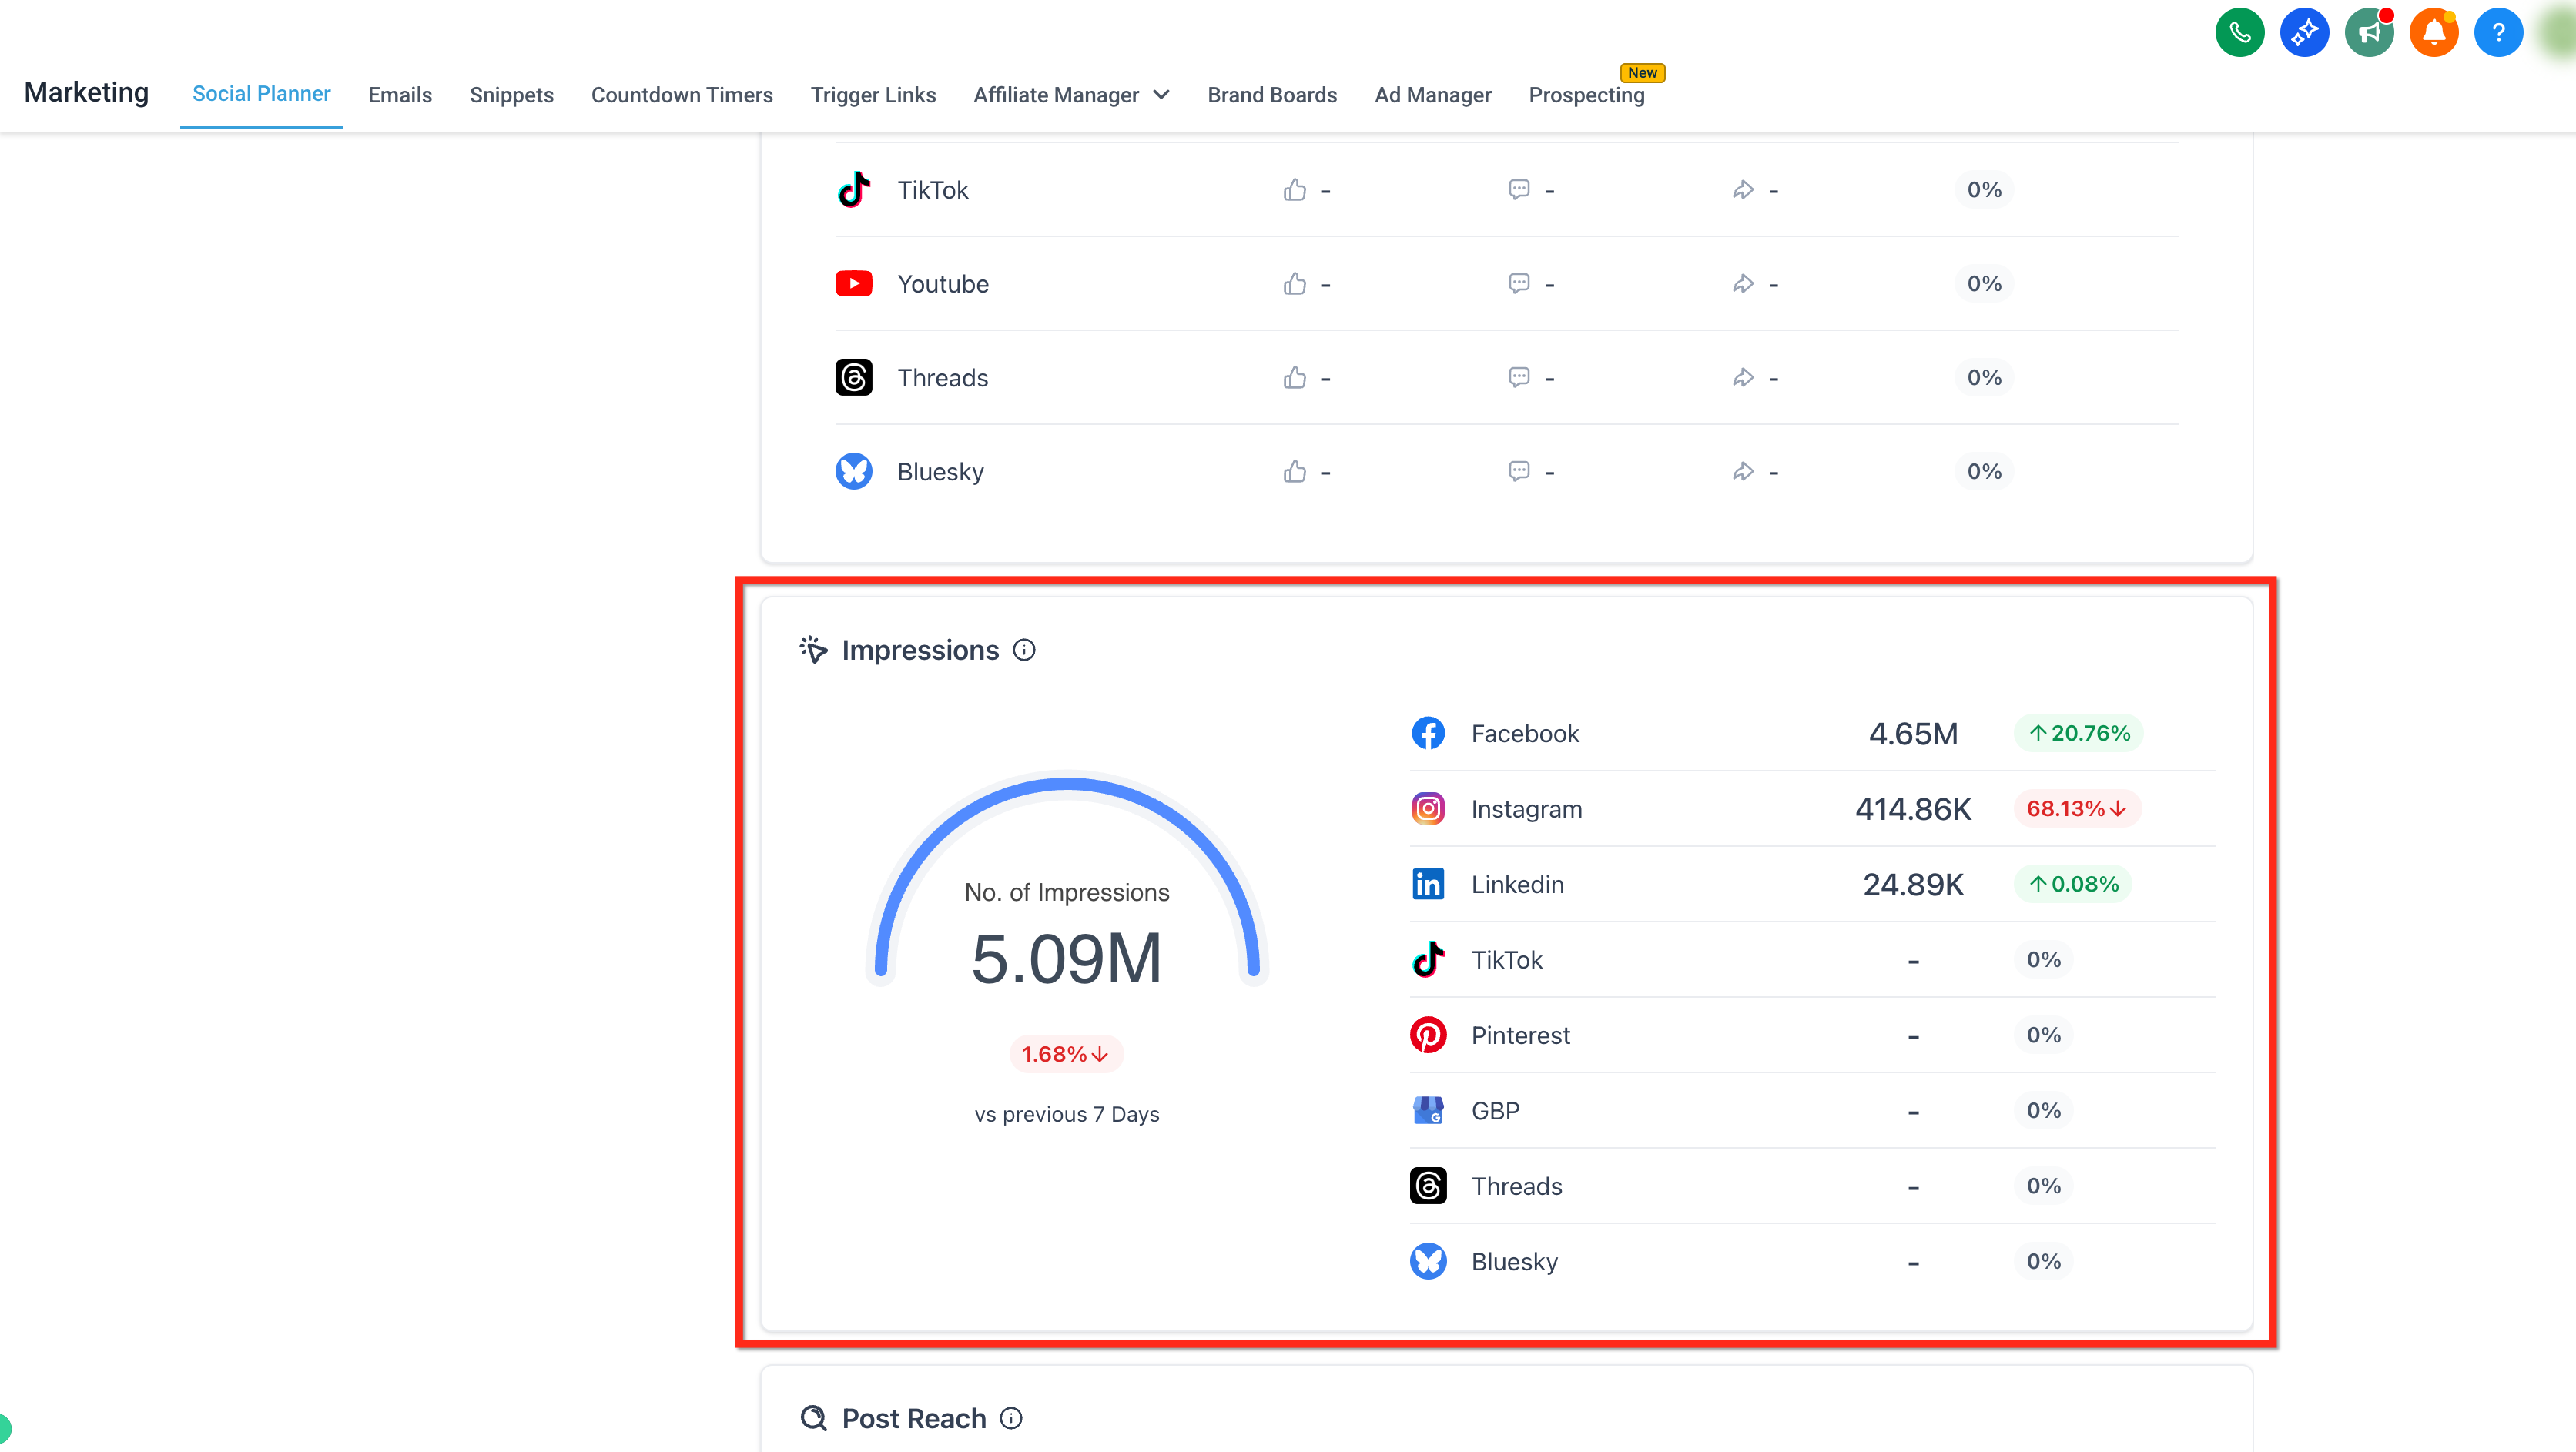
Impressions shows the number of times any published post was displayed on a person's screen. The impression percentage reflects the change in this week's data compared to the previous week.

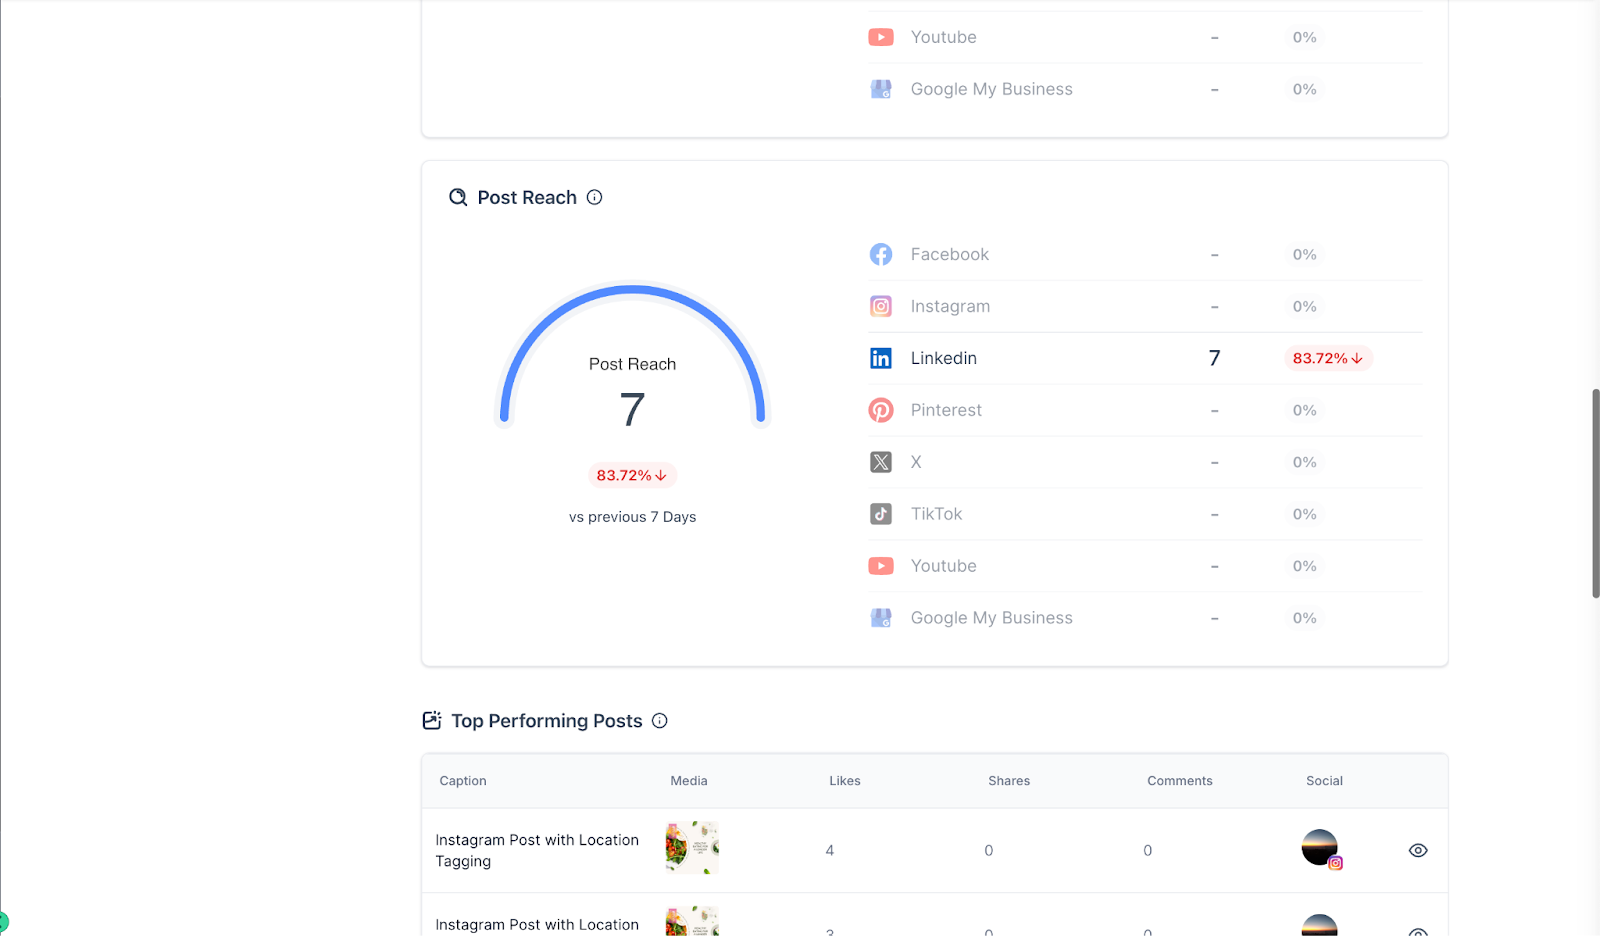
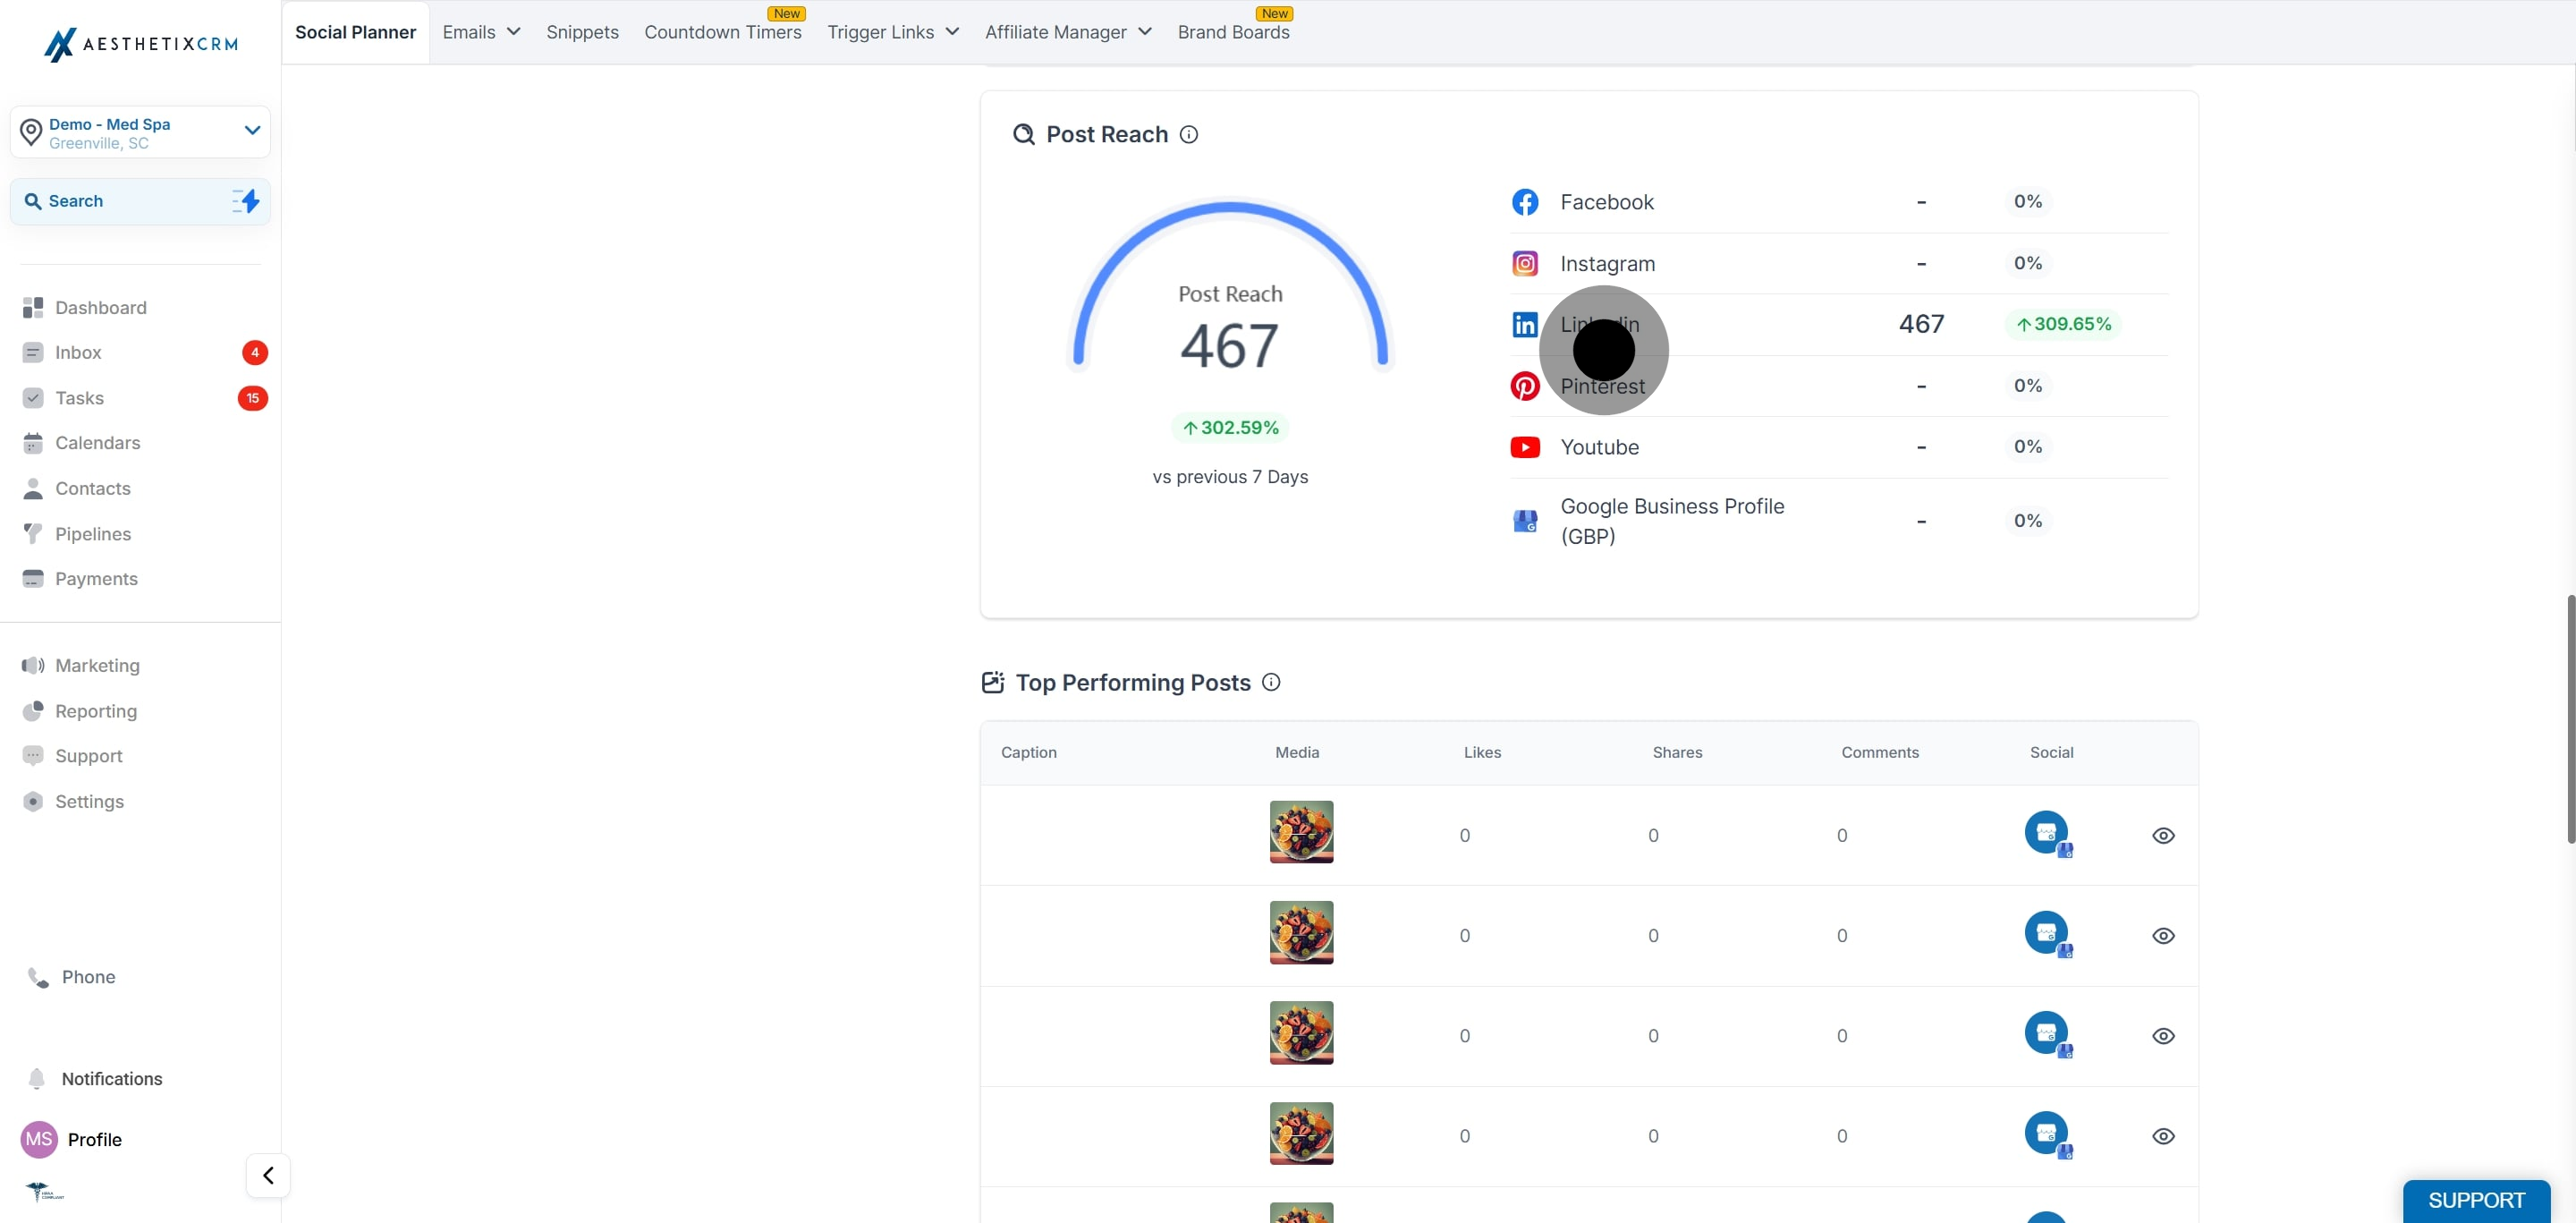
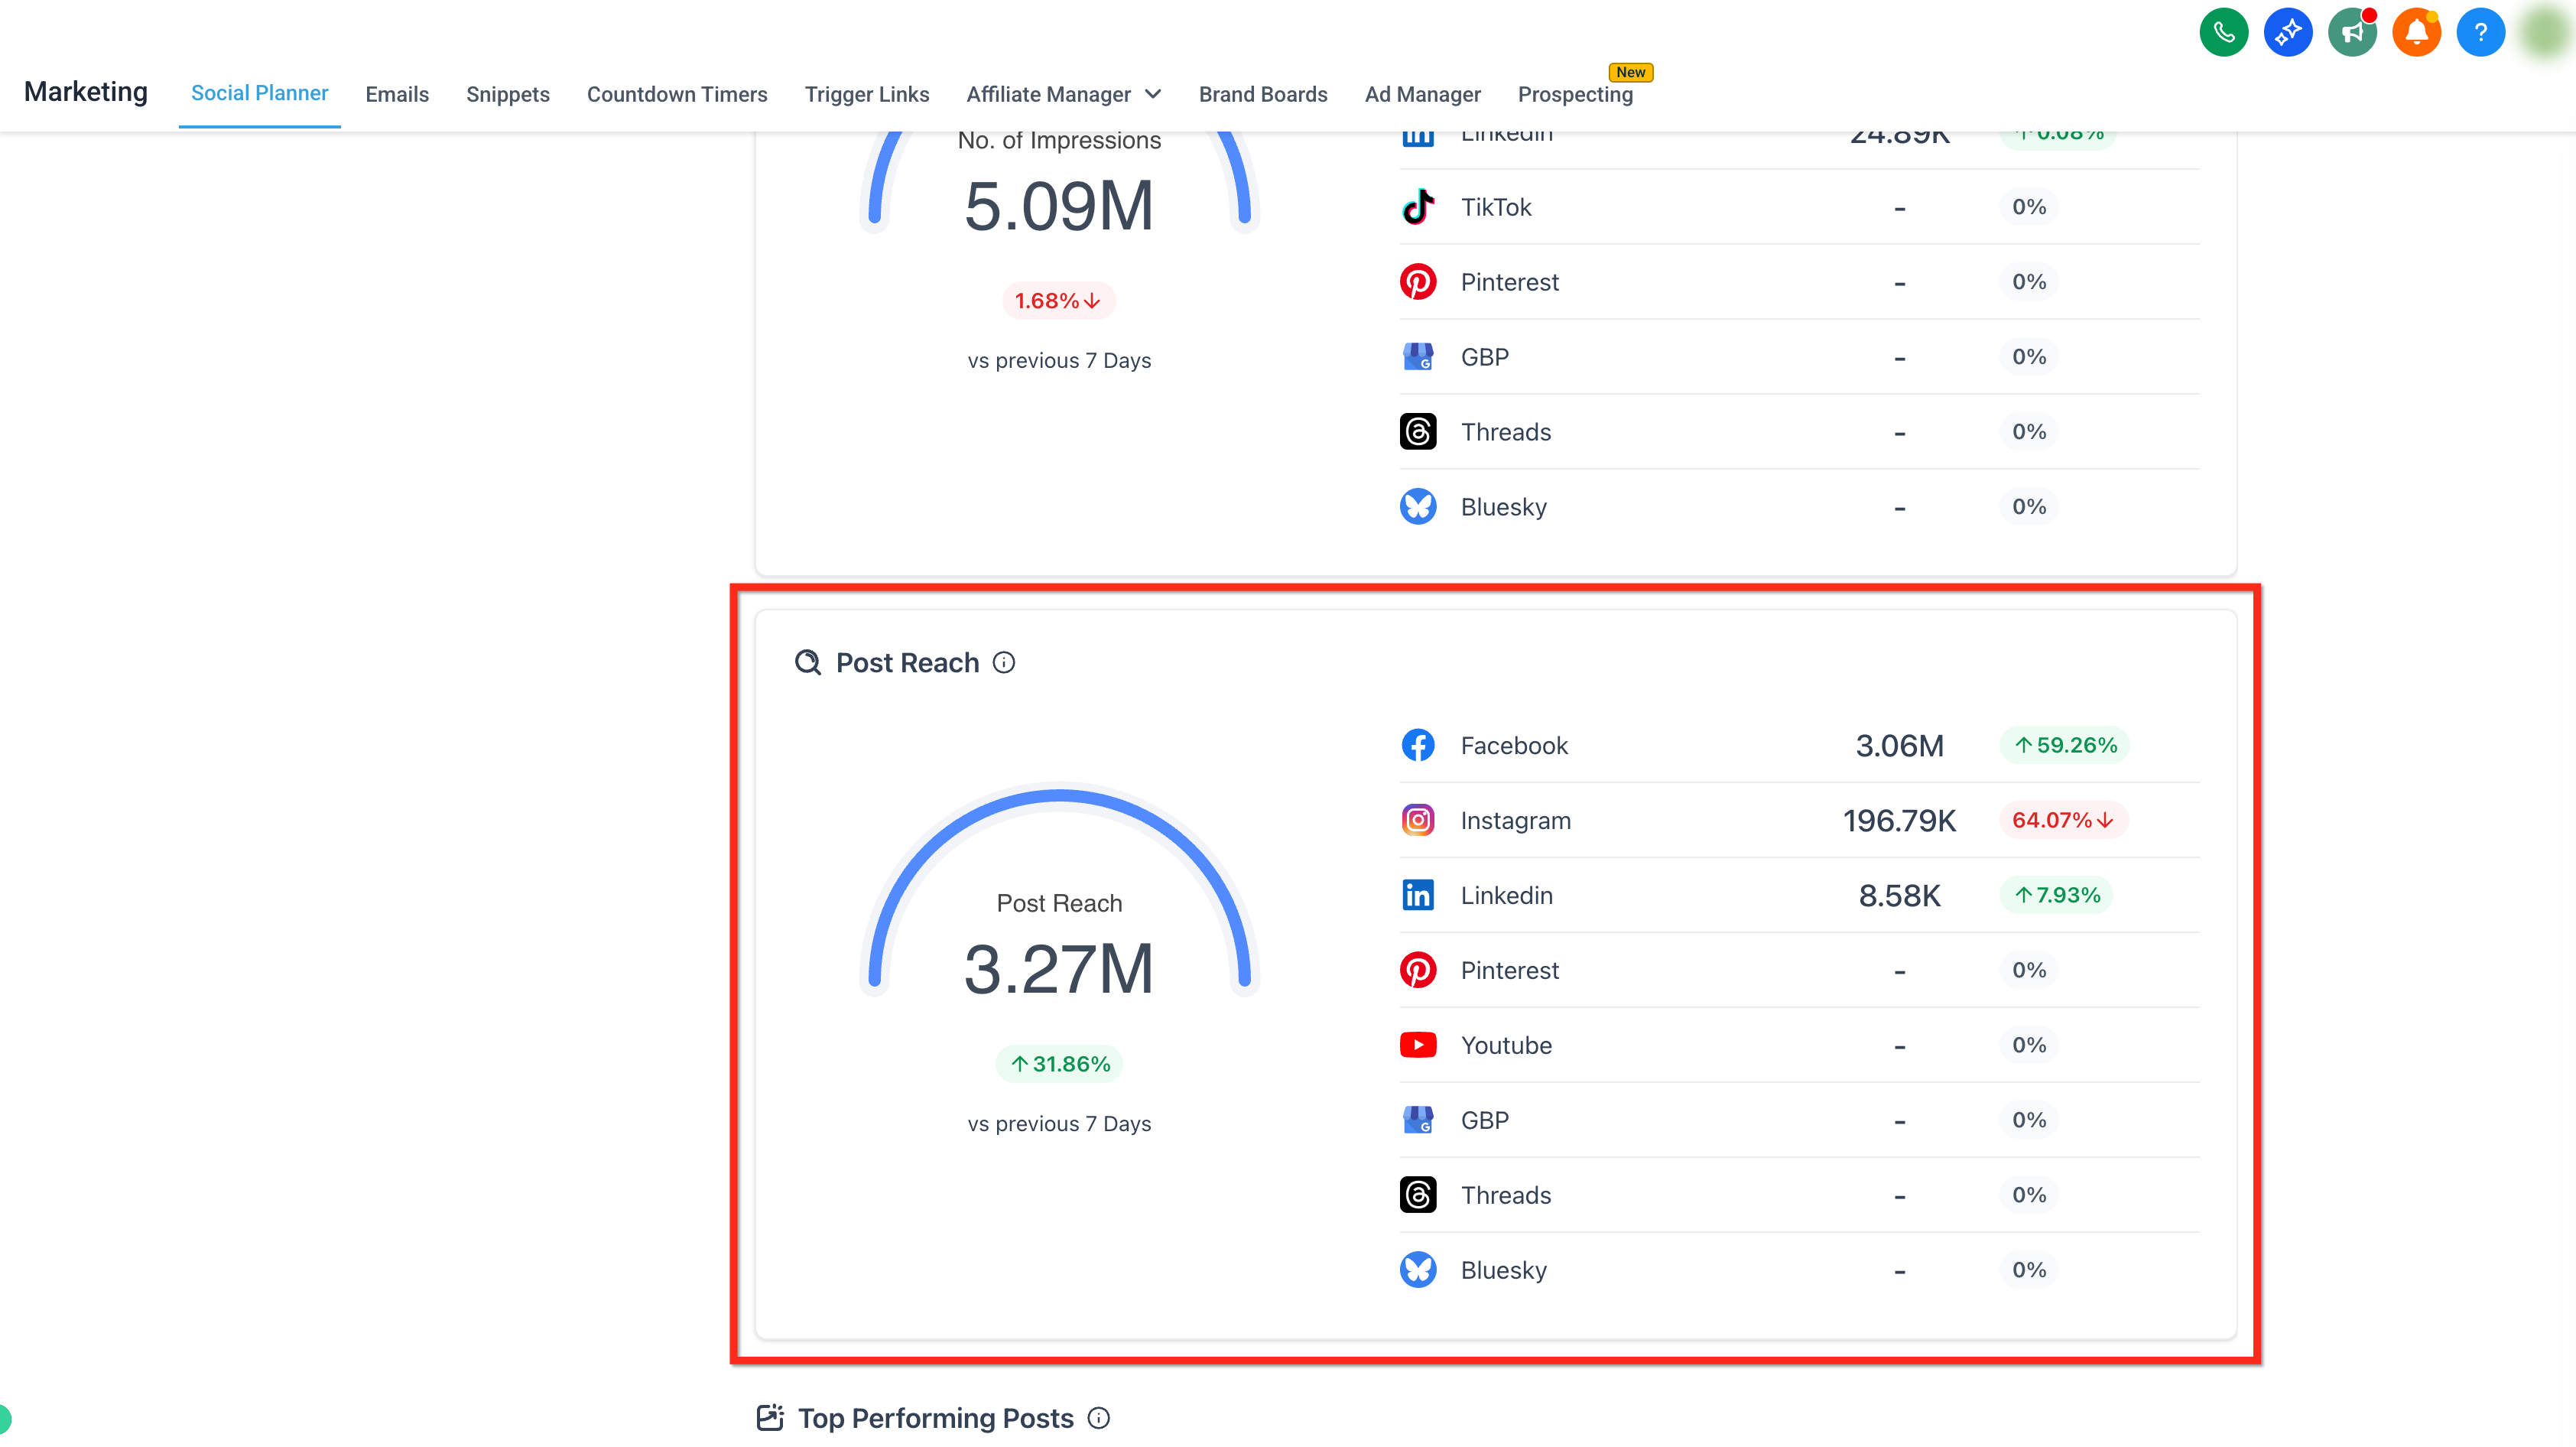
Post reach is the number of people who have seen any content from your page or account, or about your page, on their screen. This includes posts, check-ins, ads, and social information from people who interact with your page. The post reach percentage reflects the change in this week's data compared to the previous week. For Google Business Profile, this number reflects the total number of call clicks, website clicks, food orders, bookings, food menu clicks, and direction requests.
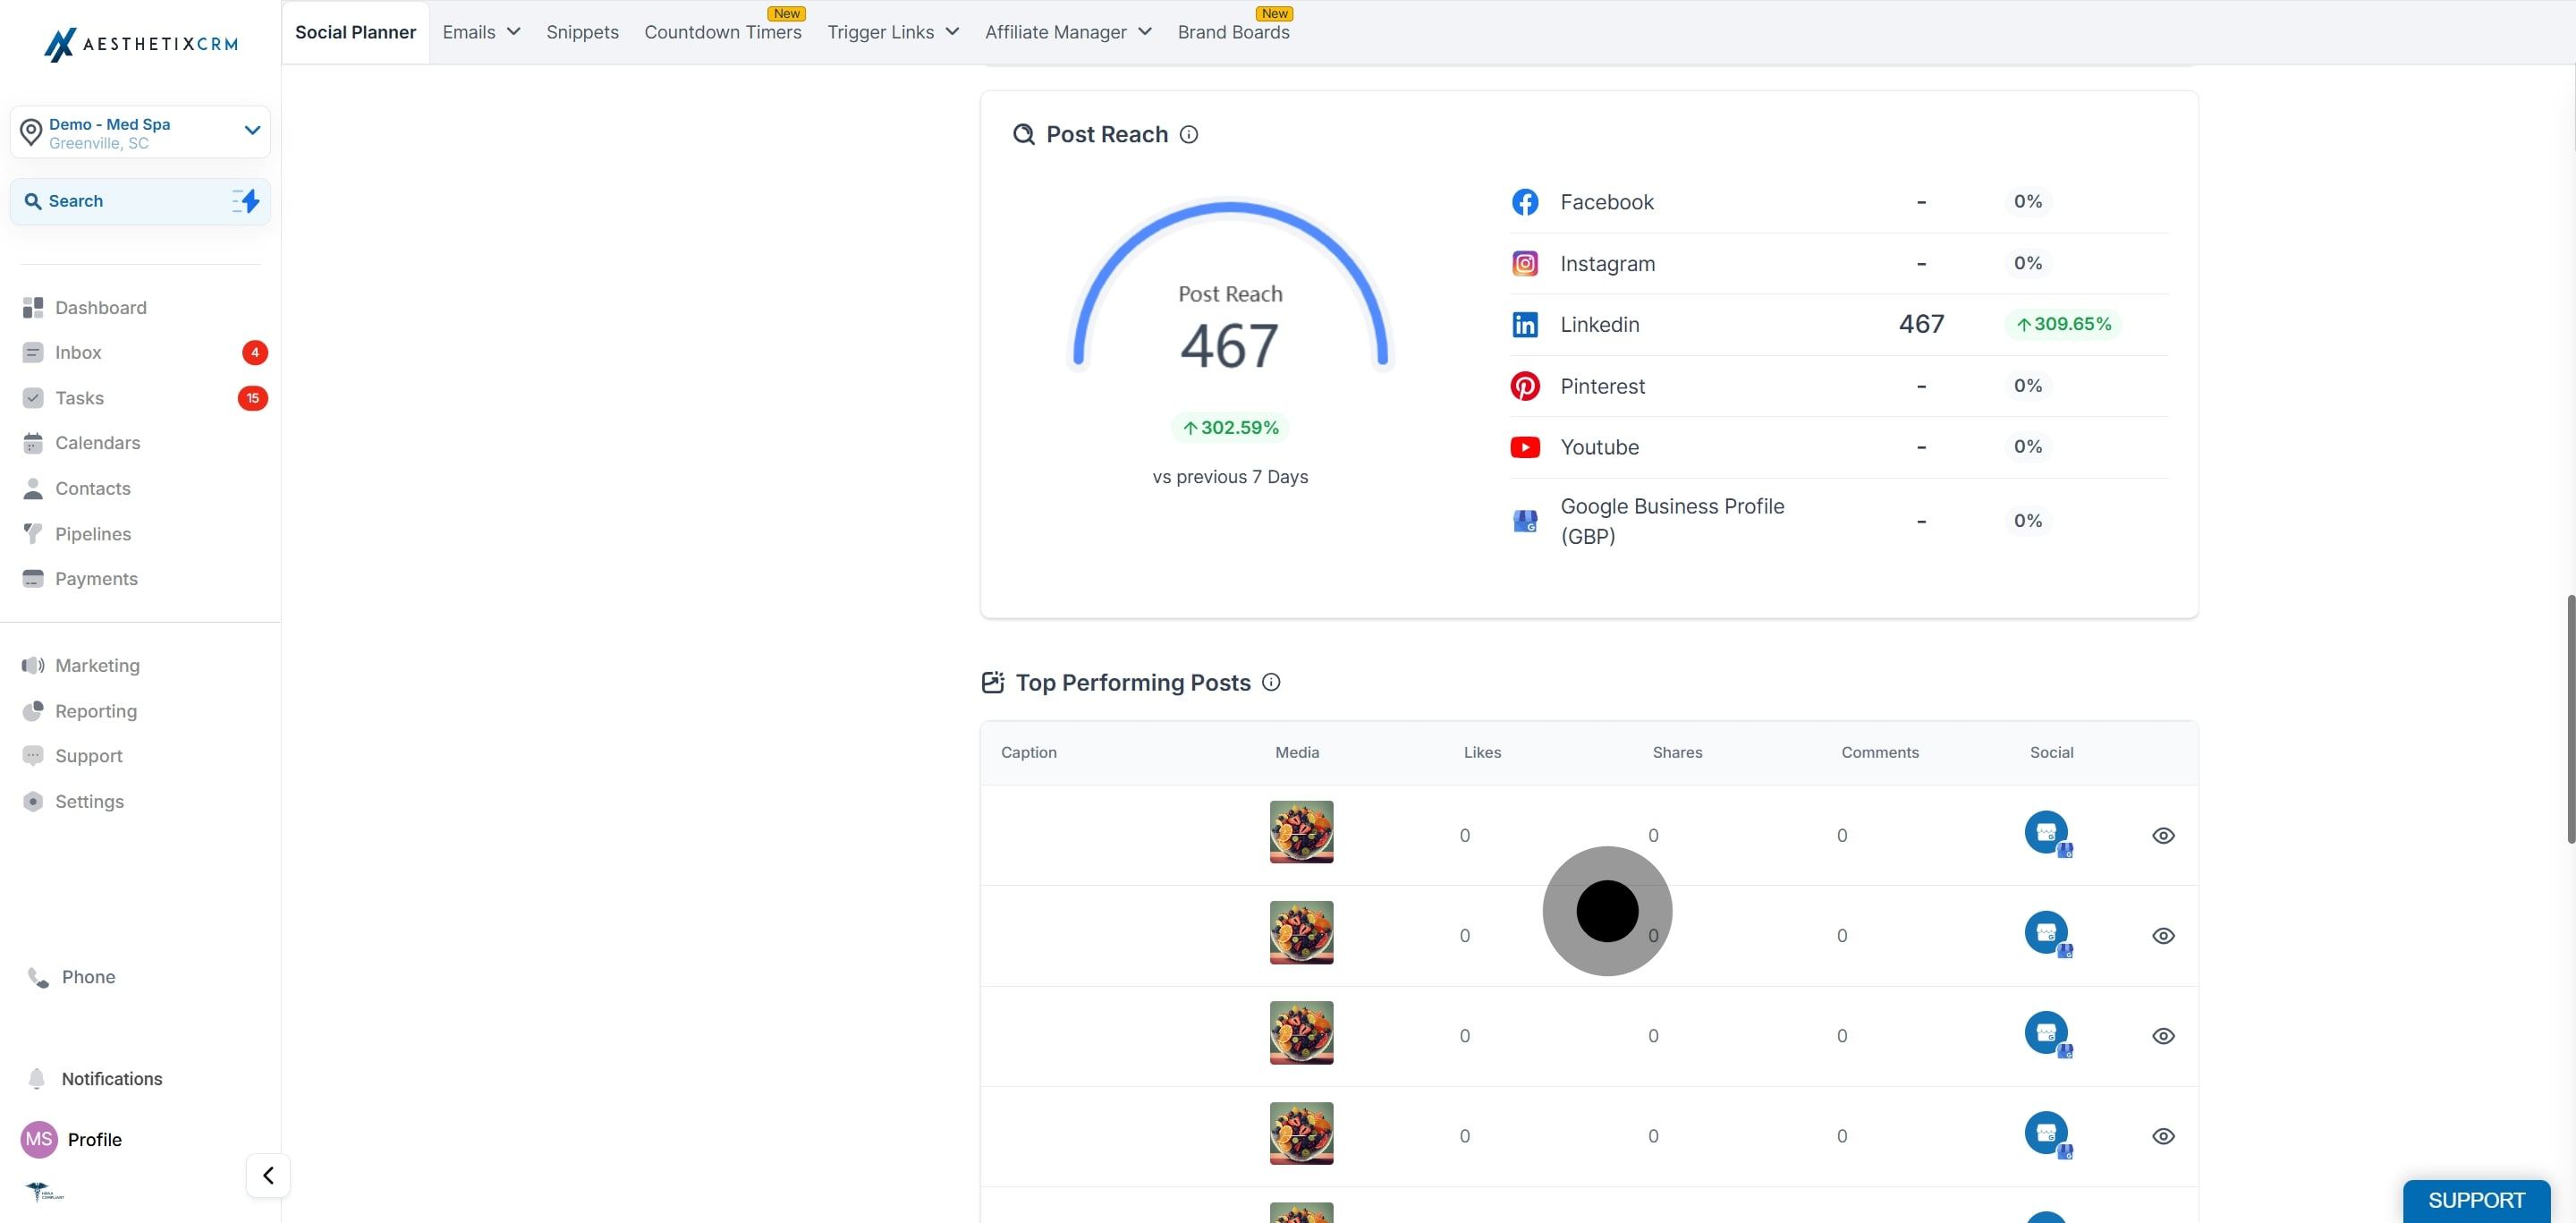
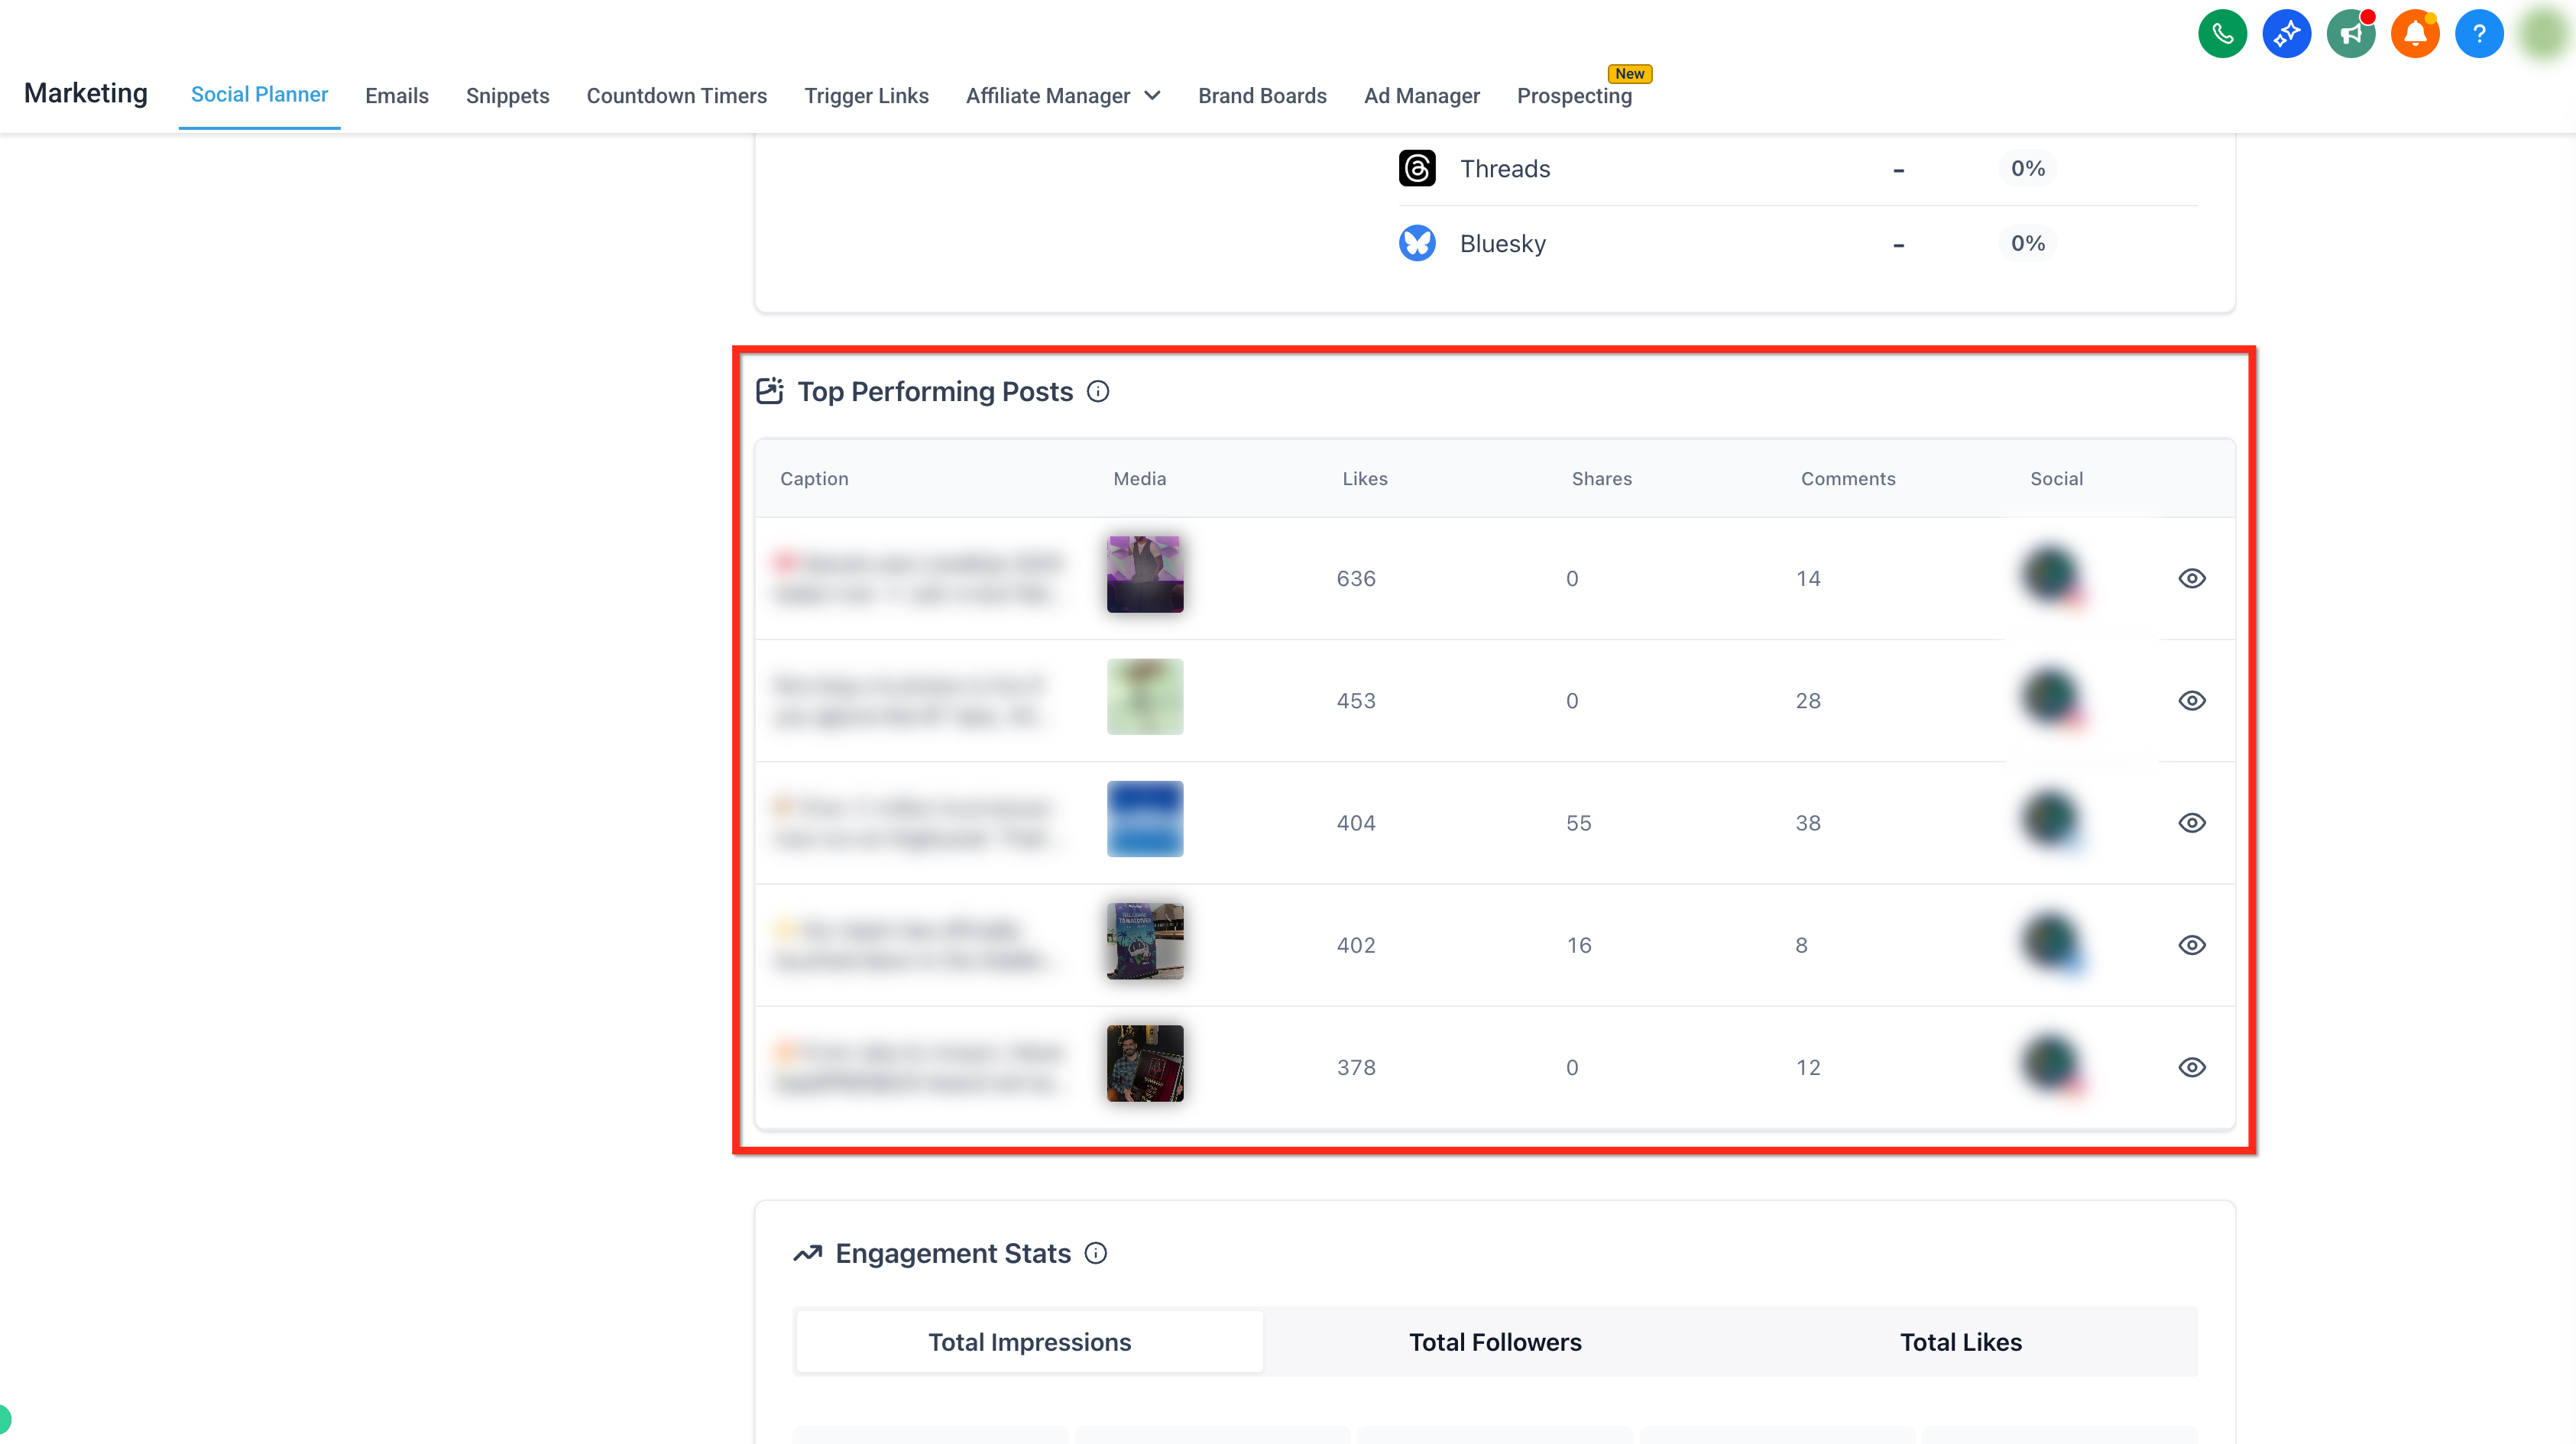
See your top all-time posts. Top-performing posts are the posts with the highest number of likes among published social posts from Social Planner. Click the eye icon next to any post to view it within the social media platform.
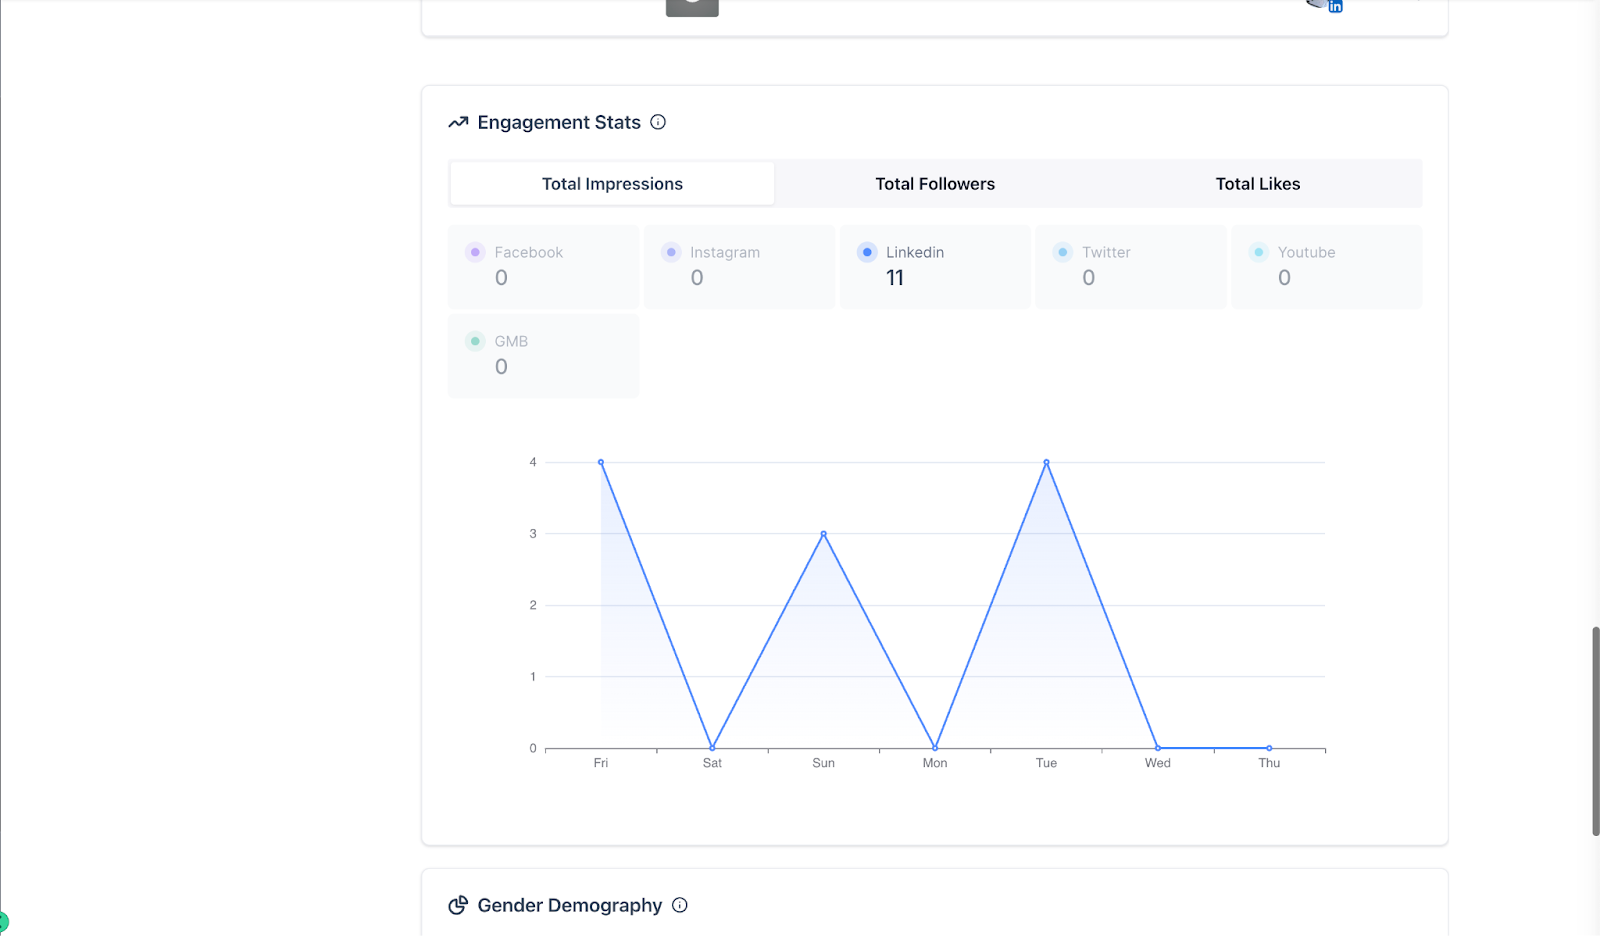
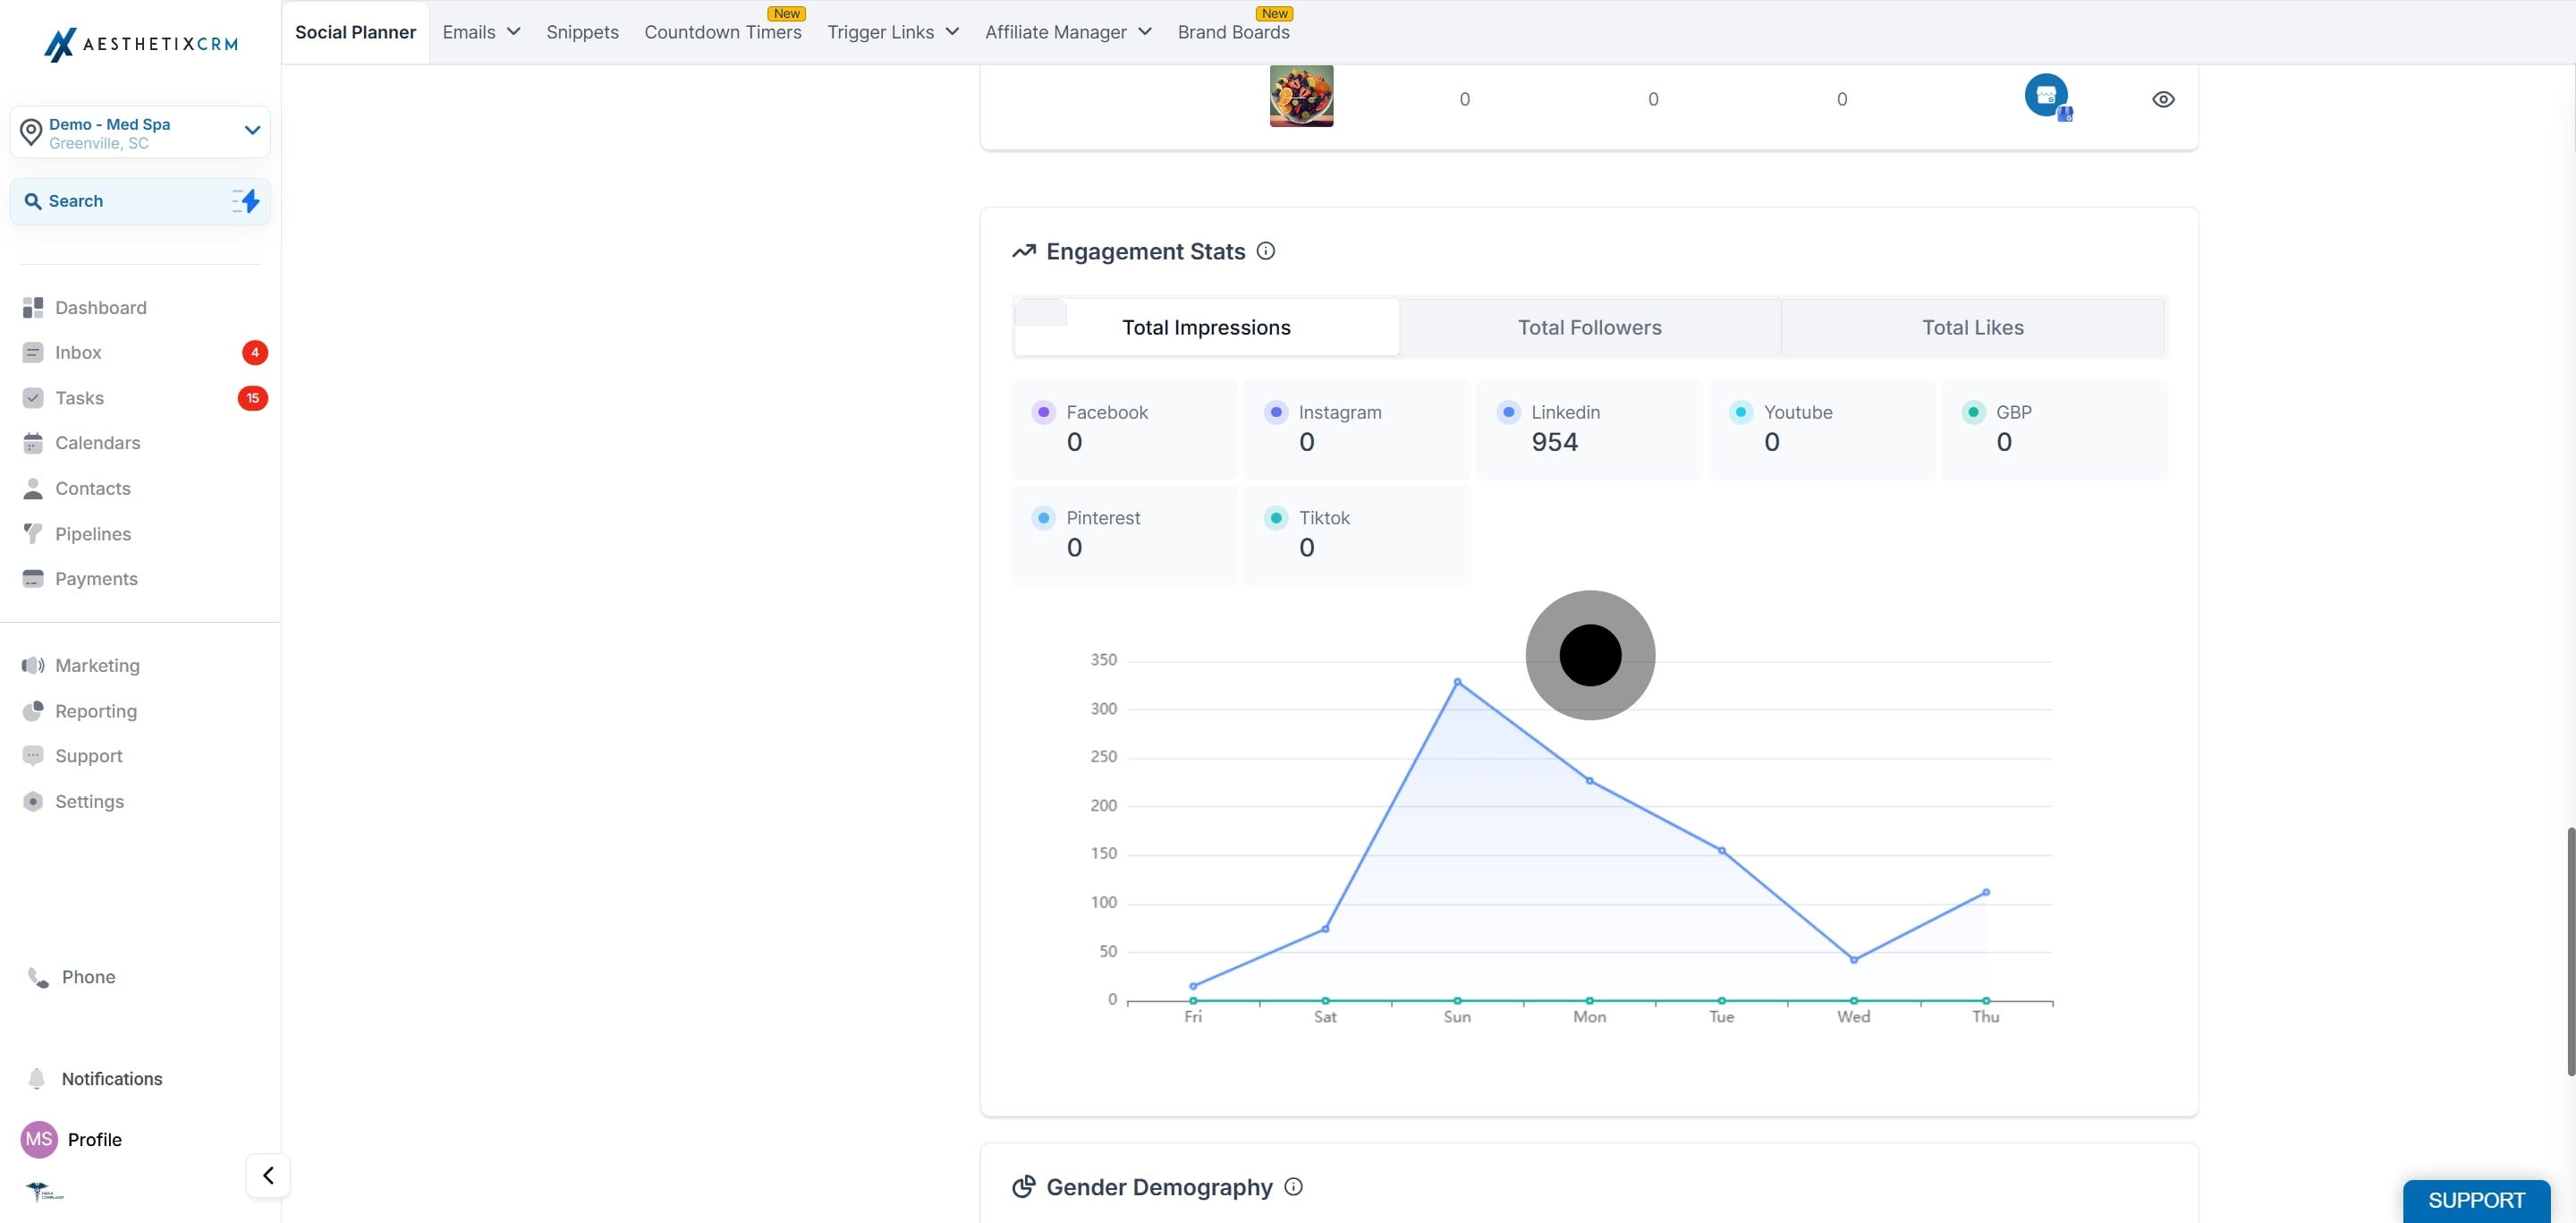
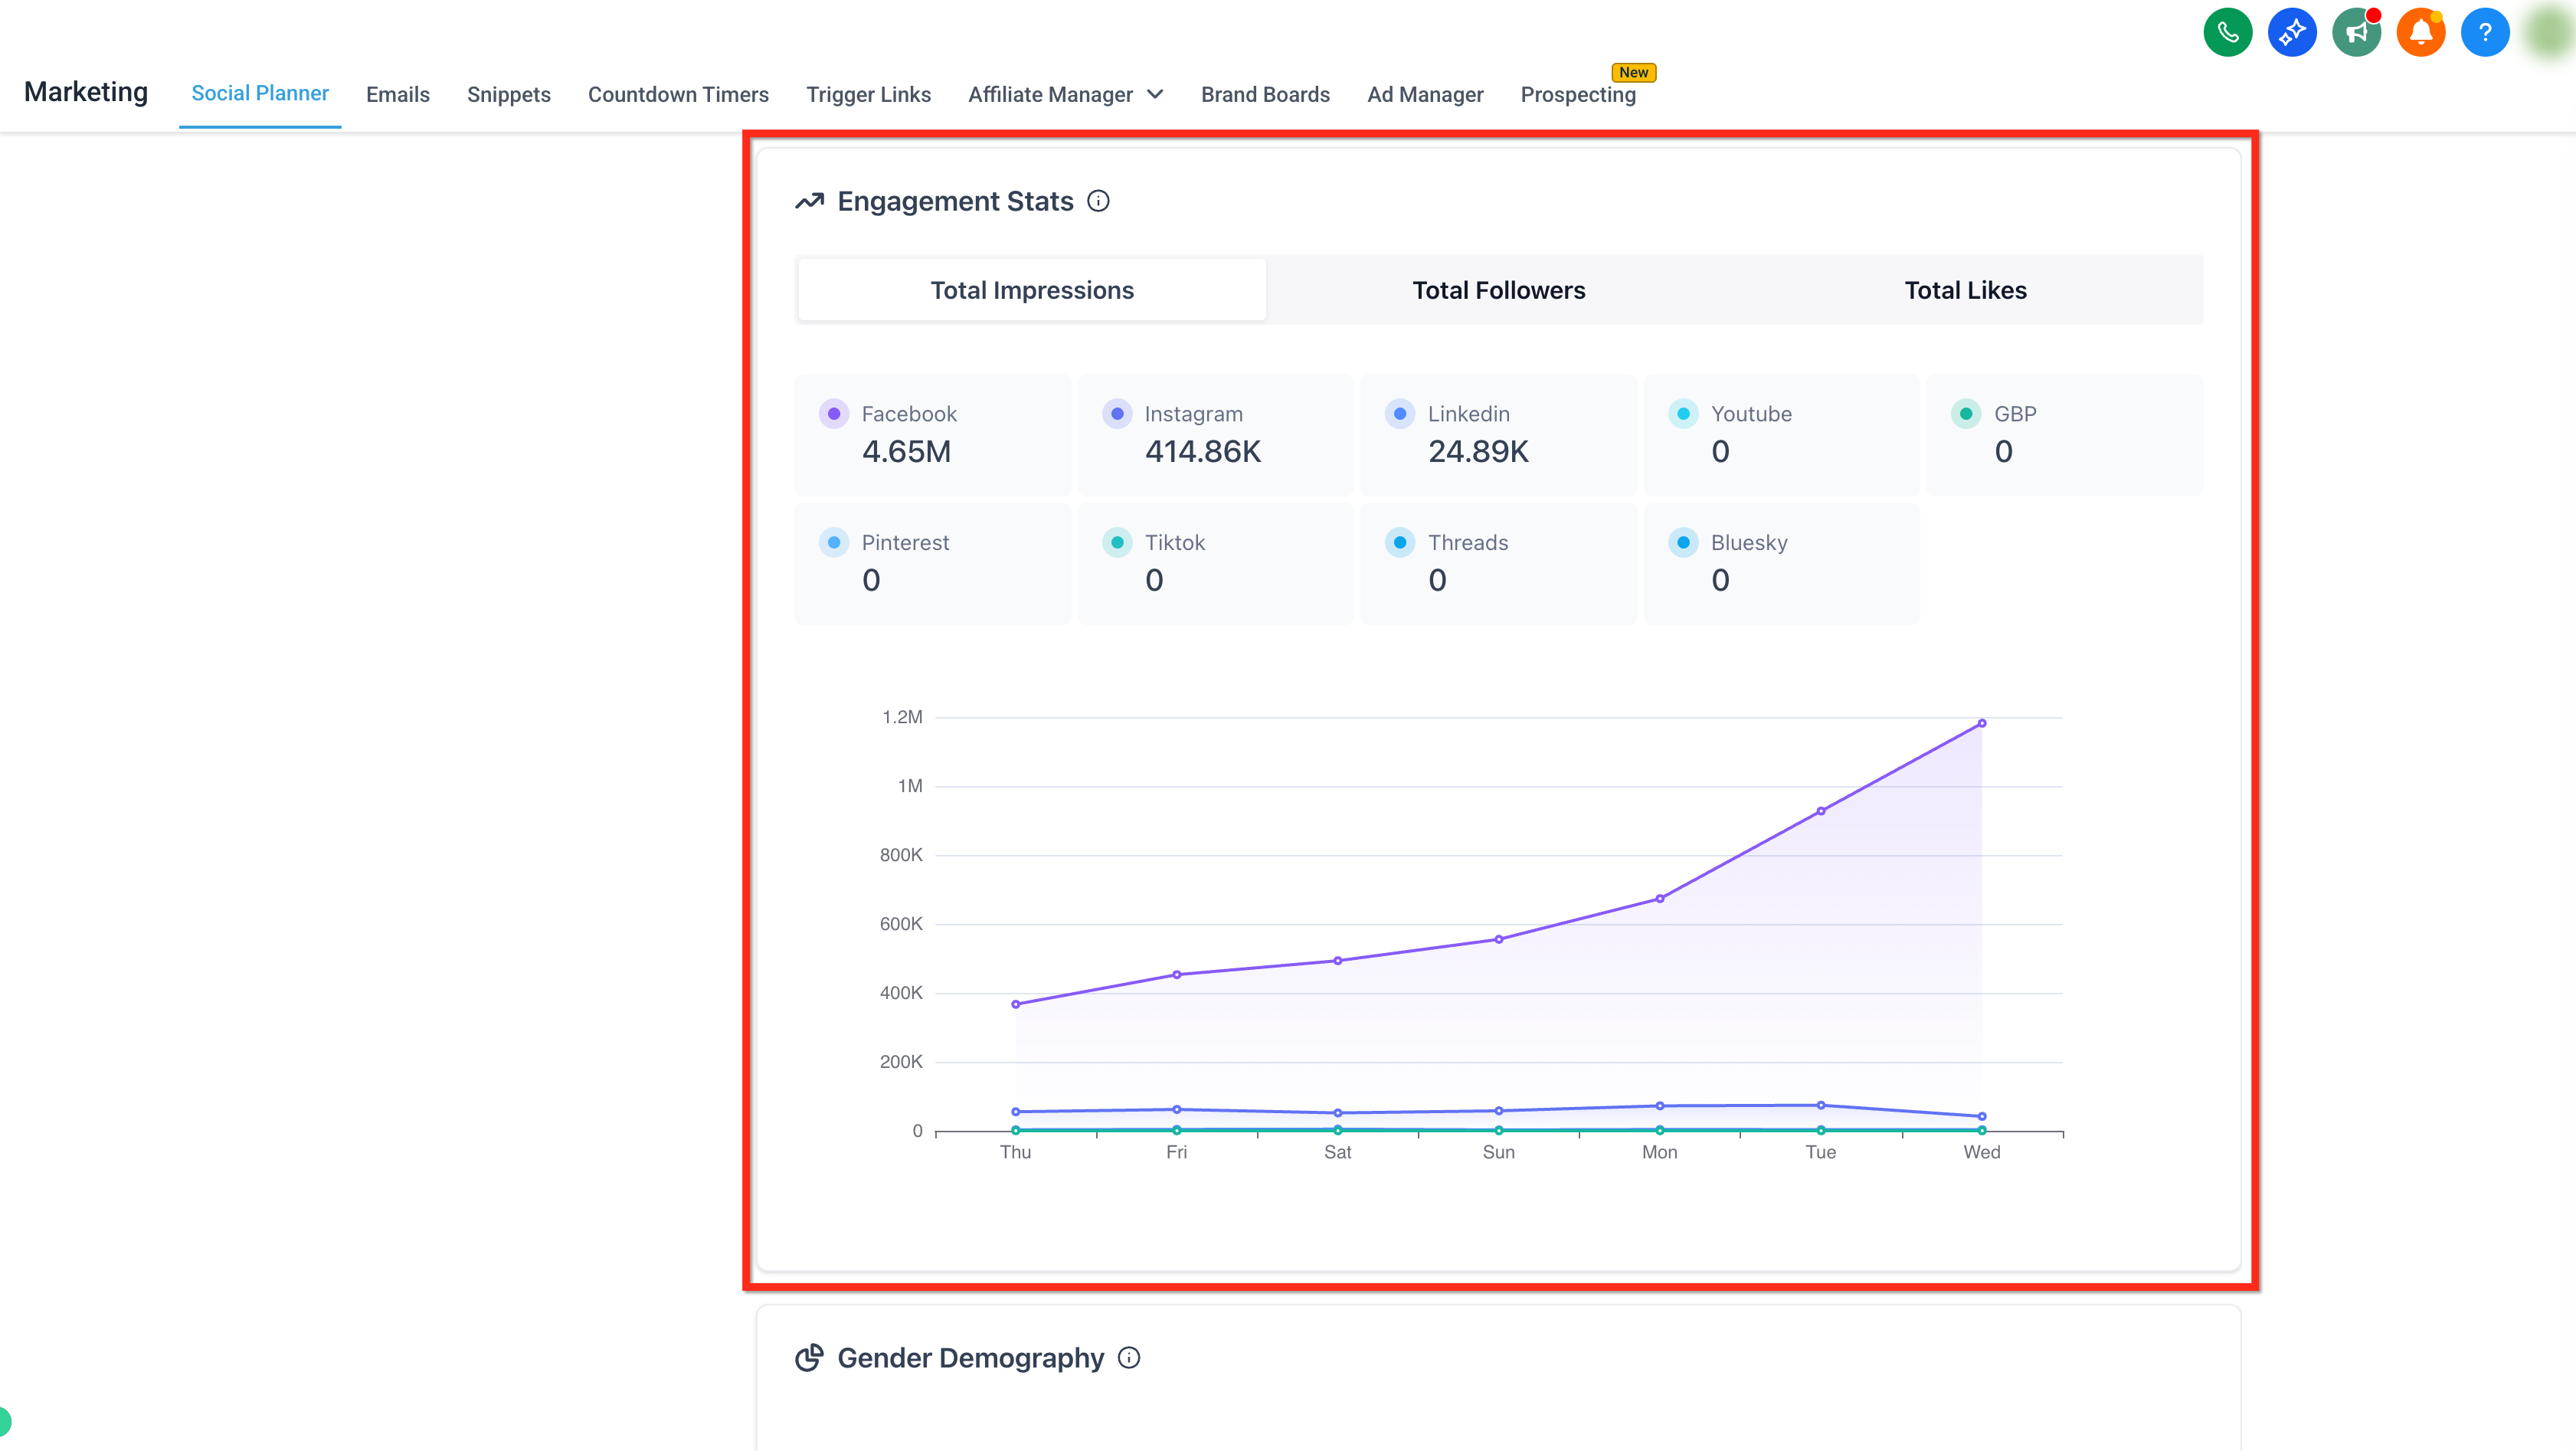
Get a detailed view of engagement metrics such as total likes, comments, and shares, broken down per platform. Use the selector ribbon to switch between Total Engagement, Total Followers, and Total Likes. This report helps you identify which platforms best drive engagement so you can tailor your content strategy accordingly.
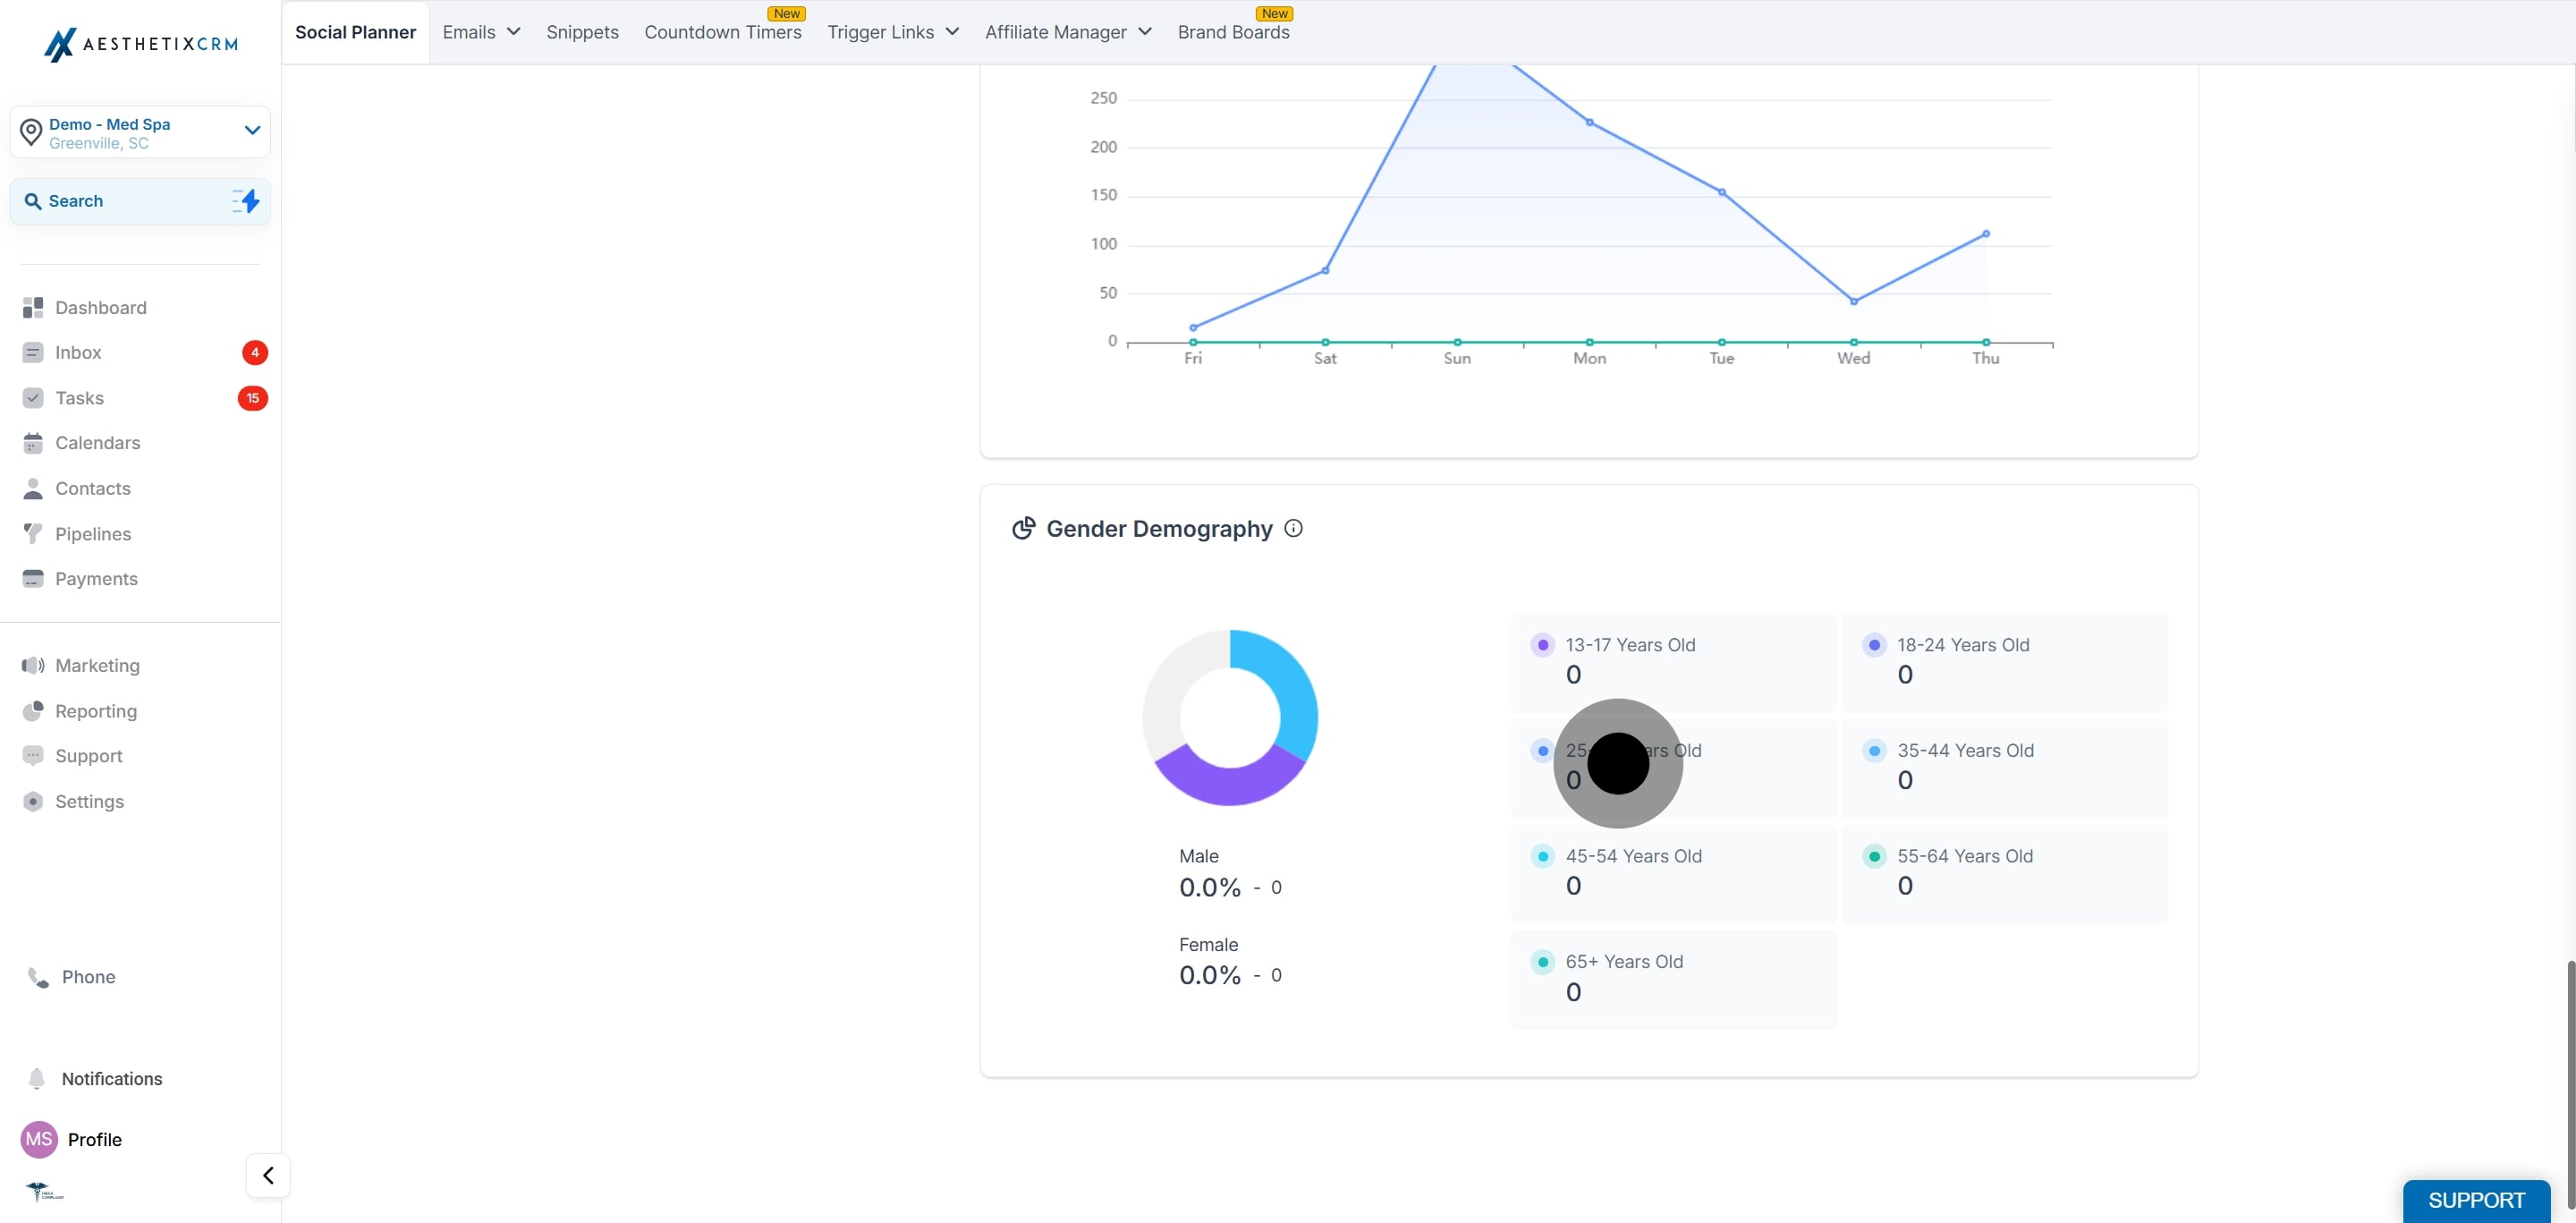
Dive into detailed demographic data, including gender distribution (male, female, and unknown) and age range insights. Demographic data is only available for viewers who have shared that data with the respective social media platform. For Facebook, gender demography is not available. For Instagram, this metric is not available for accounts with fewer than 100 followers.
What types of metrics can I track using Social Planner analytics? You can track engagement rates, post reach, impressions, clicks, and overall performance of your social media content. This data helps you assess how effective your posting strategy is at reaching prospective patients.
Is there a way to compare the performance of different posts? Yes. The Top Performing Posts report and the performance graphs let you compare posts over time, helping you identify which types of content (treatment promos, before/after posts, seasonal specials) resonate best with your audience.
Can I export the analytics data for reporting? Not currently. Social Planner does not yet offer an export option, though support for exporting data in various formats is planned for a future release.
How often is the analytics data updated? Data is typically updated in real time, allowing you to monitor performance continuously. Some platforms (TikTok, Pinterest, LinkedIn, Threads, Bluesky) have API-driven delays noted in the section above.
What time range can I view in Social Planner Analytics? You can currently view analytics data on a weekly basis only.
Why don't I see demographic data for my Instagram account? Instagram demographics require at least 100 followers, and the data is only available for viewers who have shared it with Instagram. Below that follower threshold, gender and age insights may not appear.
My statistics stopped updating. What should I do? This usually means a connected account needs re-authentication. Watch for the real-time reauthentication alert, then reconnect the account with upgraded permissions. Statistics resume from the next day.
Are demographics available on the newer platforms like Threads and Bluesky? No. Demographics are not supported by any of the newly released platforms. Threads and Bluesky also have reduced metric availability, as shown in the metric table above.
