Aesthetix CRM Site Analytics goes beyond simple page counts to answer three questions that shape smart marketing for your practice: where your visitors are located, how they found you, and how engaged they are once they arrive. Together these views help you focus campaigns on the markets and channels that bring in the most bookings.
You will find all three tools inside Web Tools → Websites → Analytics. Choose whether you are looking at Funnels, Websites, or both, set a date range, then scroll to the card you want. This article walks through each one.
Geographic Analytics is an interactive heat-map that visualizes web traffic all the way from country to state to city level. By drilling down, you can identify high-interest pockets within a region, compare performance across local markets, and fine-tune your marketing in real time. Both the map and the ranked list update the moment you change the dropdown, so insights appear instantly during meetings or screen shares.
Hyper-local targeting: Zero in on top-performing cities to run geo-focused ads and promotions near your locations.
Smarter budget allocation: Shift ad spend toward the states generating the most engaged visits.
Campaign comparison: Measure regional lift after launching location-based offers.
Faster decisions: Live refresh keeps maps and ranked lists current without page reloads.
Unified view: Visitor counts, maps, and rankings live in one dashboard for easy reporting.
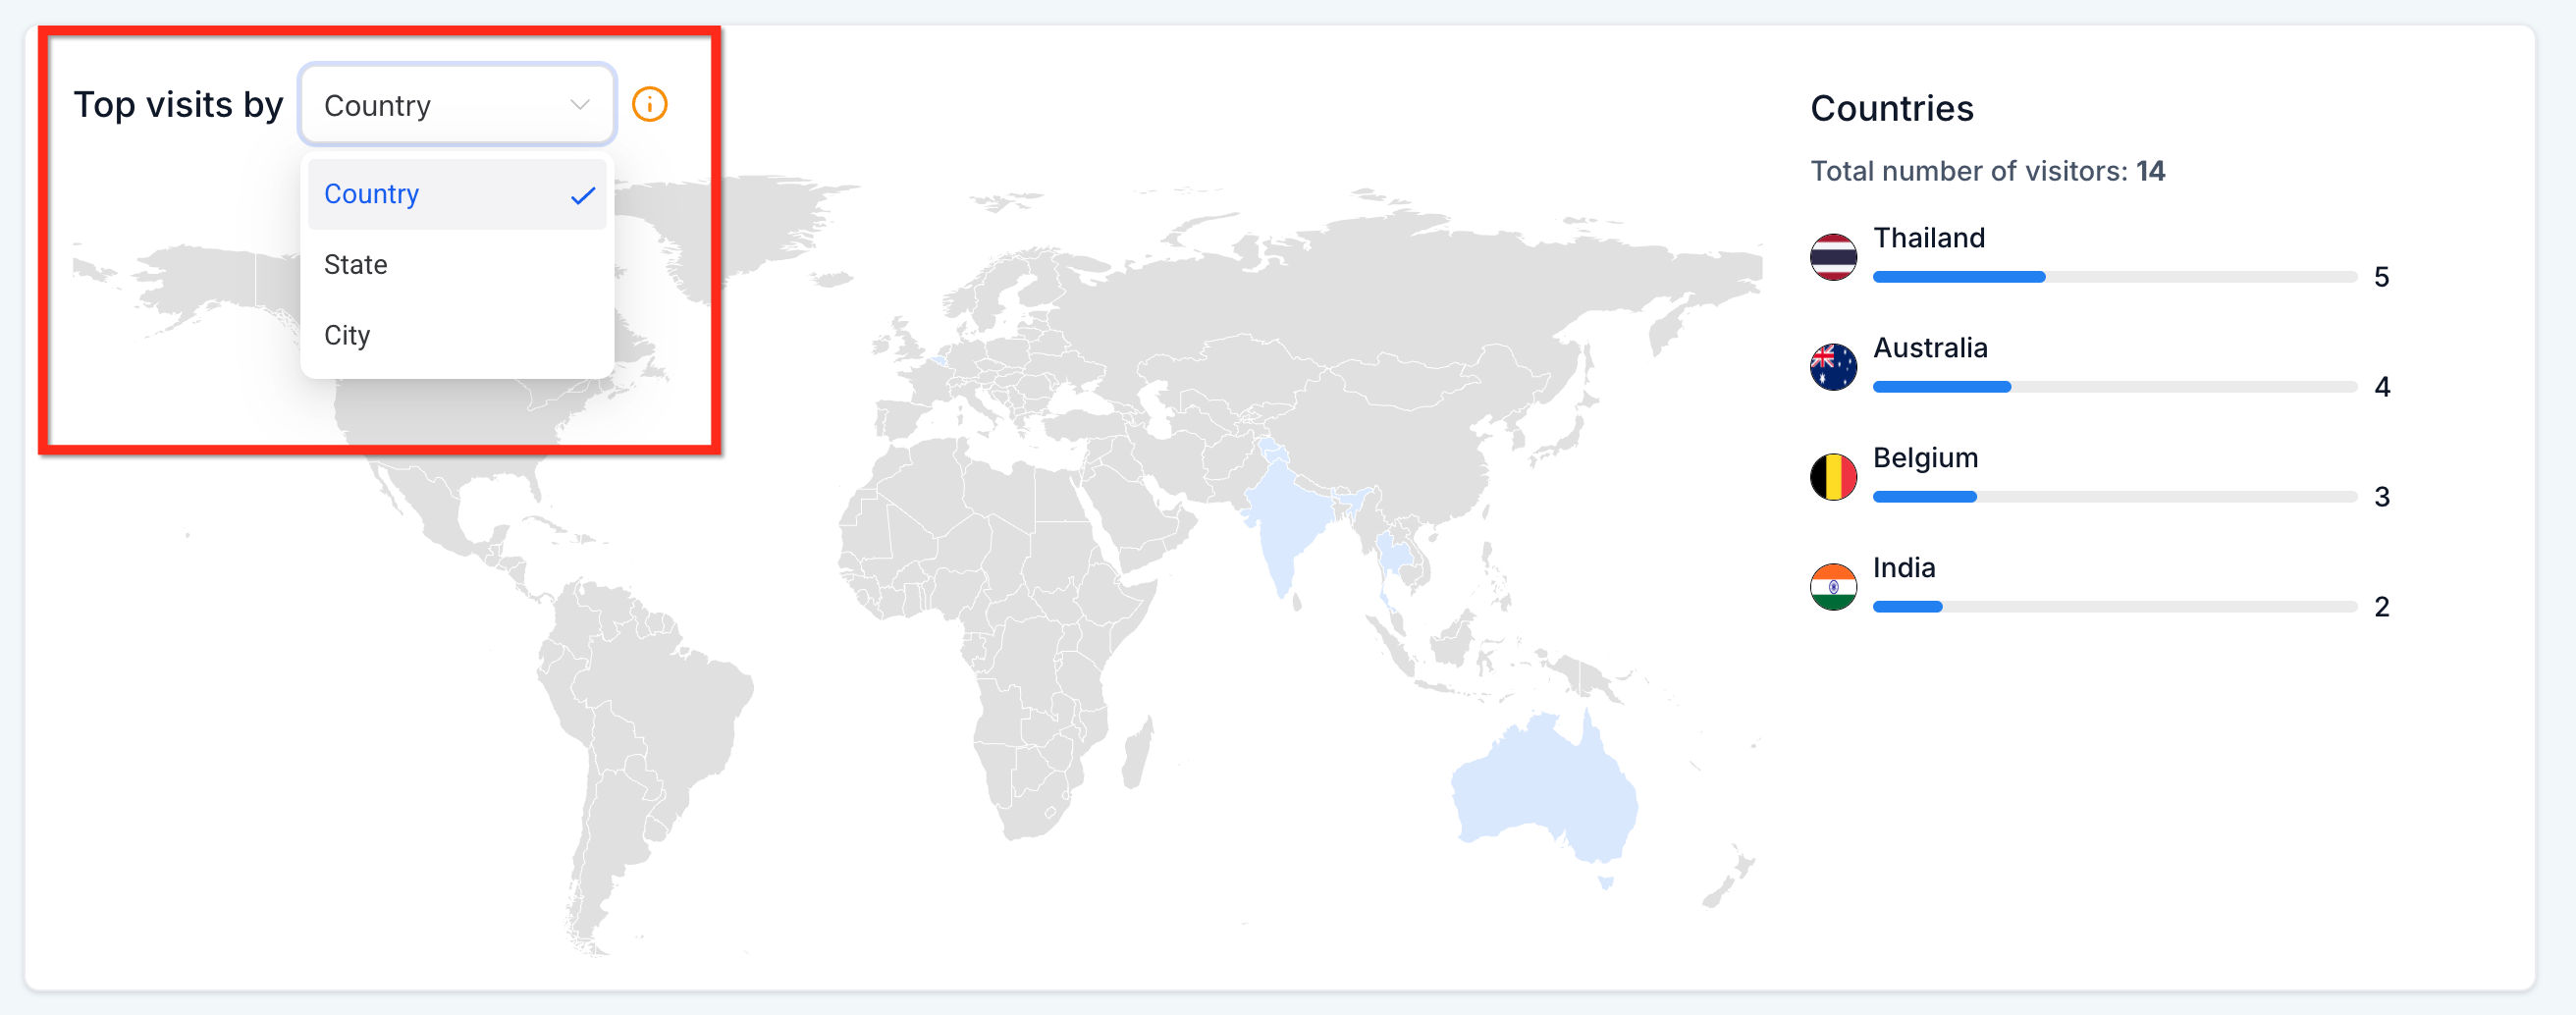
Switch between Country, State, and City with a single selector to instantly change the heat-map and ranked list. This dropdown removes extra clicks and keeps your workflow focused on insight rather than navigation.
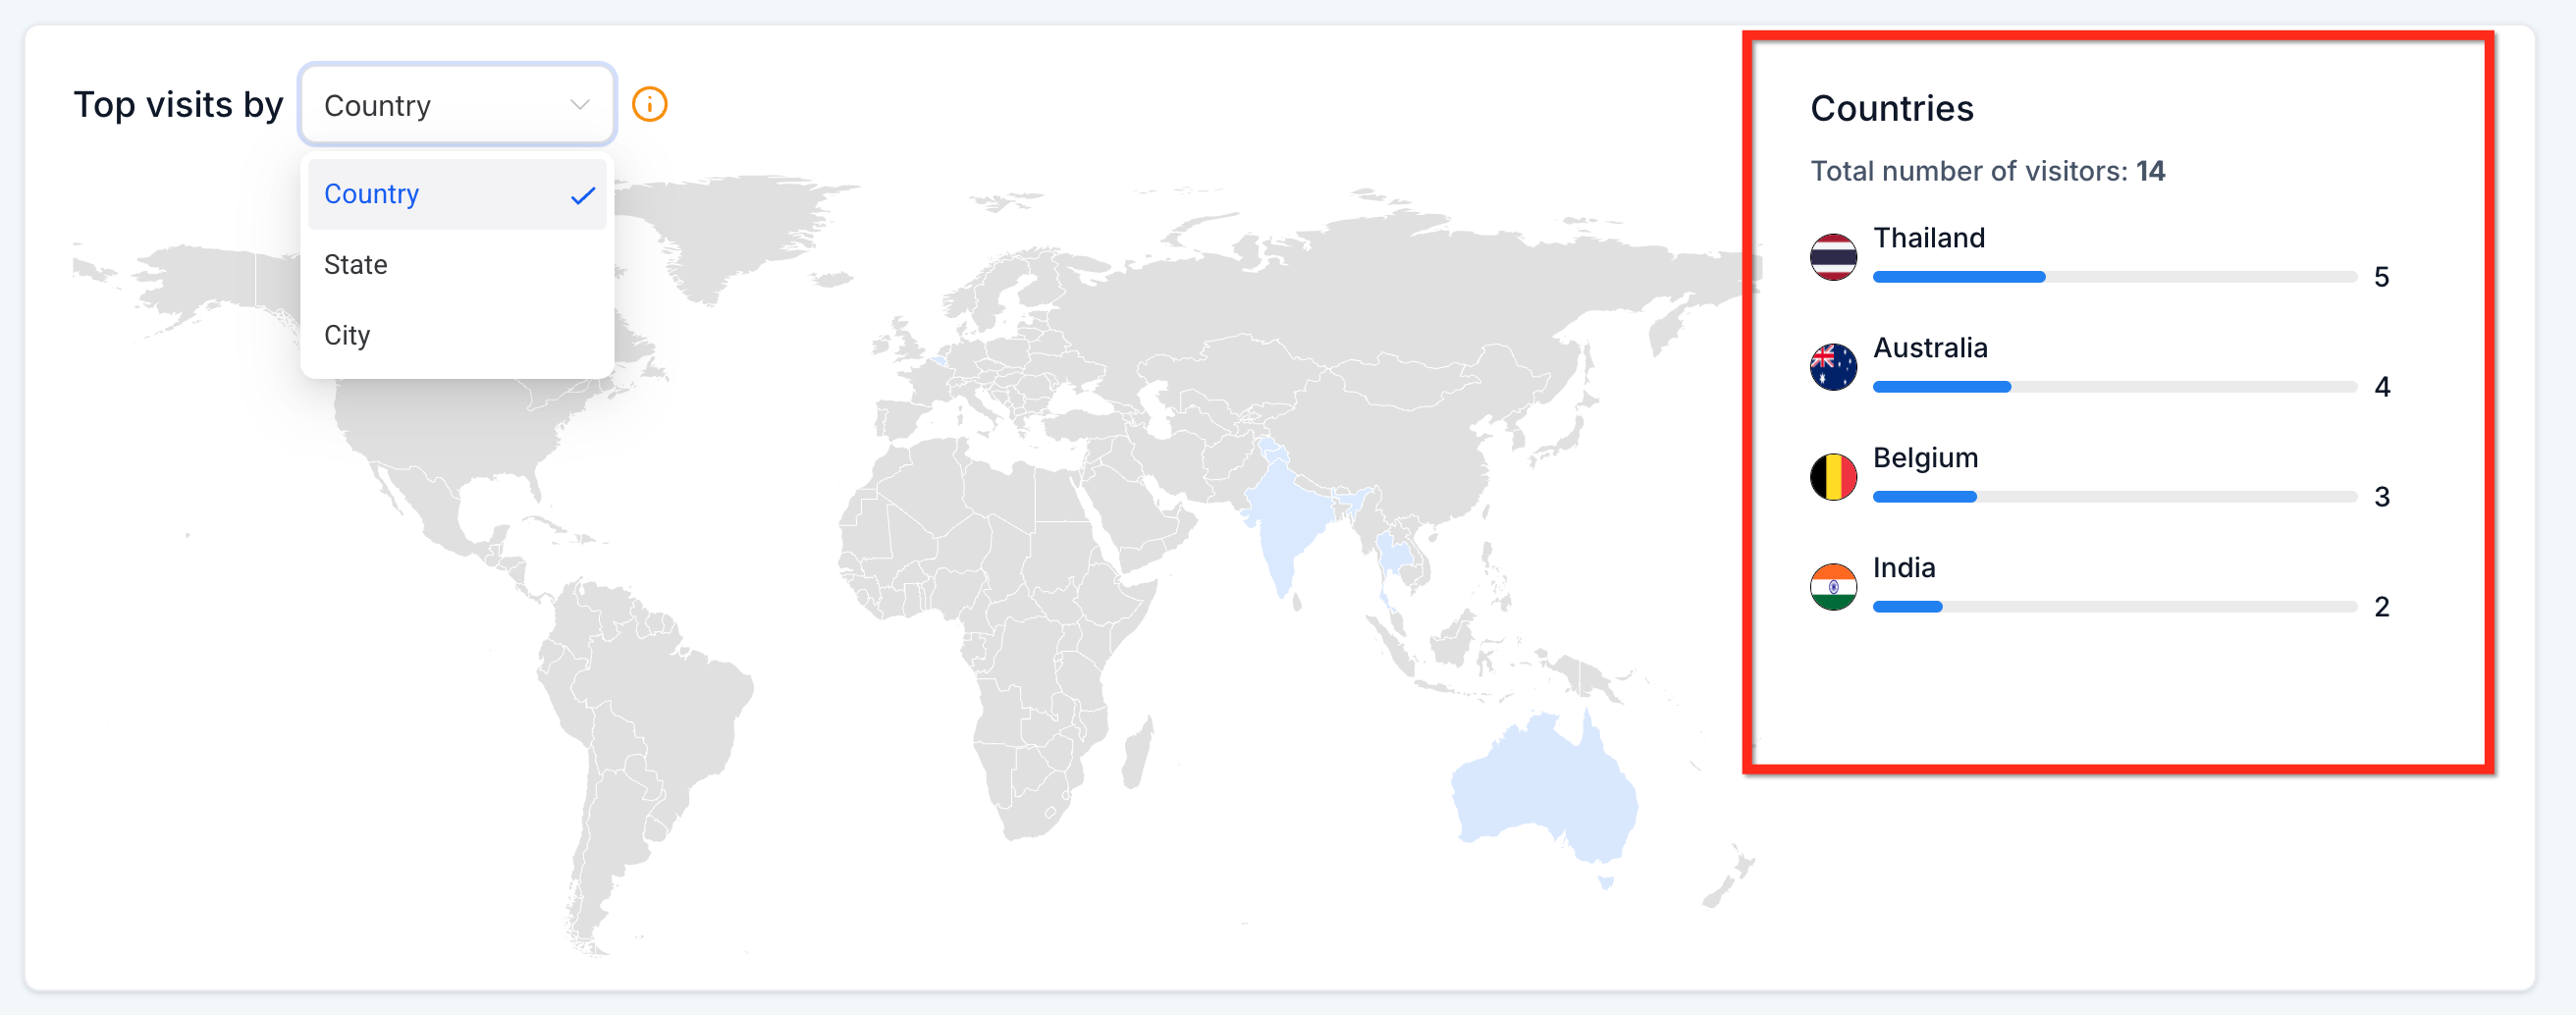
Each drill-down level includes a side-panel list that automatically ranks the top regions by visit count. The list updates in real time as you change levels, making it effortless to spot your highest-traffic areas at a glance.
A running total of all visits for the selected drill-down level stays visible above the map. As you move from state to city, the total refreshes automatically so you always know the full audience size you are analyzing.
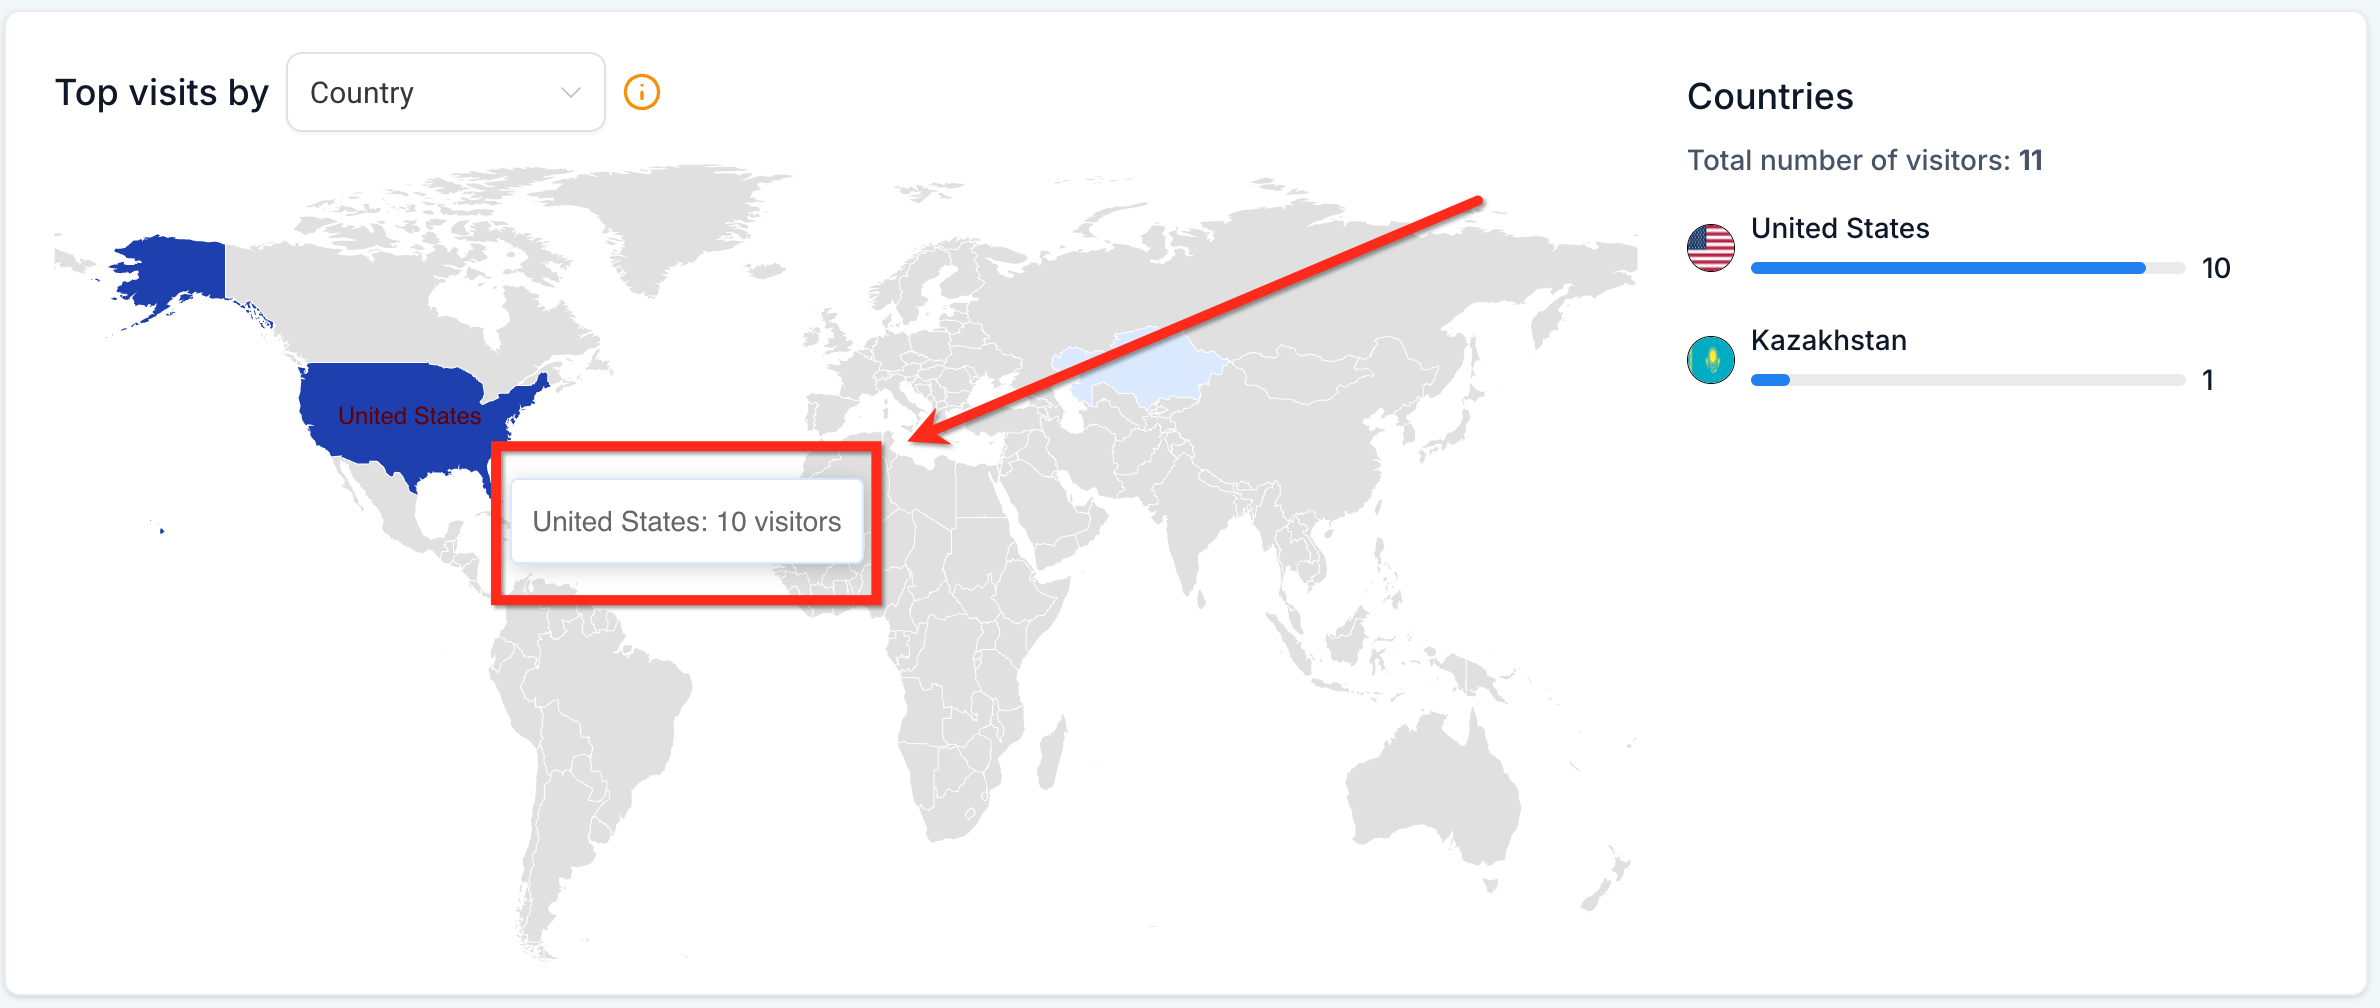
Colors on the map deepen as traffic increases, giving you a quick visual cue of hotspots without digging through spreadsheets. Move your cursor across the map to reveal precise visitor numbers for each state or city. Tooltips appear immediately, saving you from scrolling the side list when you need a quick figure.
Geographic Analytics works out of the box on the Website Analytics page.
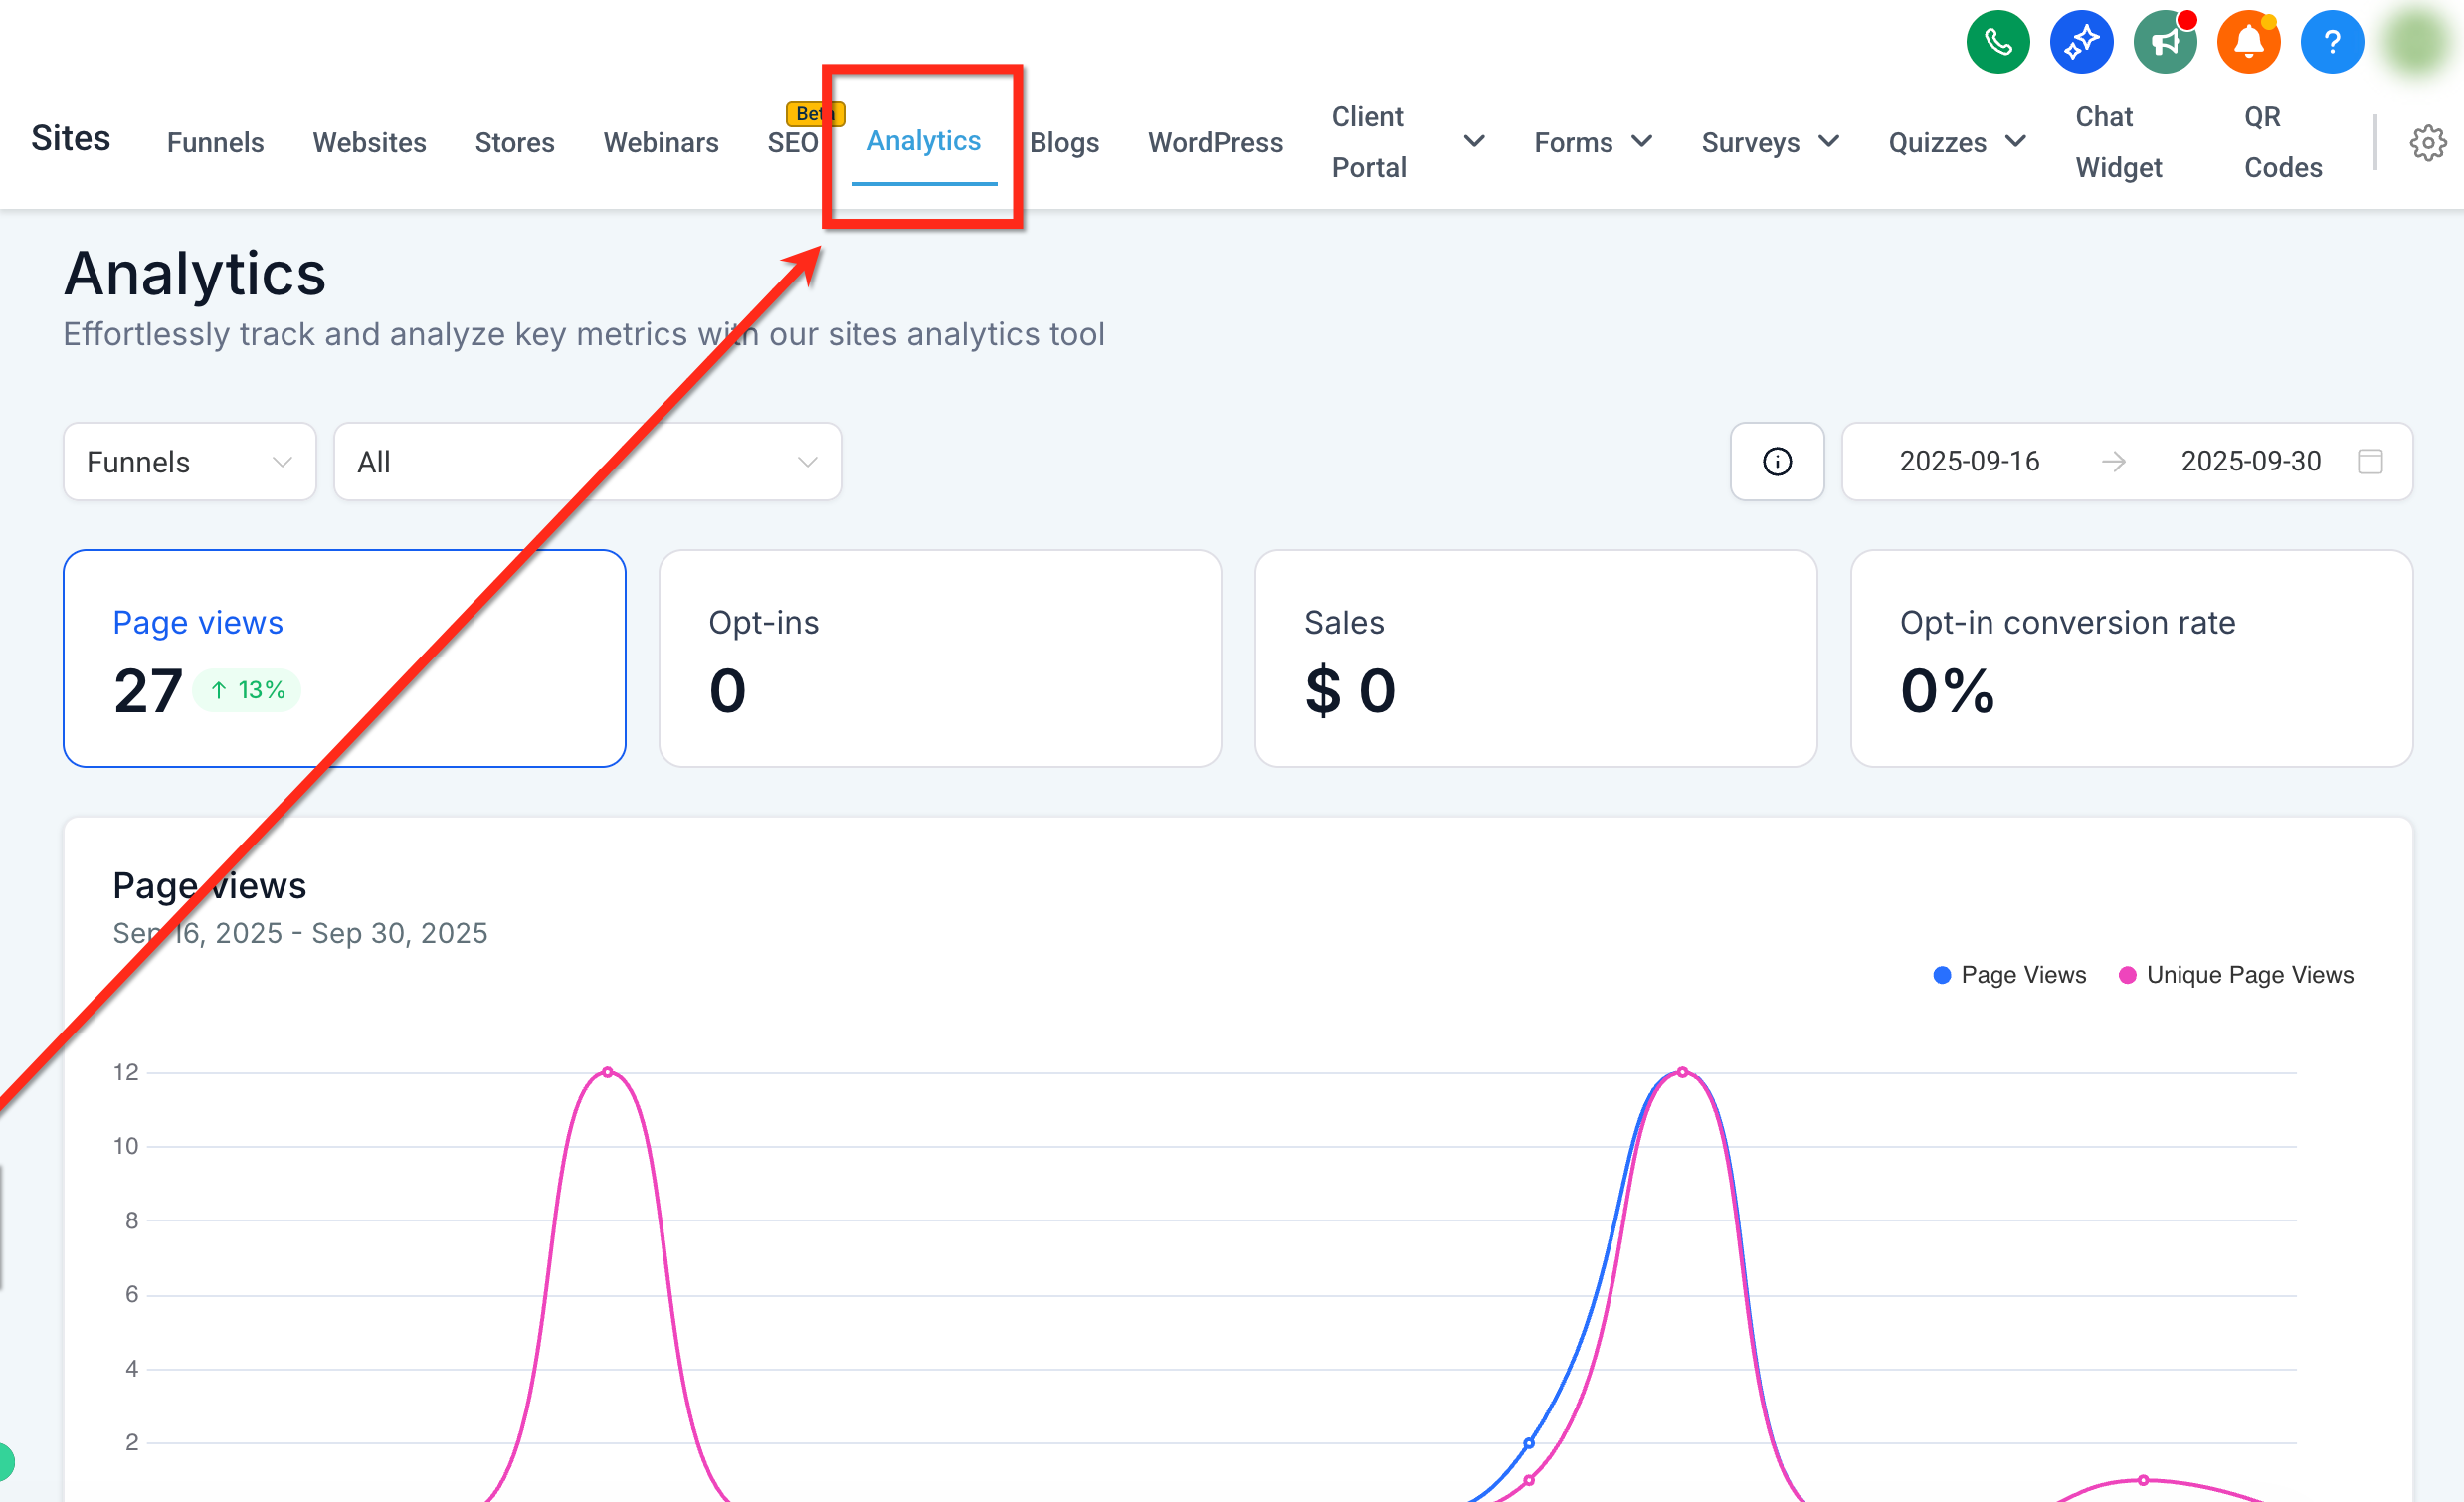
Step 1: Navigate to Analytics
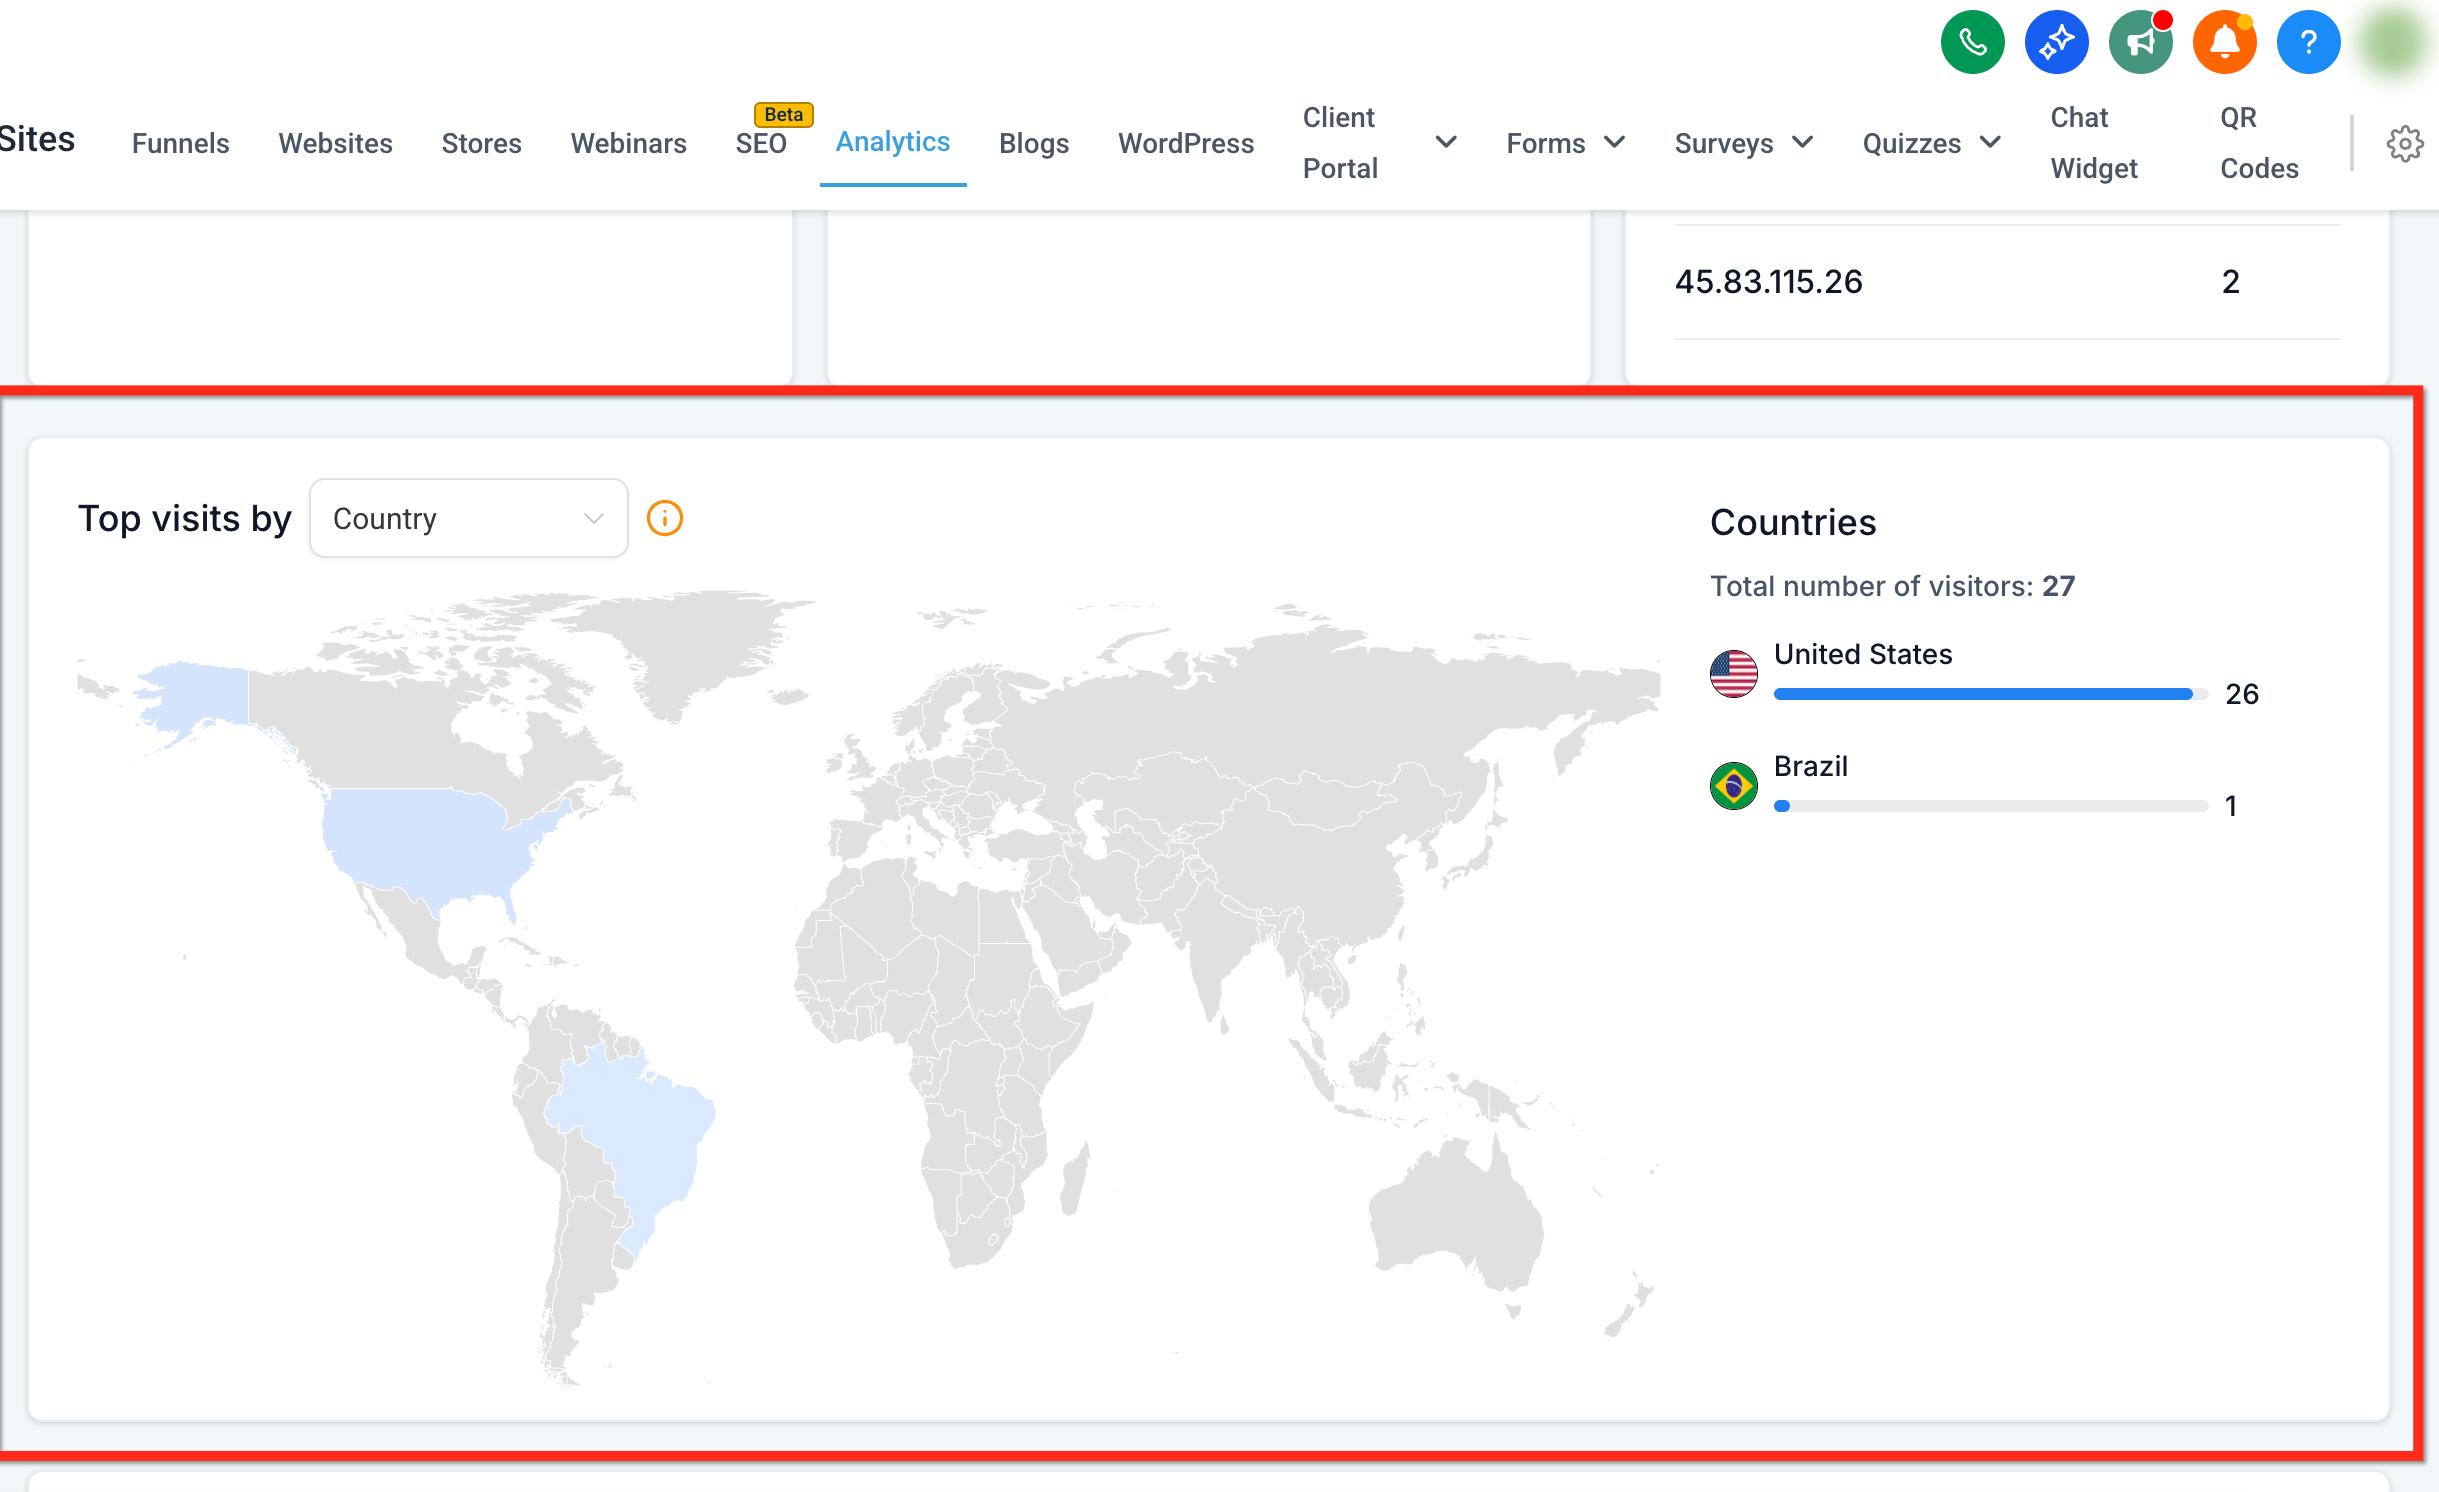
From your dashboard, use the left-side navigation bar to go to Web Tools → Websites.
Select the Analytics tab from the top navigation ribbon.

Step 2: View the Geographic Analytics card
Scroll down to the Geographic Analytics card (located beneath Page Views). From here you can:
Use the drill-down dropdown (Country / State / City) above the map to choose your level.
Hover any shaded region to see its visitor count.
Review the ranked list on the right to compare top locations.
Step 3: Use the data
Apply your insights, such as shifting ad spend or creating localized landing pages, to maximize regional results.
Q: Do I need to add any extra tracking scripts to see state and city data?
No. If Website Analytics is already capturing page views, Geographic Analytics will populate automatically.
Q: Is the heat-map data available in real time?
Visitor counts update as new sessions are recorded, so the map refreshes automatically without a full page reload.
Q: Does this include both Funnels and Websites?
The view follows your Analytics context (Funnels, Websites, or Both) and date range, so results reflect the scope you select on the Analytics page.
Traffic Source Analytics is a visual dashboard inside Web Tools → Websites → Analytics that breaks down daily traffic by marketing channel and source. A stacked bar chart plus companion tabs (Traffic Channel and Source/Medium) let you attribute results to the right campaigns, compare channels over time, and filter the entire dashboard to a specific date when needed.
Channel clarity: Quickly see how much traffic comes from Paid Search, Paid Social, Organic Search, Direct, Referral, Social (organic when available), and Other (Unknown/Unmapped).
Faster decisions: Spot growth, dips, or seasonal shifts at a glance with daily stacked bars and immediate tooltips.
Better attribution: Validate UTMs and click IDs so paid clicks are not misclassified as Direct or Other.
Team alignment: Consistent colors and labels help everyone interpret the charts the same way in reviews.
Focused analysis: Click a single day to filter the dashboard and investigate anomalies with context.
UTM parameters: Aesthetix CRM reads utm_source, utm_medium, and utm_campaign when present.
Click IDs and auto-tagging: Identifiers like gclid, msclkid, and fbclid help confirm paid-traffic classification.
Referrer detection: Known search engines and social networks are matched; Direct means no referrer or UTMs.
Other (Unknown/Unmapped): Sessions without usable UTMs or referrers, or with malformed values.
Go to Web Tools → Websites → Analytics.
Select Funnels/Website, then choose your Date Range.
Scroll to Acquisition Data and select the Traffic Channel tab for a channel-level view (for example, Direct Traffic, Paid Social, Paid Search, Social Media, Referral).
Switch to the Source/Medium tab to view precise origins (for example, google, facebook, direct, TikTok, other).
Hover any day or date bar to see the exact count for that channel on that date.
Q: Which metric is shown in the stacked bar chart?
Daily visits to your website and funnel assets within the selected date range.
Q: Why is some traffic categorized as Other (Unknown/Unmapped)?
Sessions may lack UTMs, include malformed parameters, or arrive without a referrer (for example, app browsers or redirects). Add consistent UTMs and check your redirects to reduce this bucket.
Q: What timezone does the dashboard use?
Data aggregates by your account timezone. If your team is distributed, communicate the timezone to avoid confusion.
Average Time is a dedicated view in Web Tools → Websites → Analytics that shows how long visitors actively spend on pages across funnels, websites, and webinars. At a glance you will see KPI cards for Average Time and Exit Before 30 Seconds, plus an interactive trend chart to compare engagement over time.

Trend visibility: Identify strong and weak engagement points across funnels, websites, and webinars.
Actionable prioritization: Get clearer signals for content, UX, and design optimization.
Less guesswork: Reduce guesswork when improving retention and conversions.
Data-driven actions: Make data-backed decisions using real user engagement behavior.
Average Time
The mean active time per visit across the selected date range and sites. This measures general engagement across your site.
Exit Before 30s
The share of page visits that ended within the first 30 seconds after landing (bounce rate). This helps identify short-lived or low-engagement sessions, often caused by unmet expectations, slow load times, or irrelevant content.
Note: Each visit or session is counted independently. Ultra-short visits (under 2 seconds) are excluded to reduce noise.
Step 1: Navigate to Analytics
From your dashboard, use the left-side navigation bar to go to Web Tools → Websites and select the Analytics tab from the top navigation ribbon.
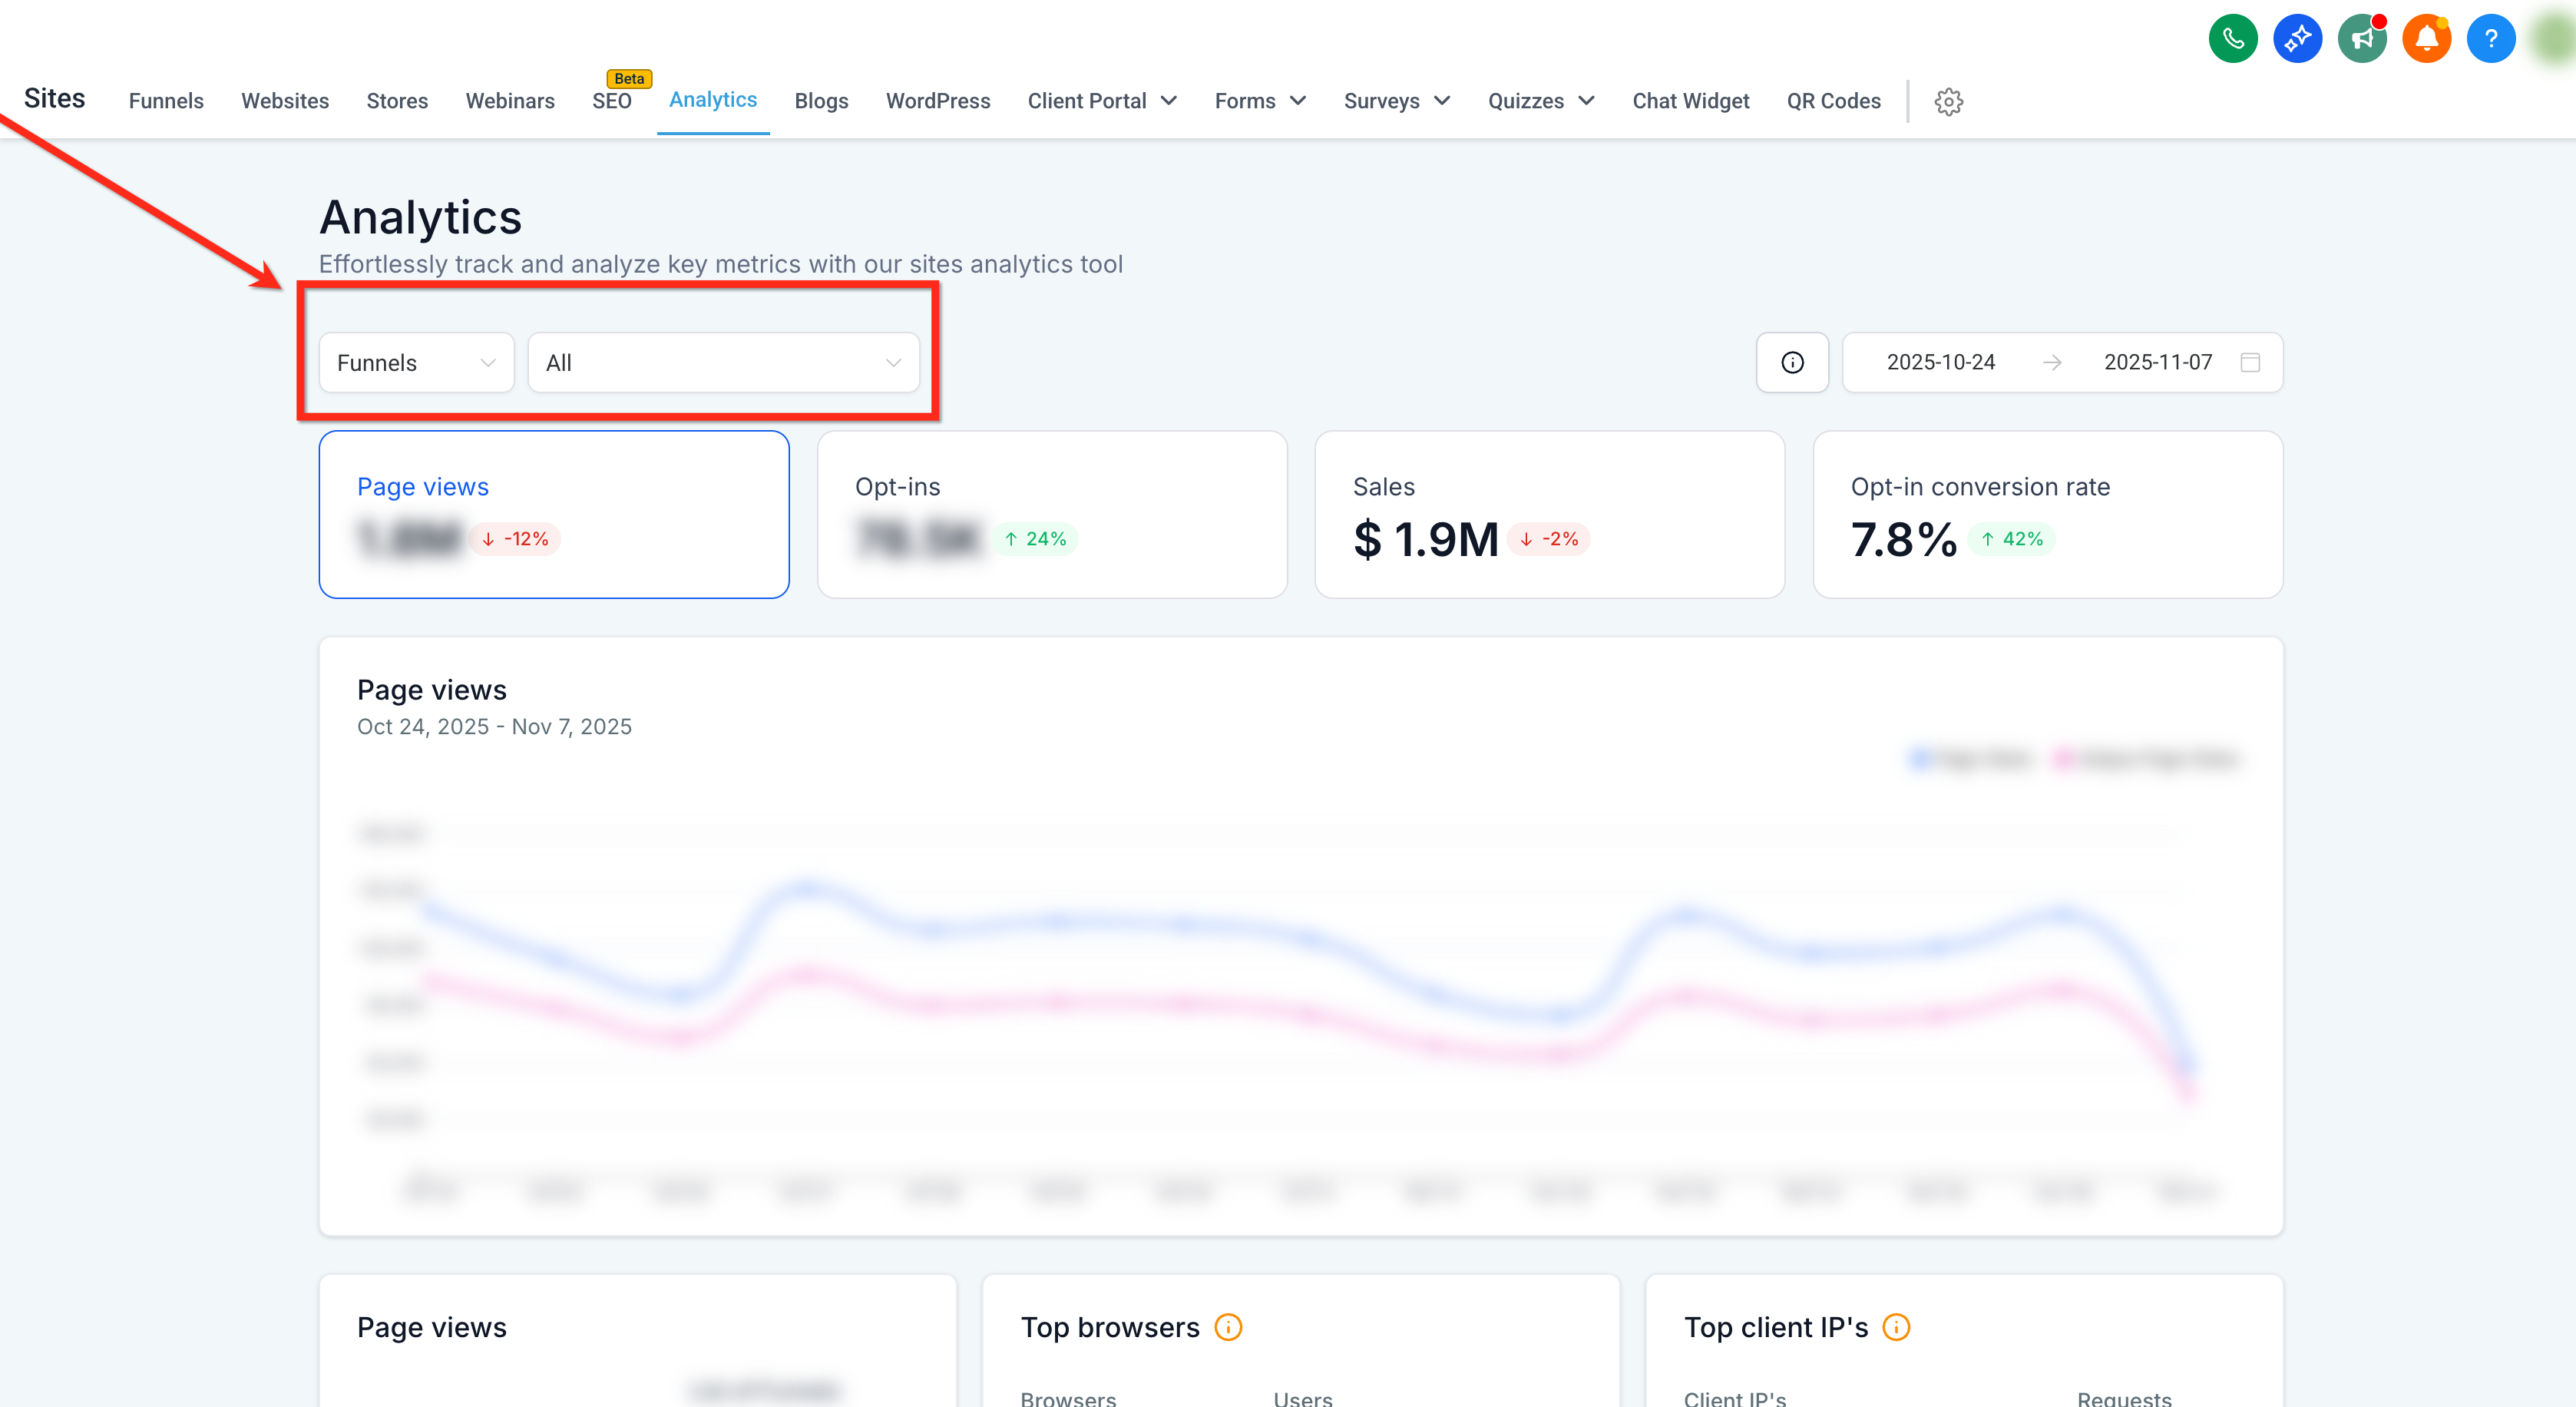
Step 2: Choose between Funnels or Websites
Use the dropdown at the top-left of the dashboard to select whether you want to view data for Funnels, Websites, or Webinars. You can optionally filter to a specific site using the second dropdown.
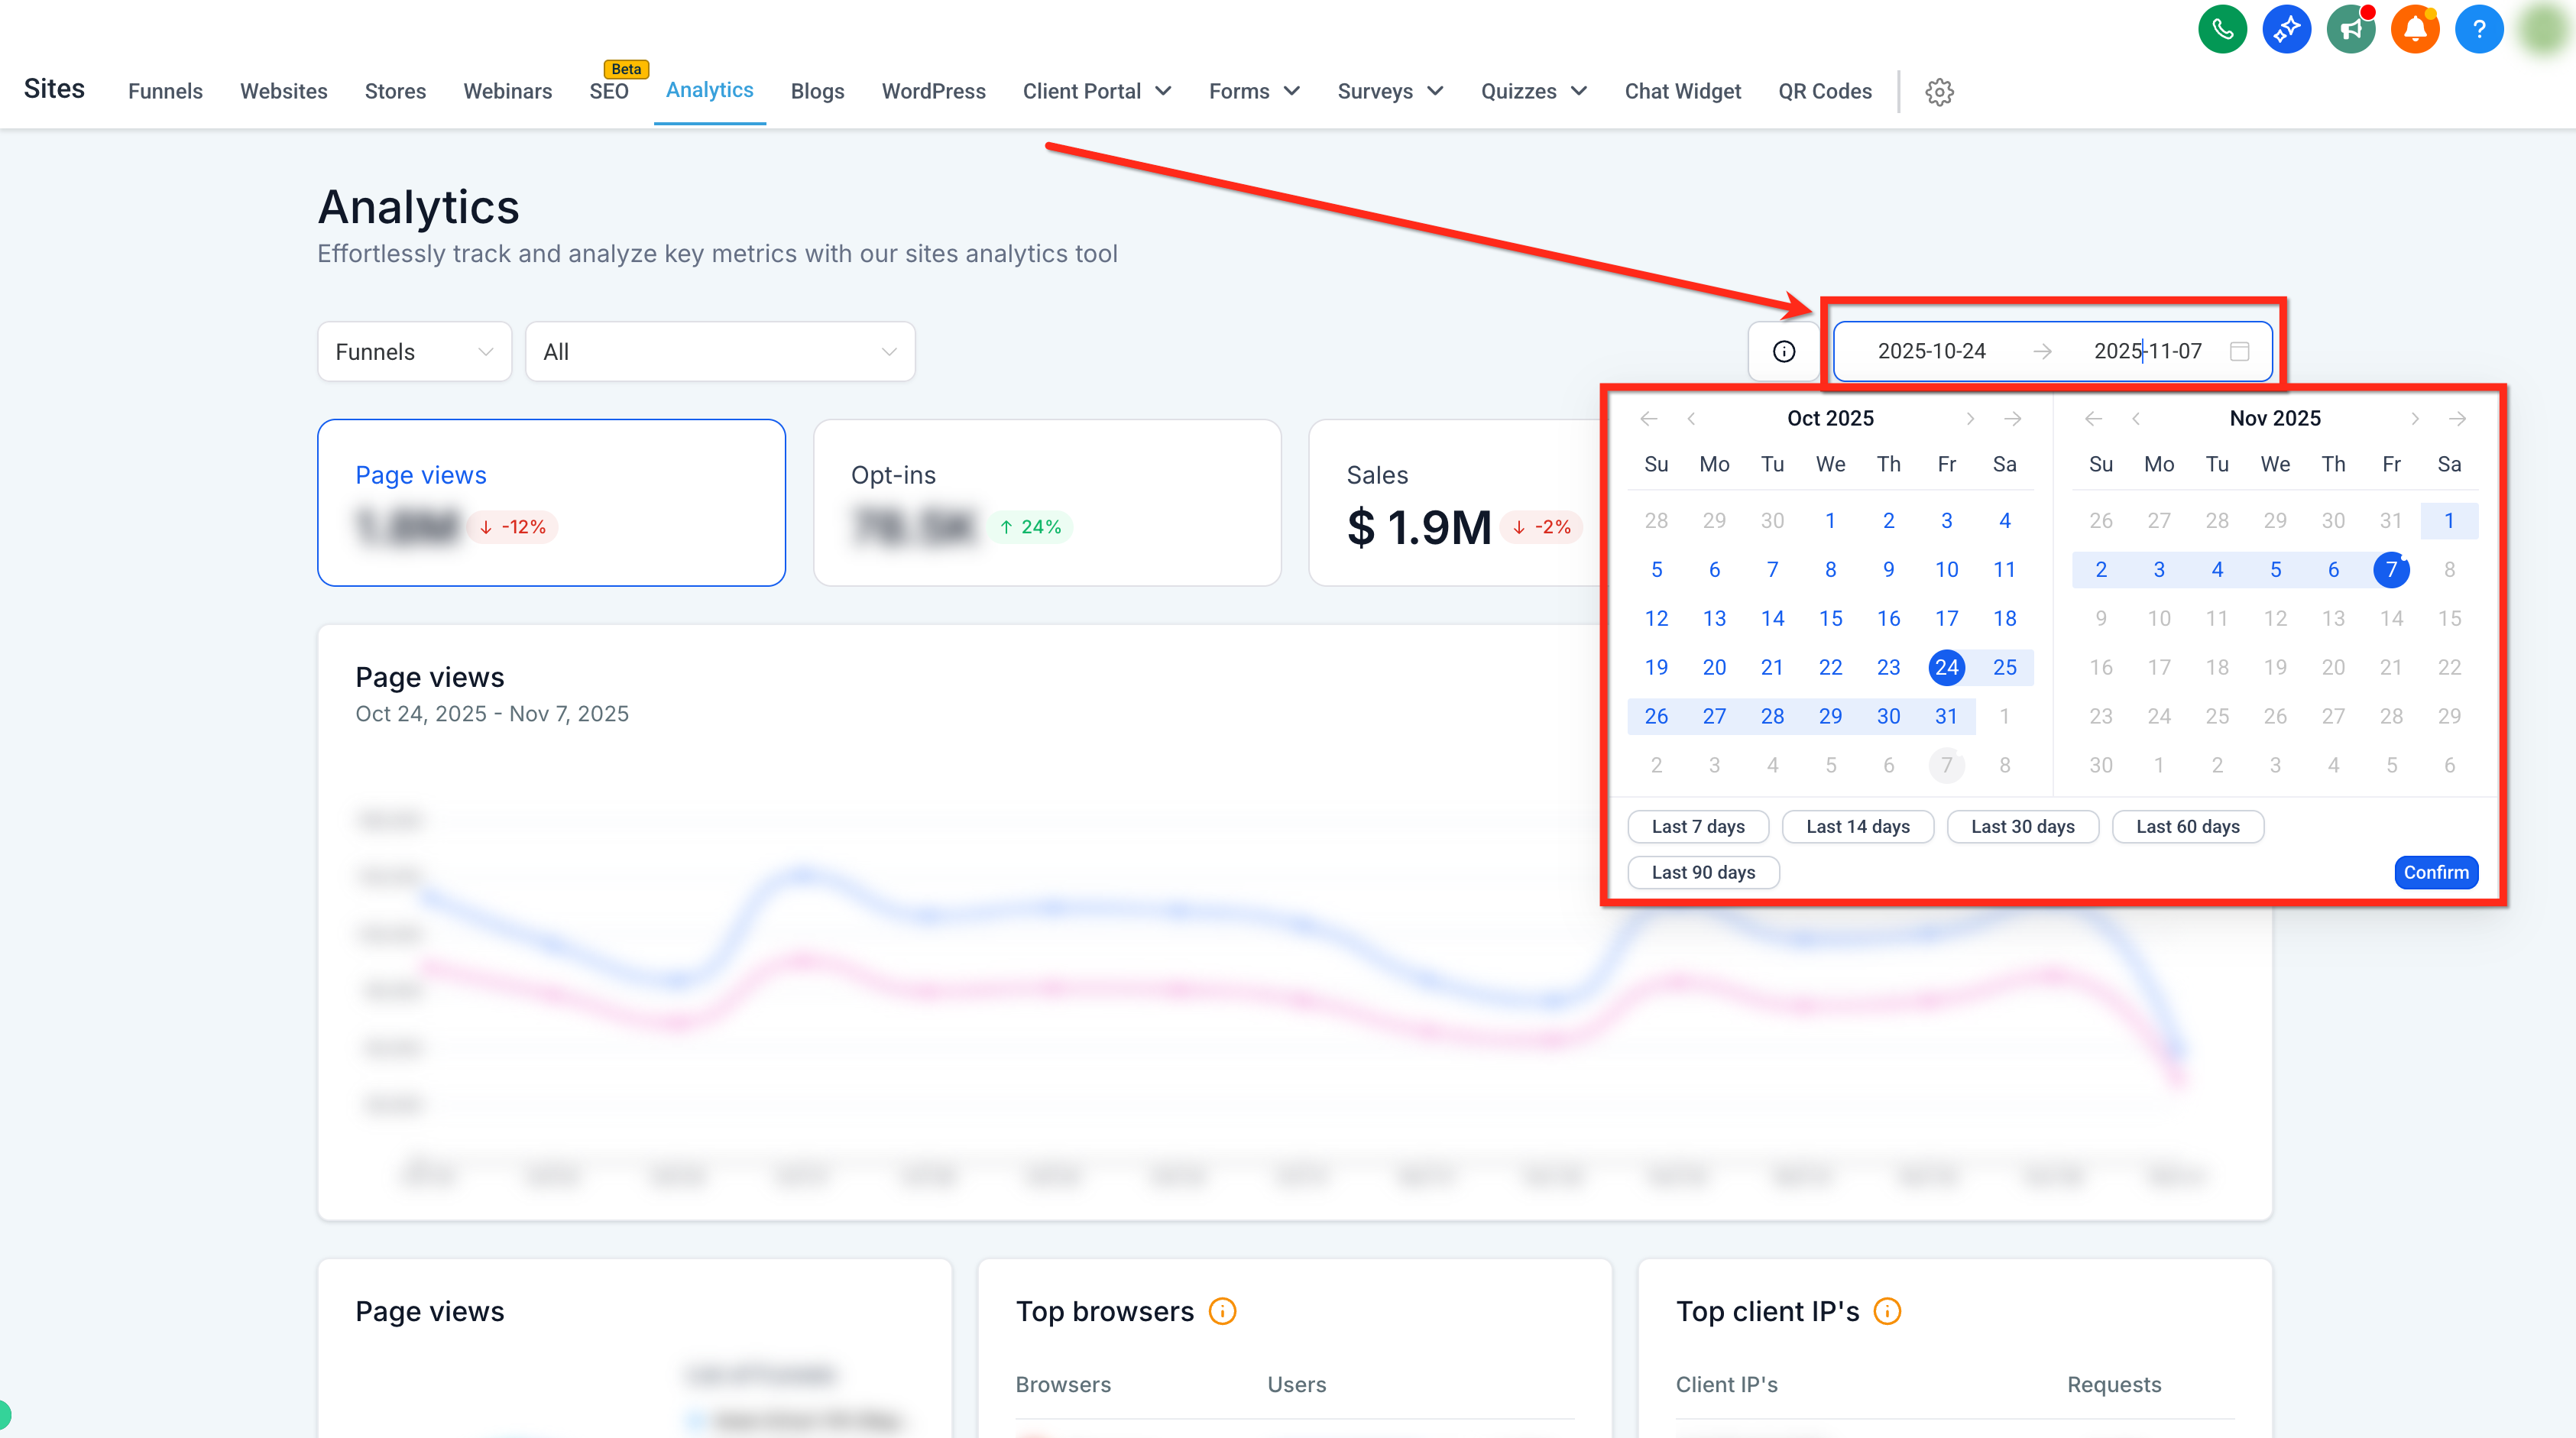
Step 3: Set your date range
Use the Date Selector in the top-right to choose a time period to filter the data.
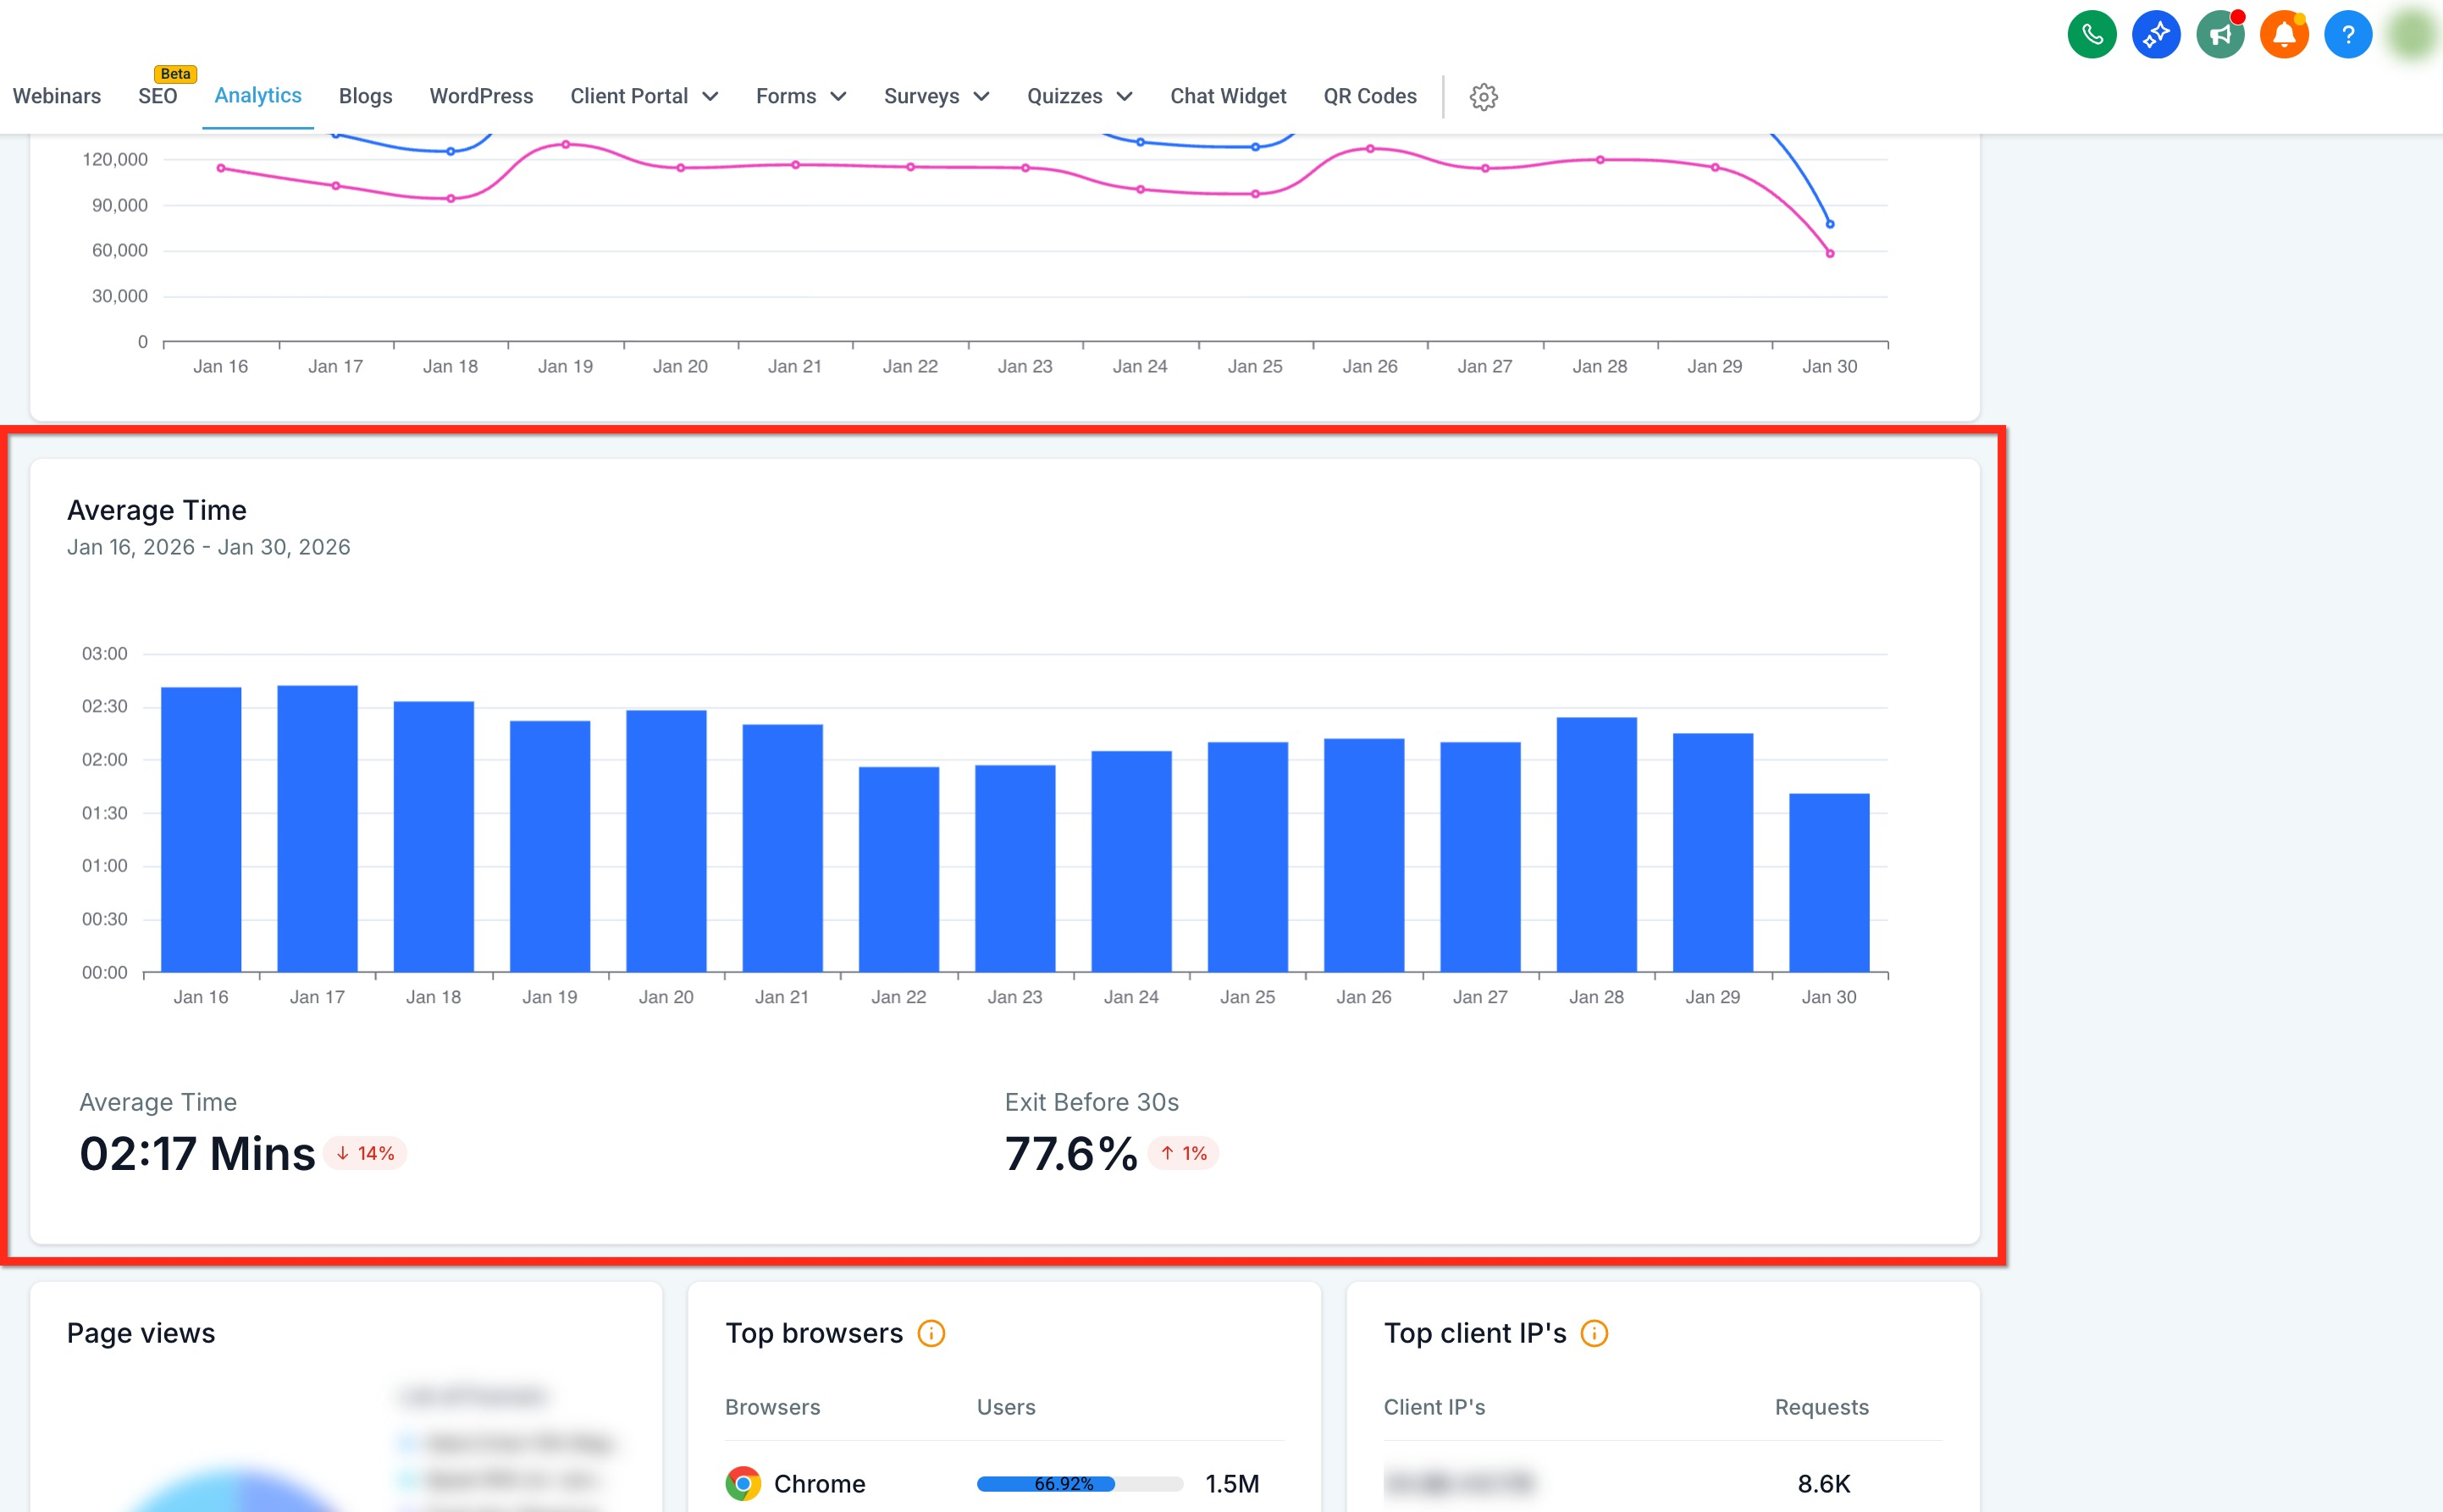
Step 4: View the "Average Time" card
Scroll down to the "Average Time" card. From here you can:
View the percentage of visitors who exited before 30 seconds.
View average time spent per session over the selected time period.
Hover any column to see average time spent per session during that period.
Q: What types of sites support Average Time metrics?
Funnels, Websites, and Webinars.
Q: How is idle time treated if a visitor leaves a tab open?
Inactive time is capped so idle tabs do not inflate your average session duration.
Q: How are ultra-short visits handled?
Sessions under 2 seconds are excluded to reduce noise from accidental clicks or instant bounces.