The Analytics dashboard is your central workspace for measuring how your web assets attract, engage, and convert visitors. From one consistent view, you can track performance across funnels, websites, blogs, webinars, forms, surveys, and QR codes, spotting trends and patterns without hopping between individual pages or compiling data by hand.
You choose one asset type to analyze, optionally narrow to a specific asset, and set a date range. The dashboard then summarizes results with clear KPI cards and graph-based visuals, keeping the view focused on the metrics that matter most while still giving you a fast path to explore deeper.
Easy to navigate: An intuitive design lets you move through your data with ease.
Actionable insights: Make informed decisions to optimize your funnels and websites for better performance.
Efficient: Quickly identify trends and patterns without manually compiling data.
Page Views: How many times any funnel, website, or other asset was visited, along with insights on unique page views.
Page Views by Step: Click any funnel, website, or webinar in the Page Views chart to drill down into step-level performance.
Opt-in: The number of conversions in your funnel or website (for example, a purchased product, a submitted form or survey, or a booked appointment).
Time on Page: How long a visitor stayed.
Sales: Revenue generated by your funnel or website.
Opt-in Conversion Rate: Opt-ins divided by unique page views.
Detailed definitions for every metric are in the Understanding Your Stats section below.
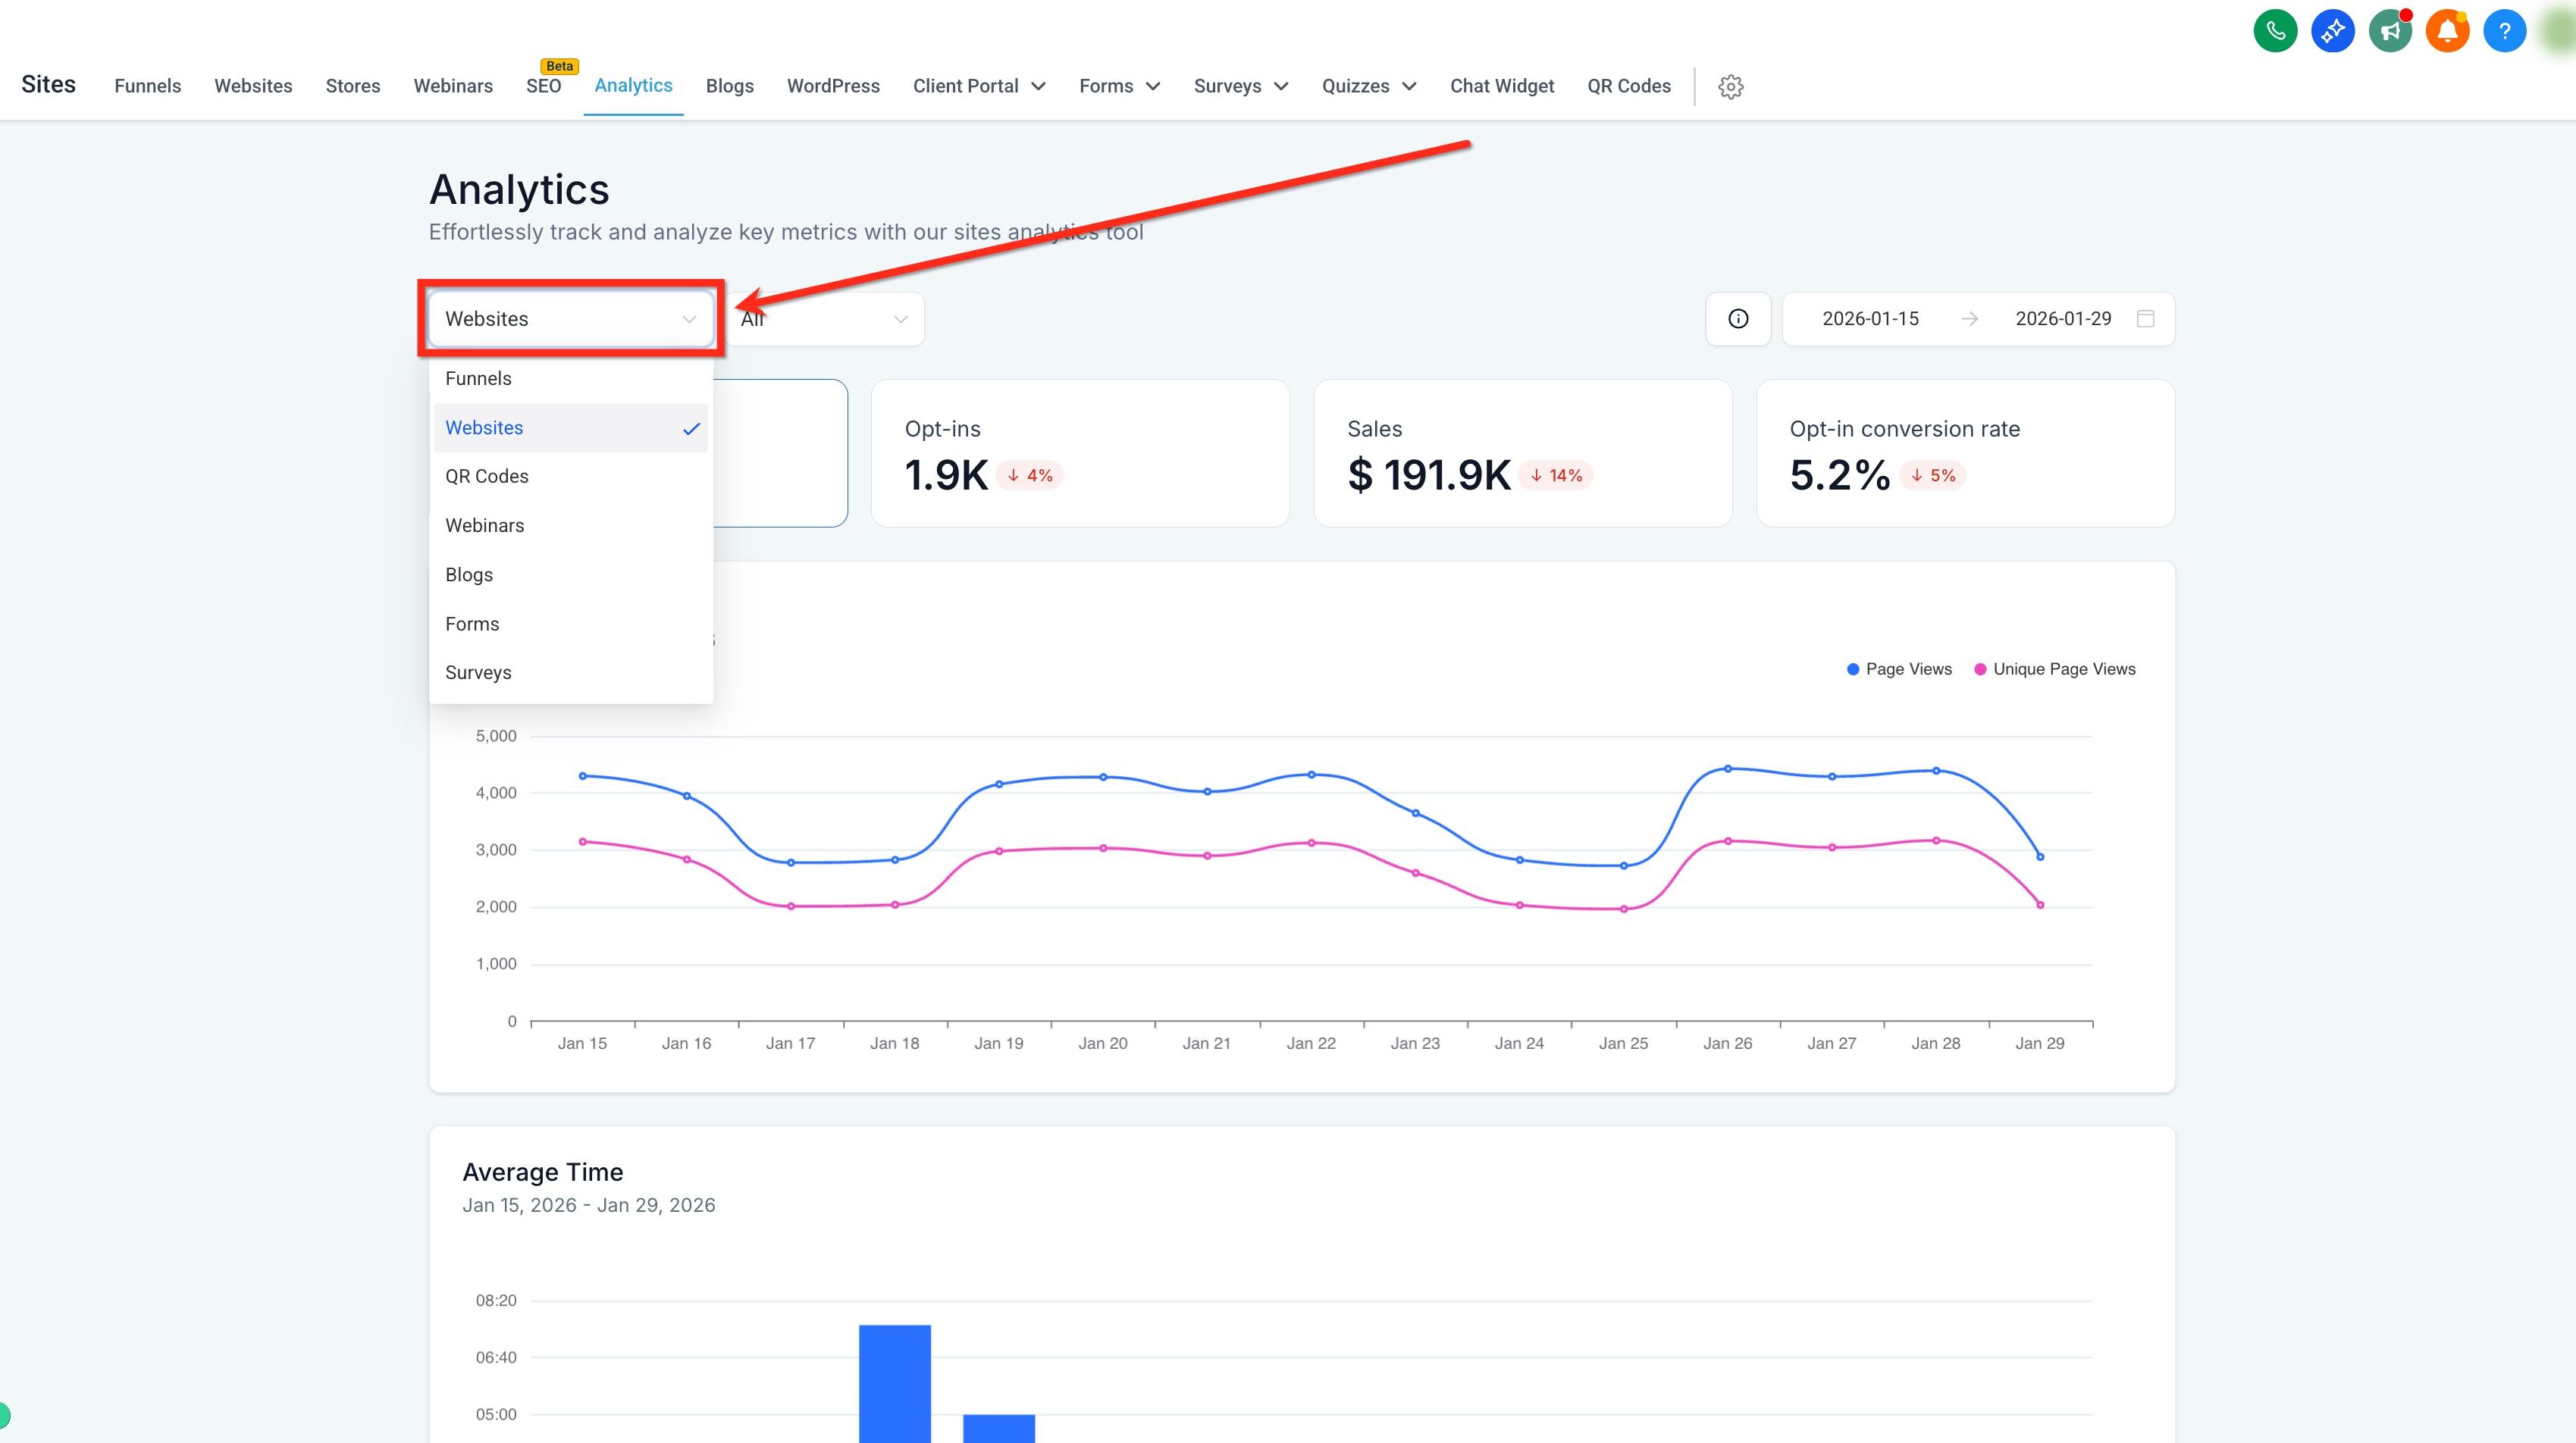
Start by choosing the asset family you want to analyze. This selection is required, and only one asset type can be active at a time. Your choice determines which KPI cards and charts appear in the dashboard.
Use the dropdown to choose one asset type: Funnels, Websites, Blogs, Webinars, Forms, Surveys, QR Codes, or External Tracking.
Note: The metrics shown in the dashboard change based on the asset type you select.

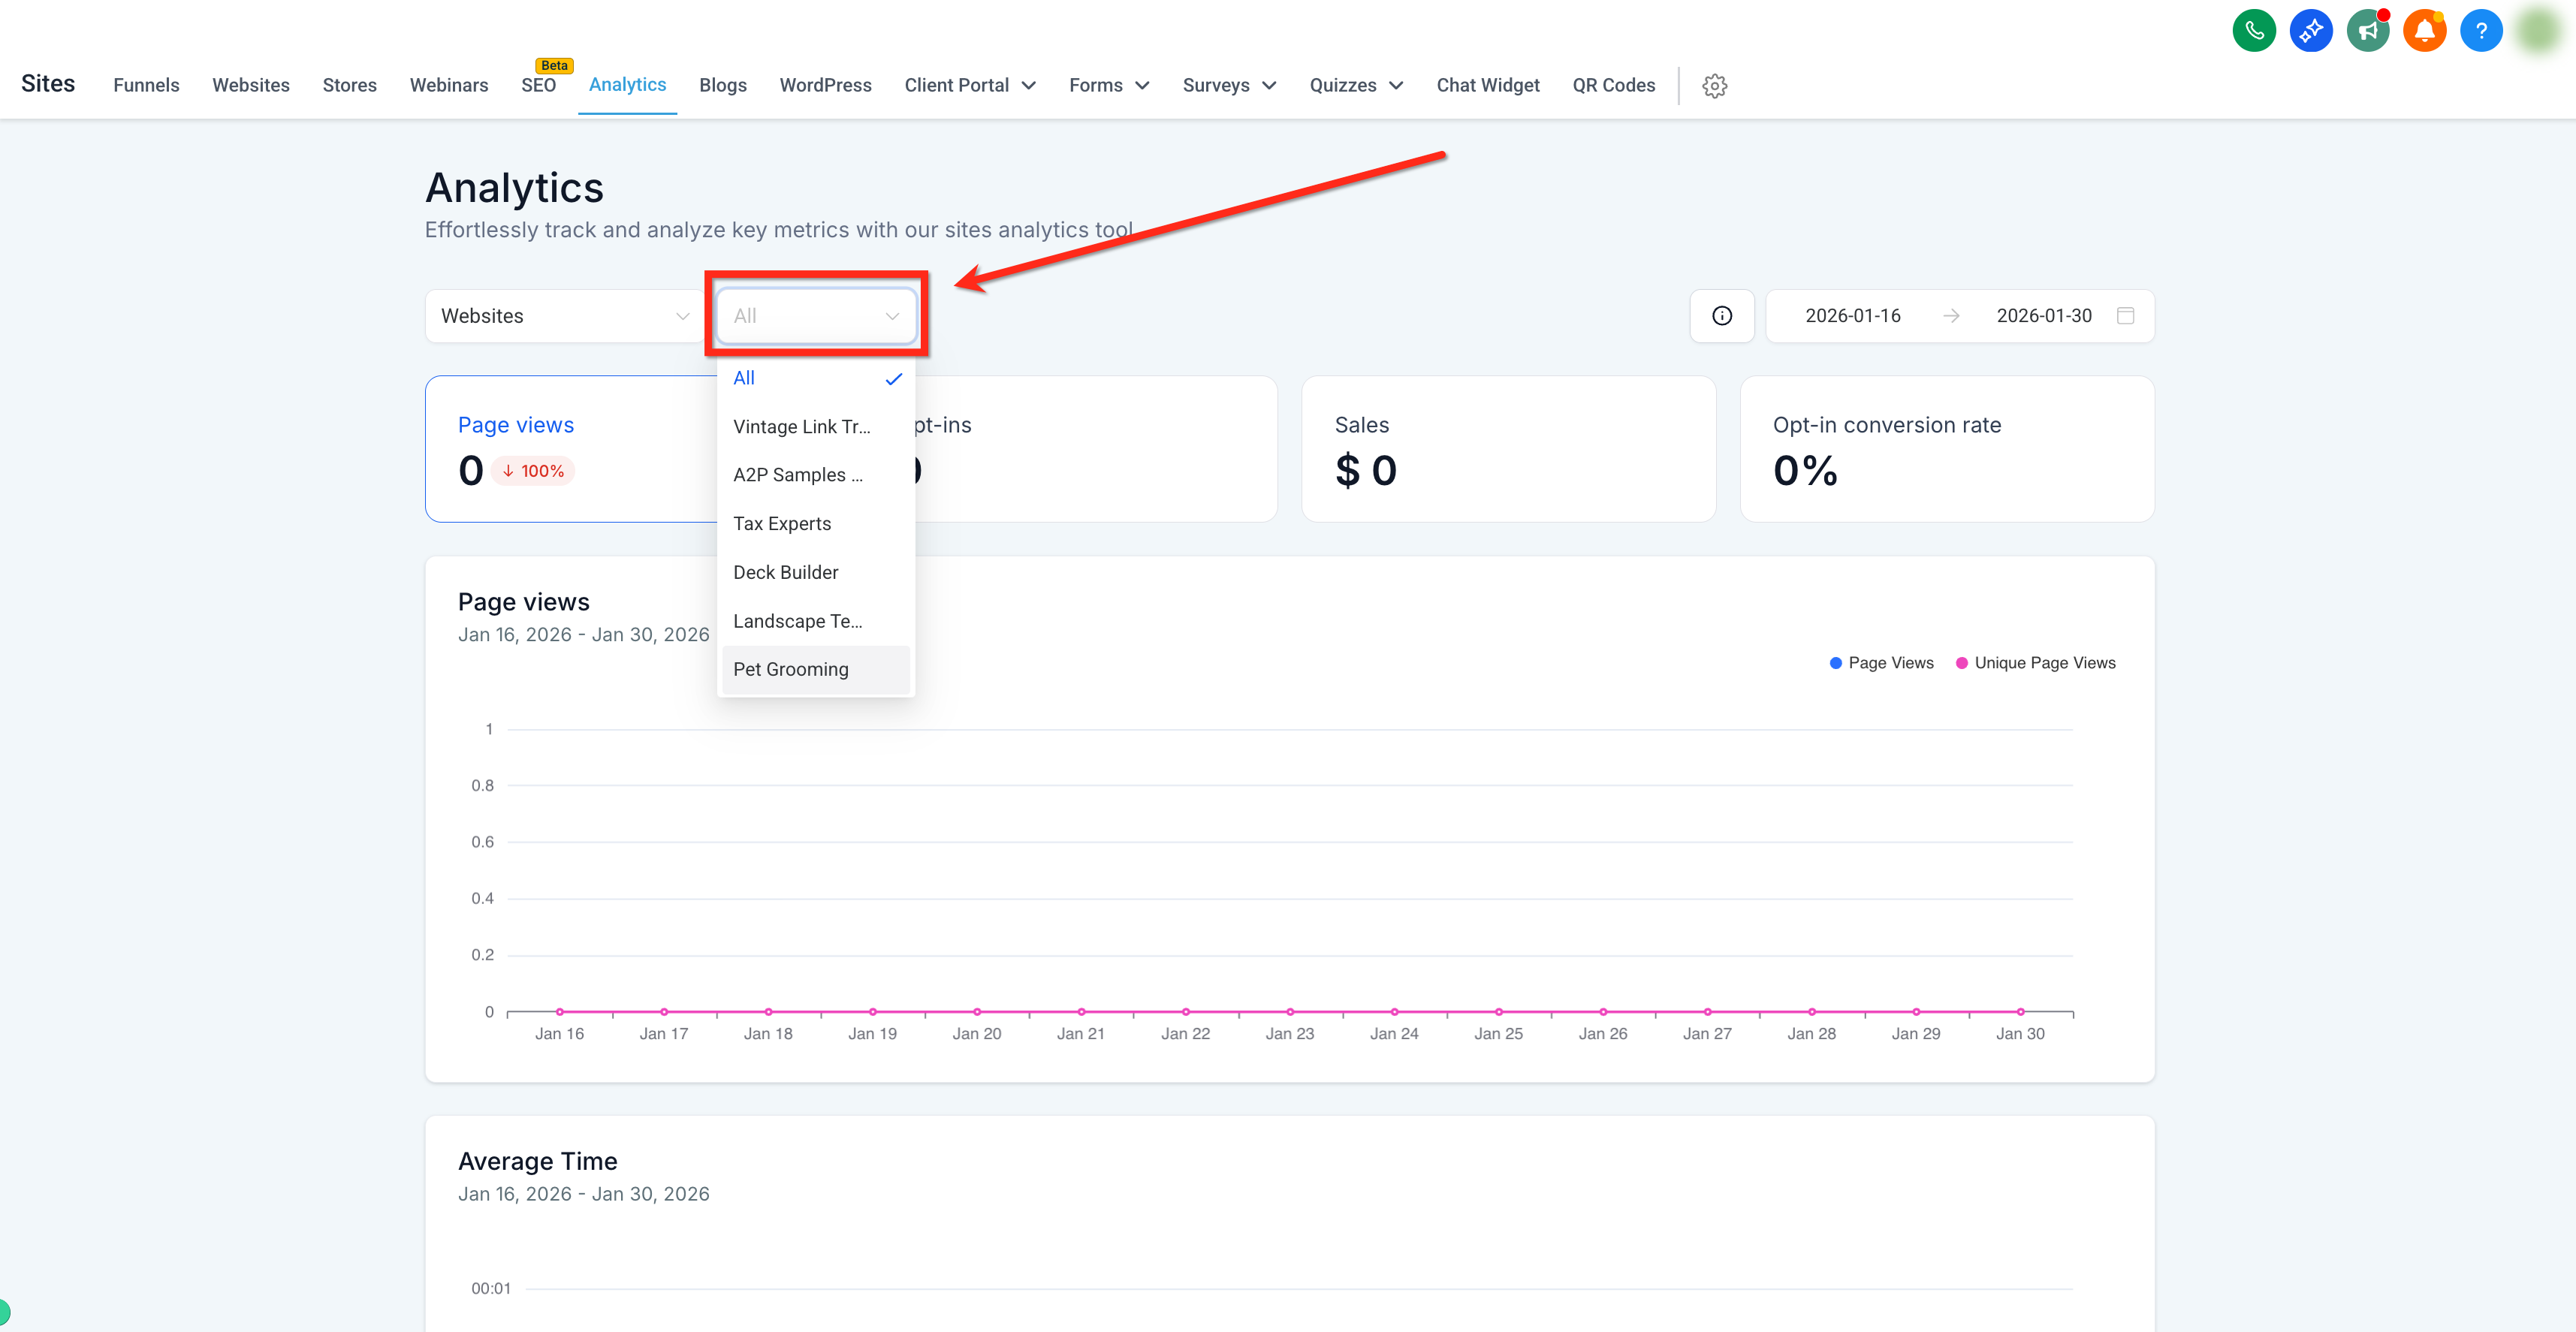
Focus your analysis by applying two filters: pick a specific asset and set a date range.
Choose a single asset within the currently selected asset type (for example, a specific funnel, website, blog, webinar, form, survey, or QR code). Leaving this set to All aggregates results for every asset in that type. Changing the asset type resets this filter back to All.
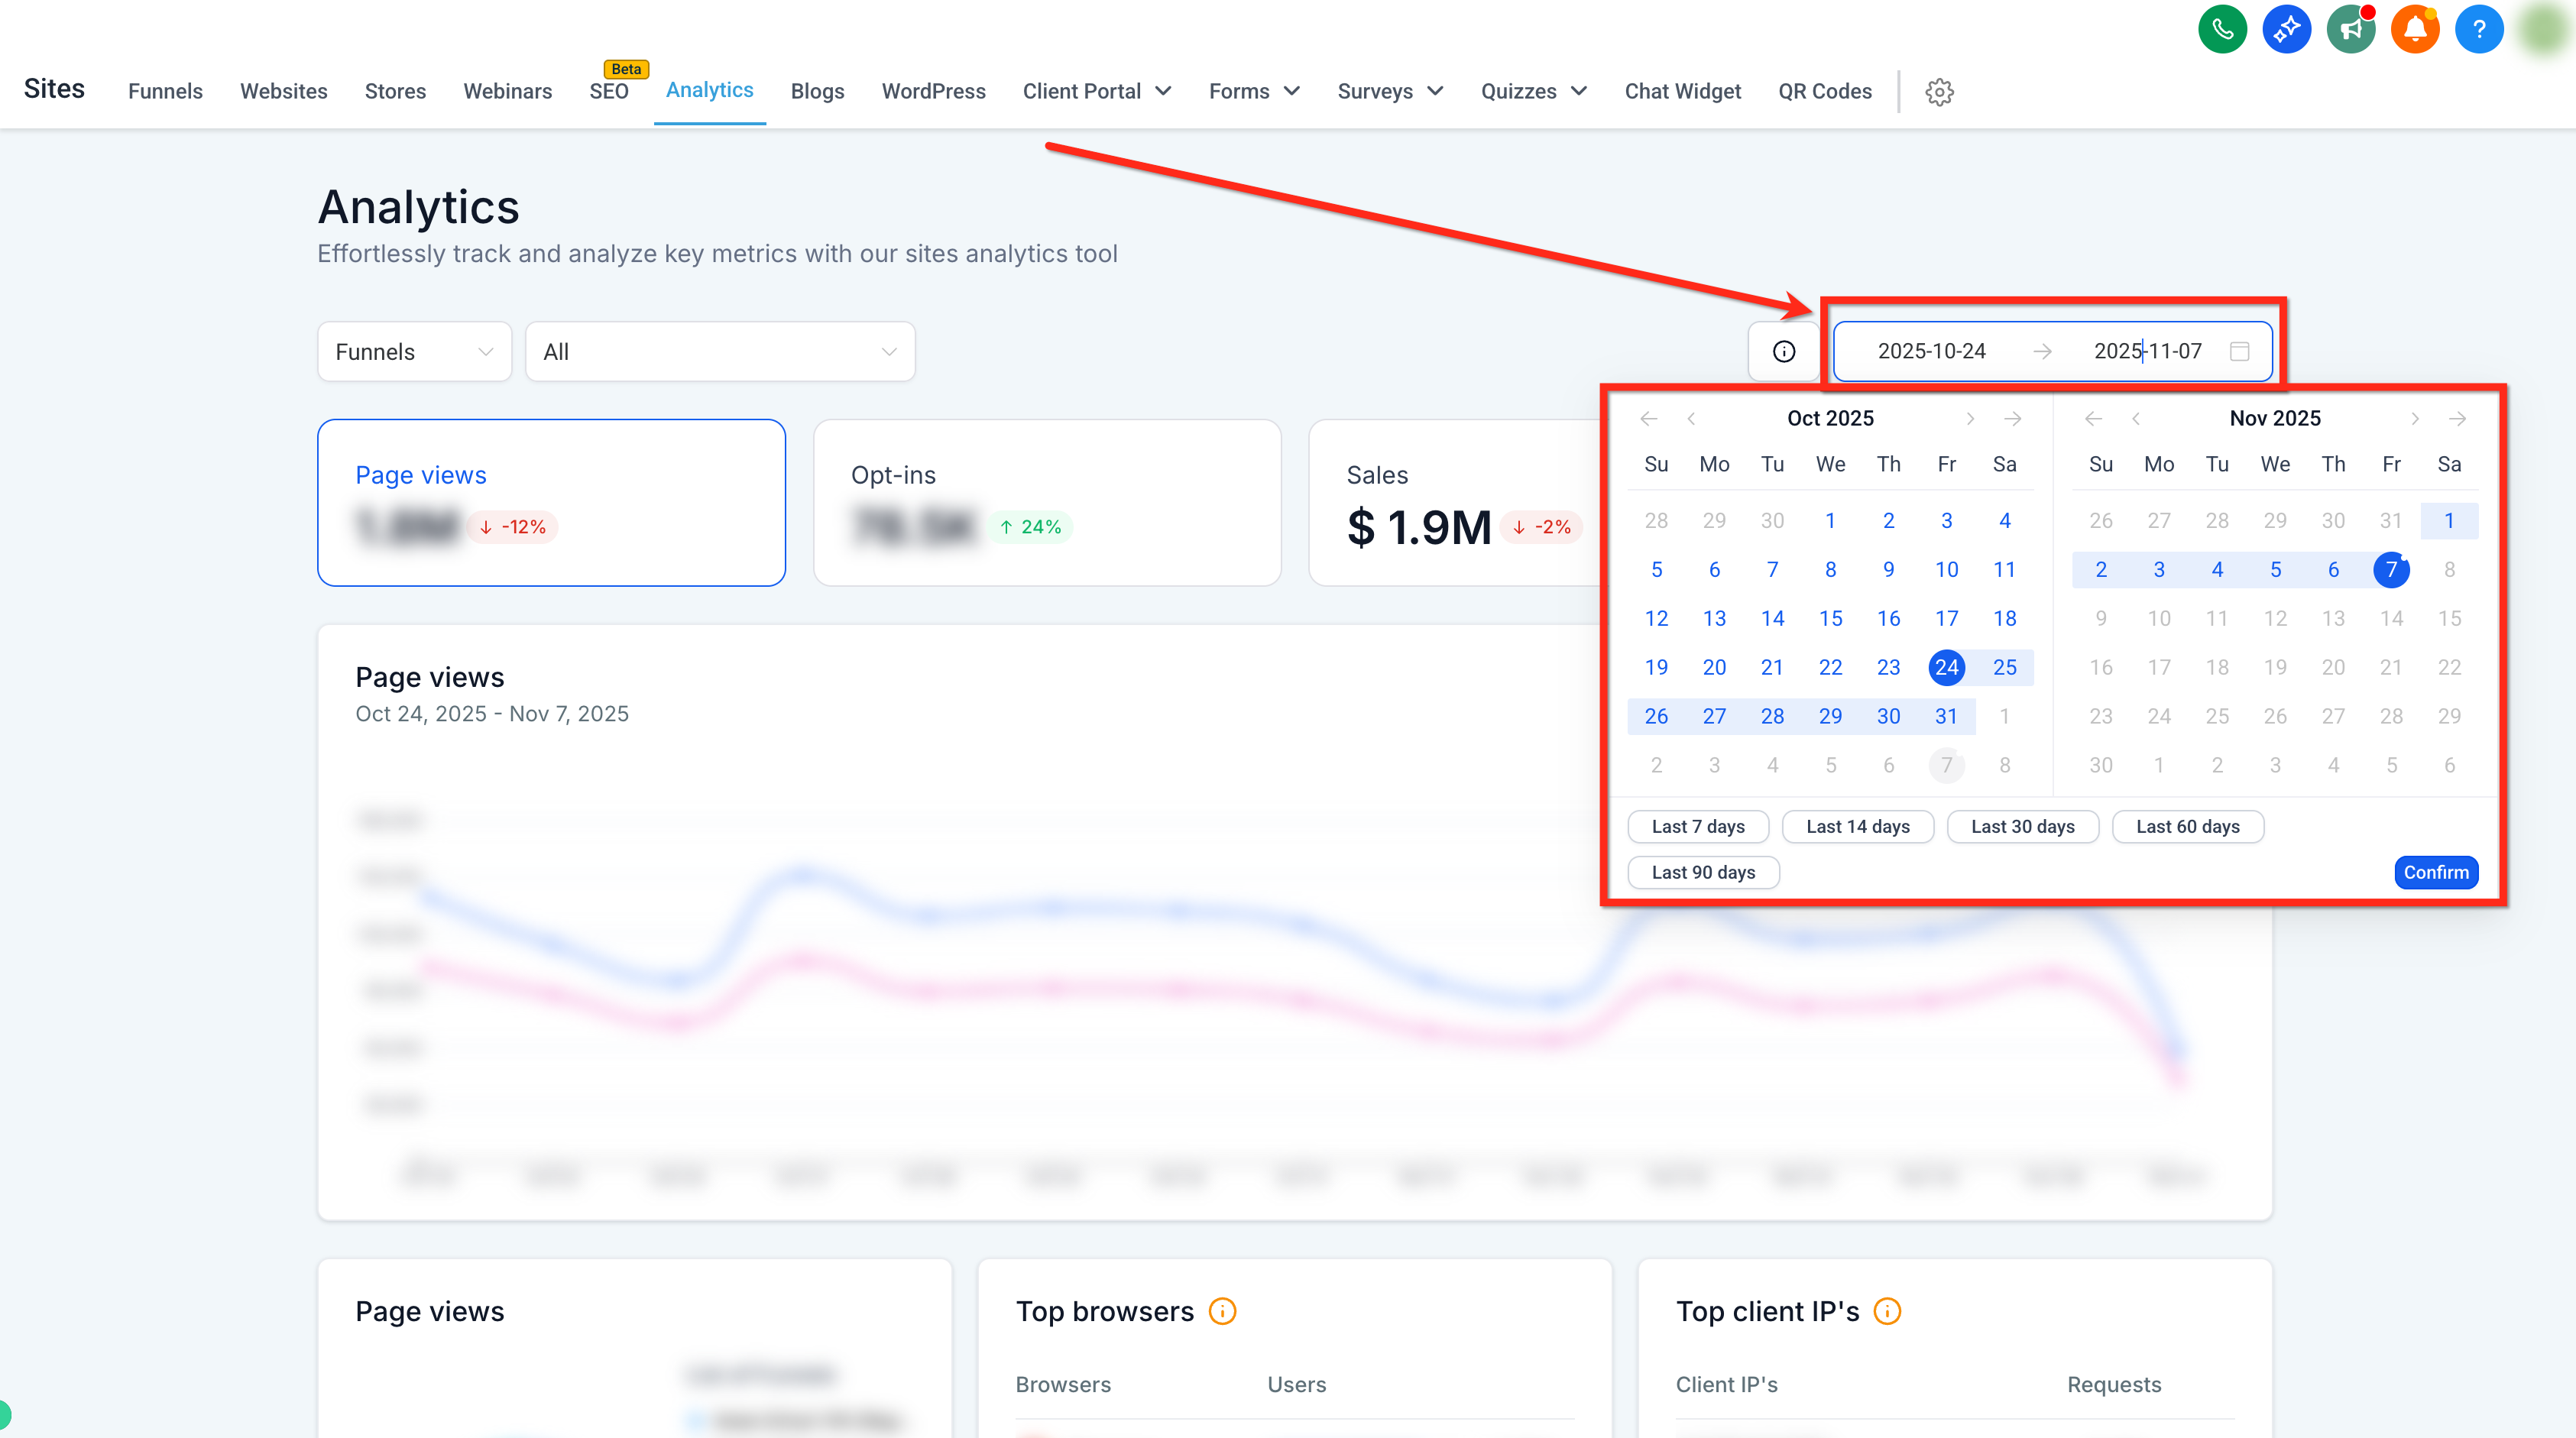
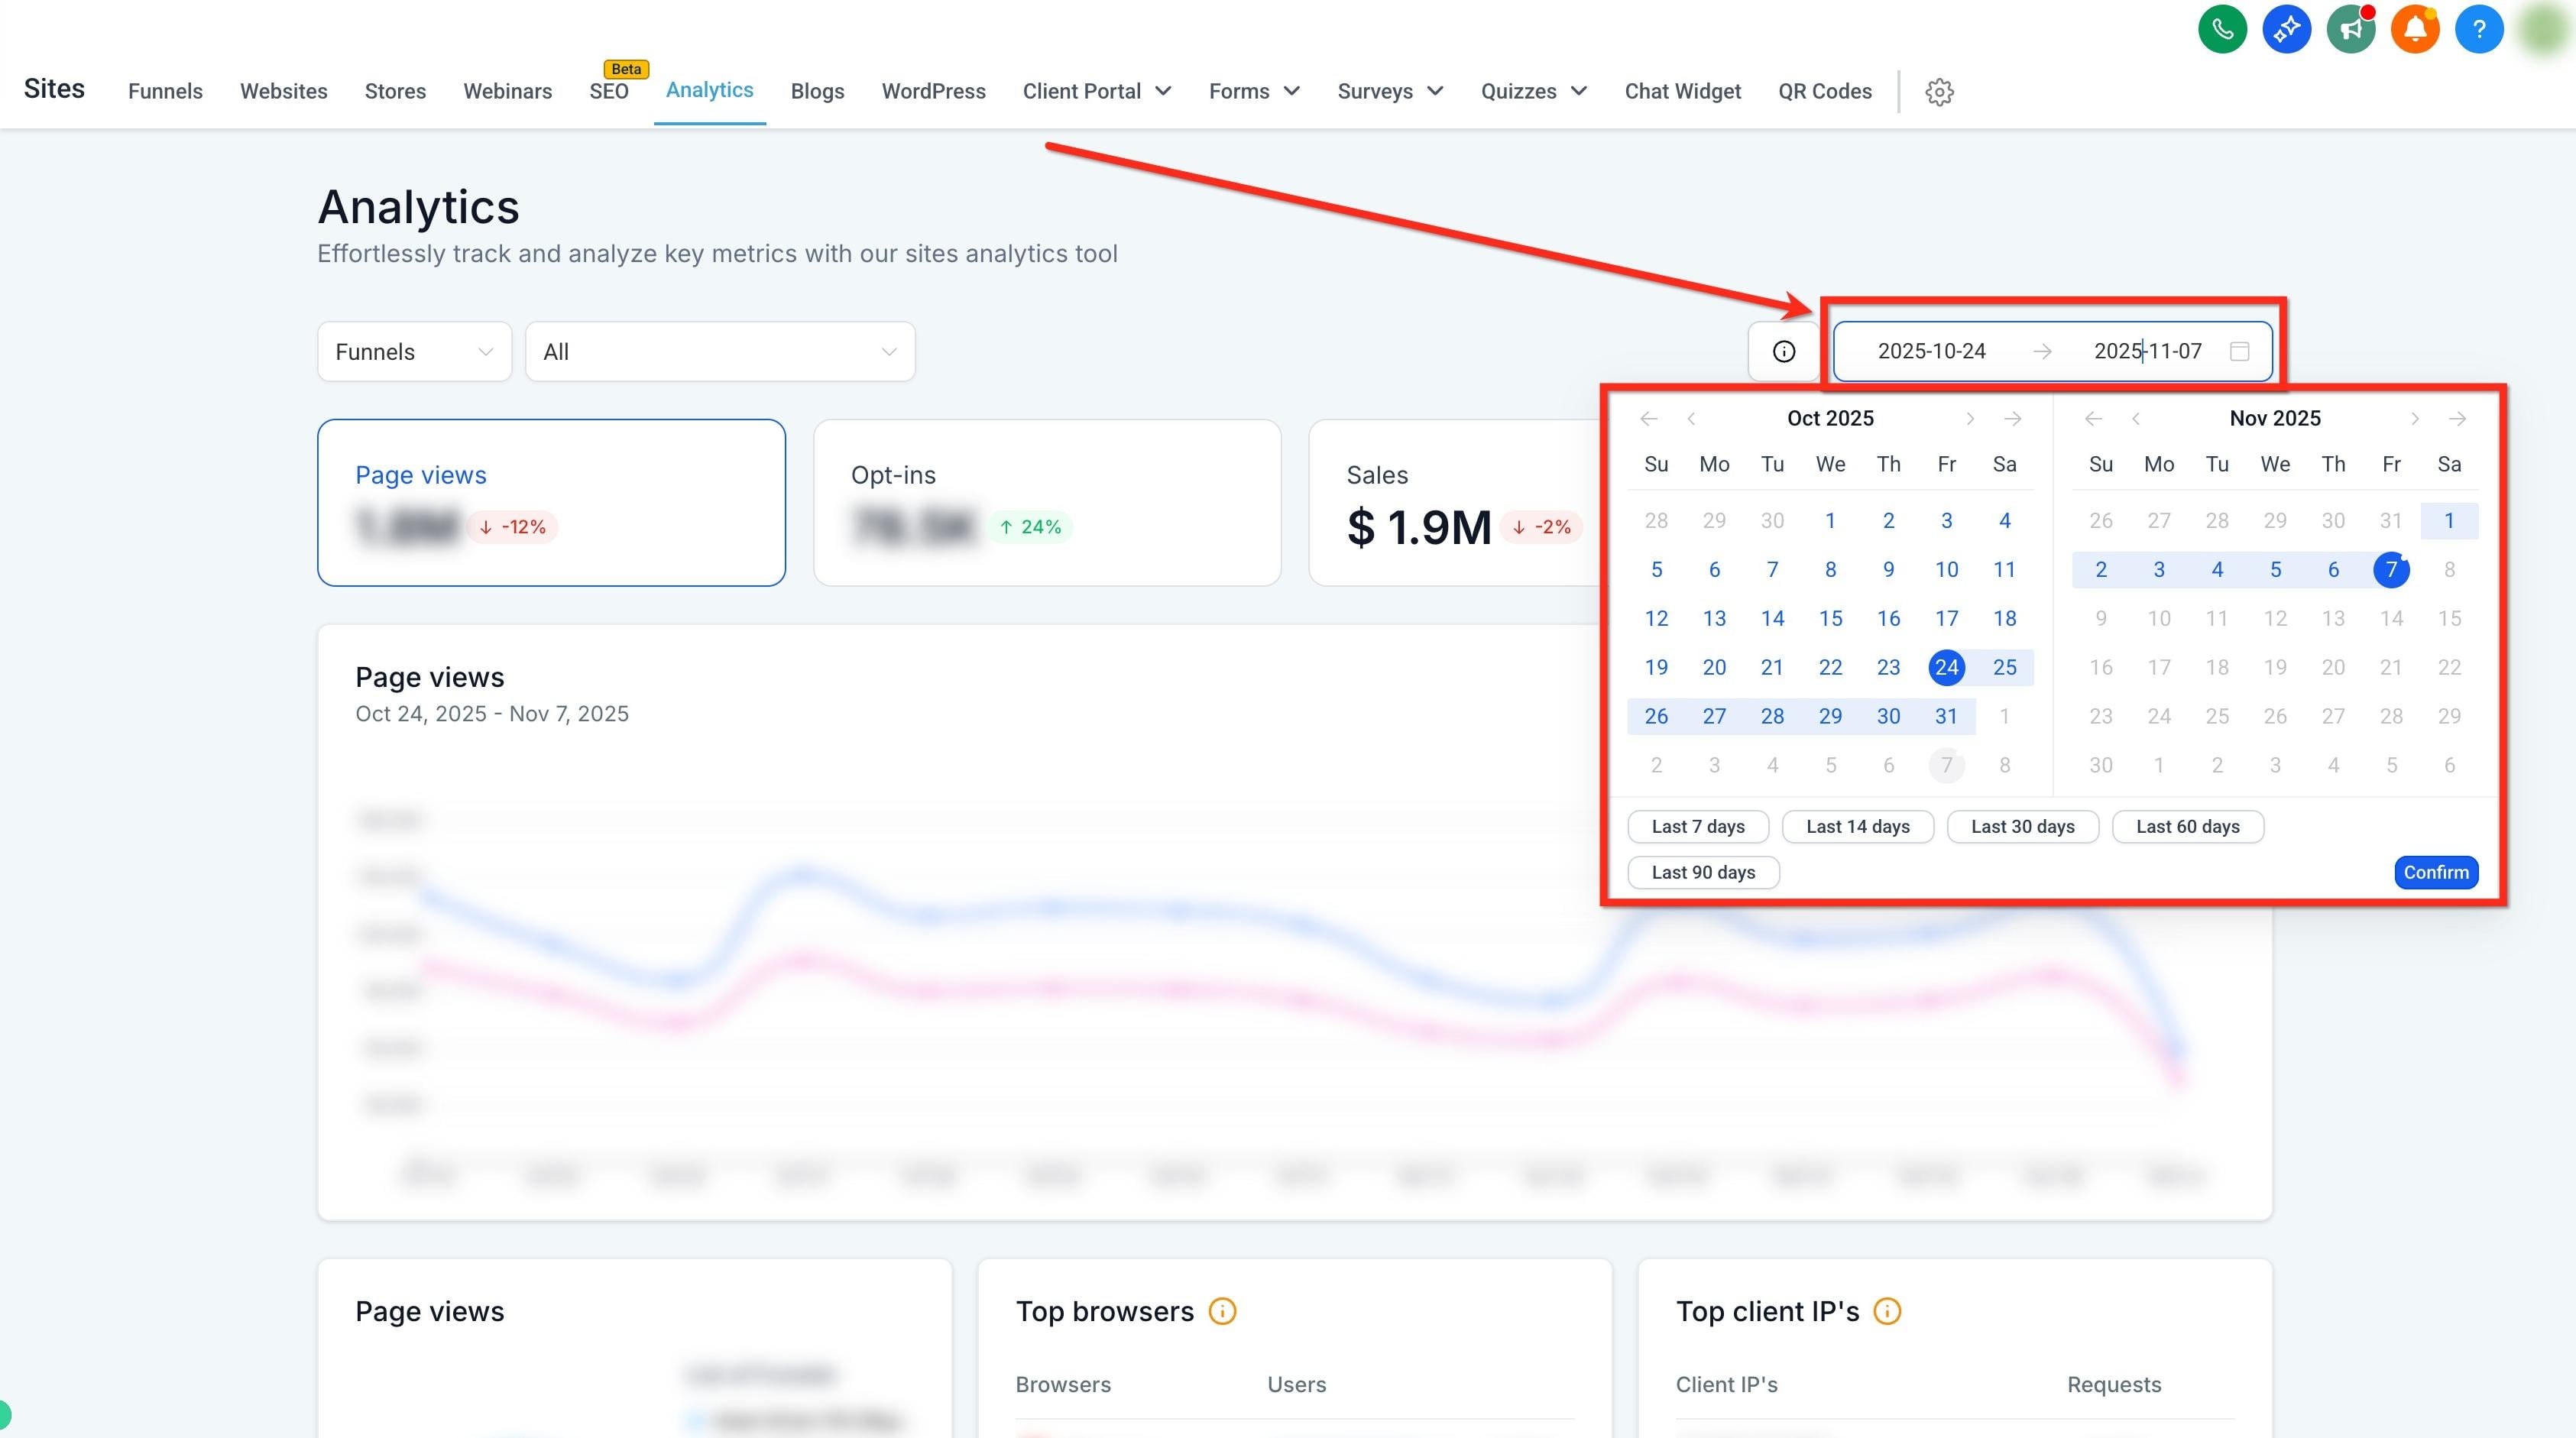
Use the date range picker in the upper-right to select a time period. This lets you view detailed timelines of page views, opt-ins, sales, and order conversion rates for your chosen duration. The dashboard compares data from this period to the immediately previous period of equal length.
The date range defaults to Last 14 days.
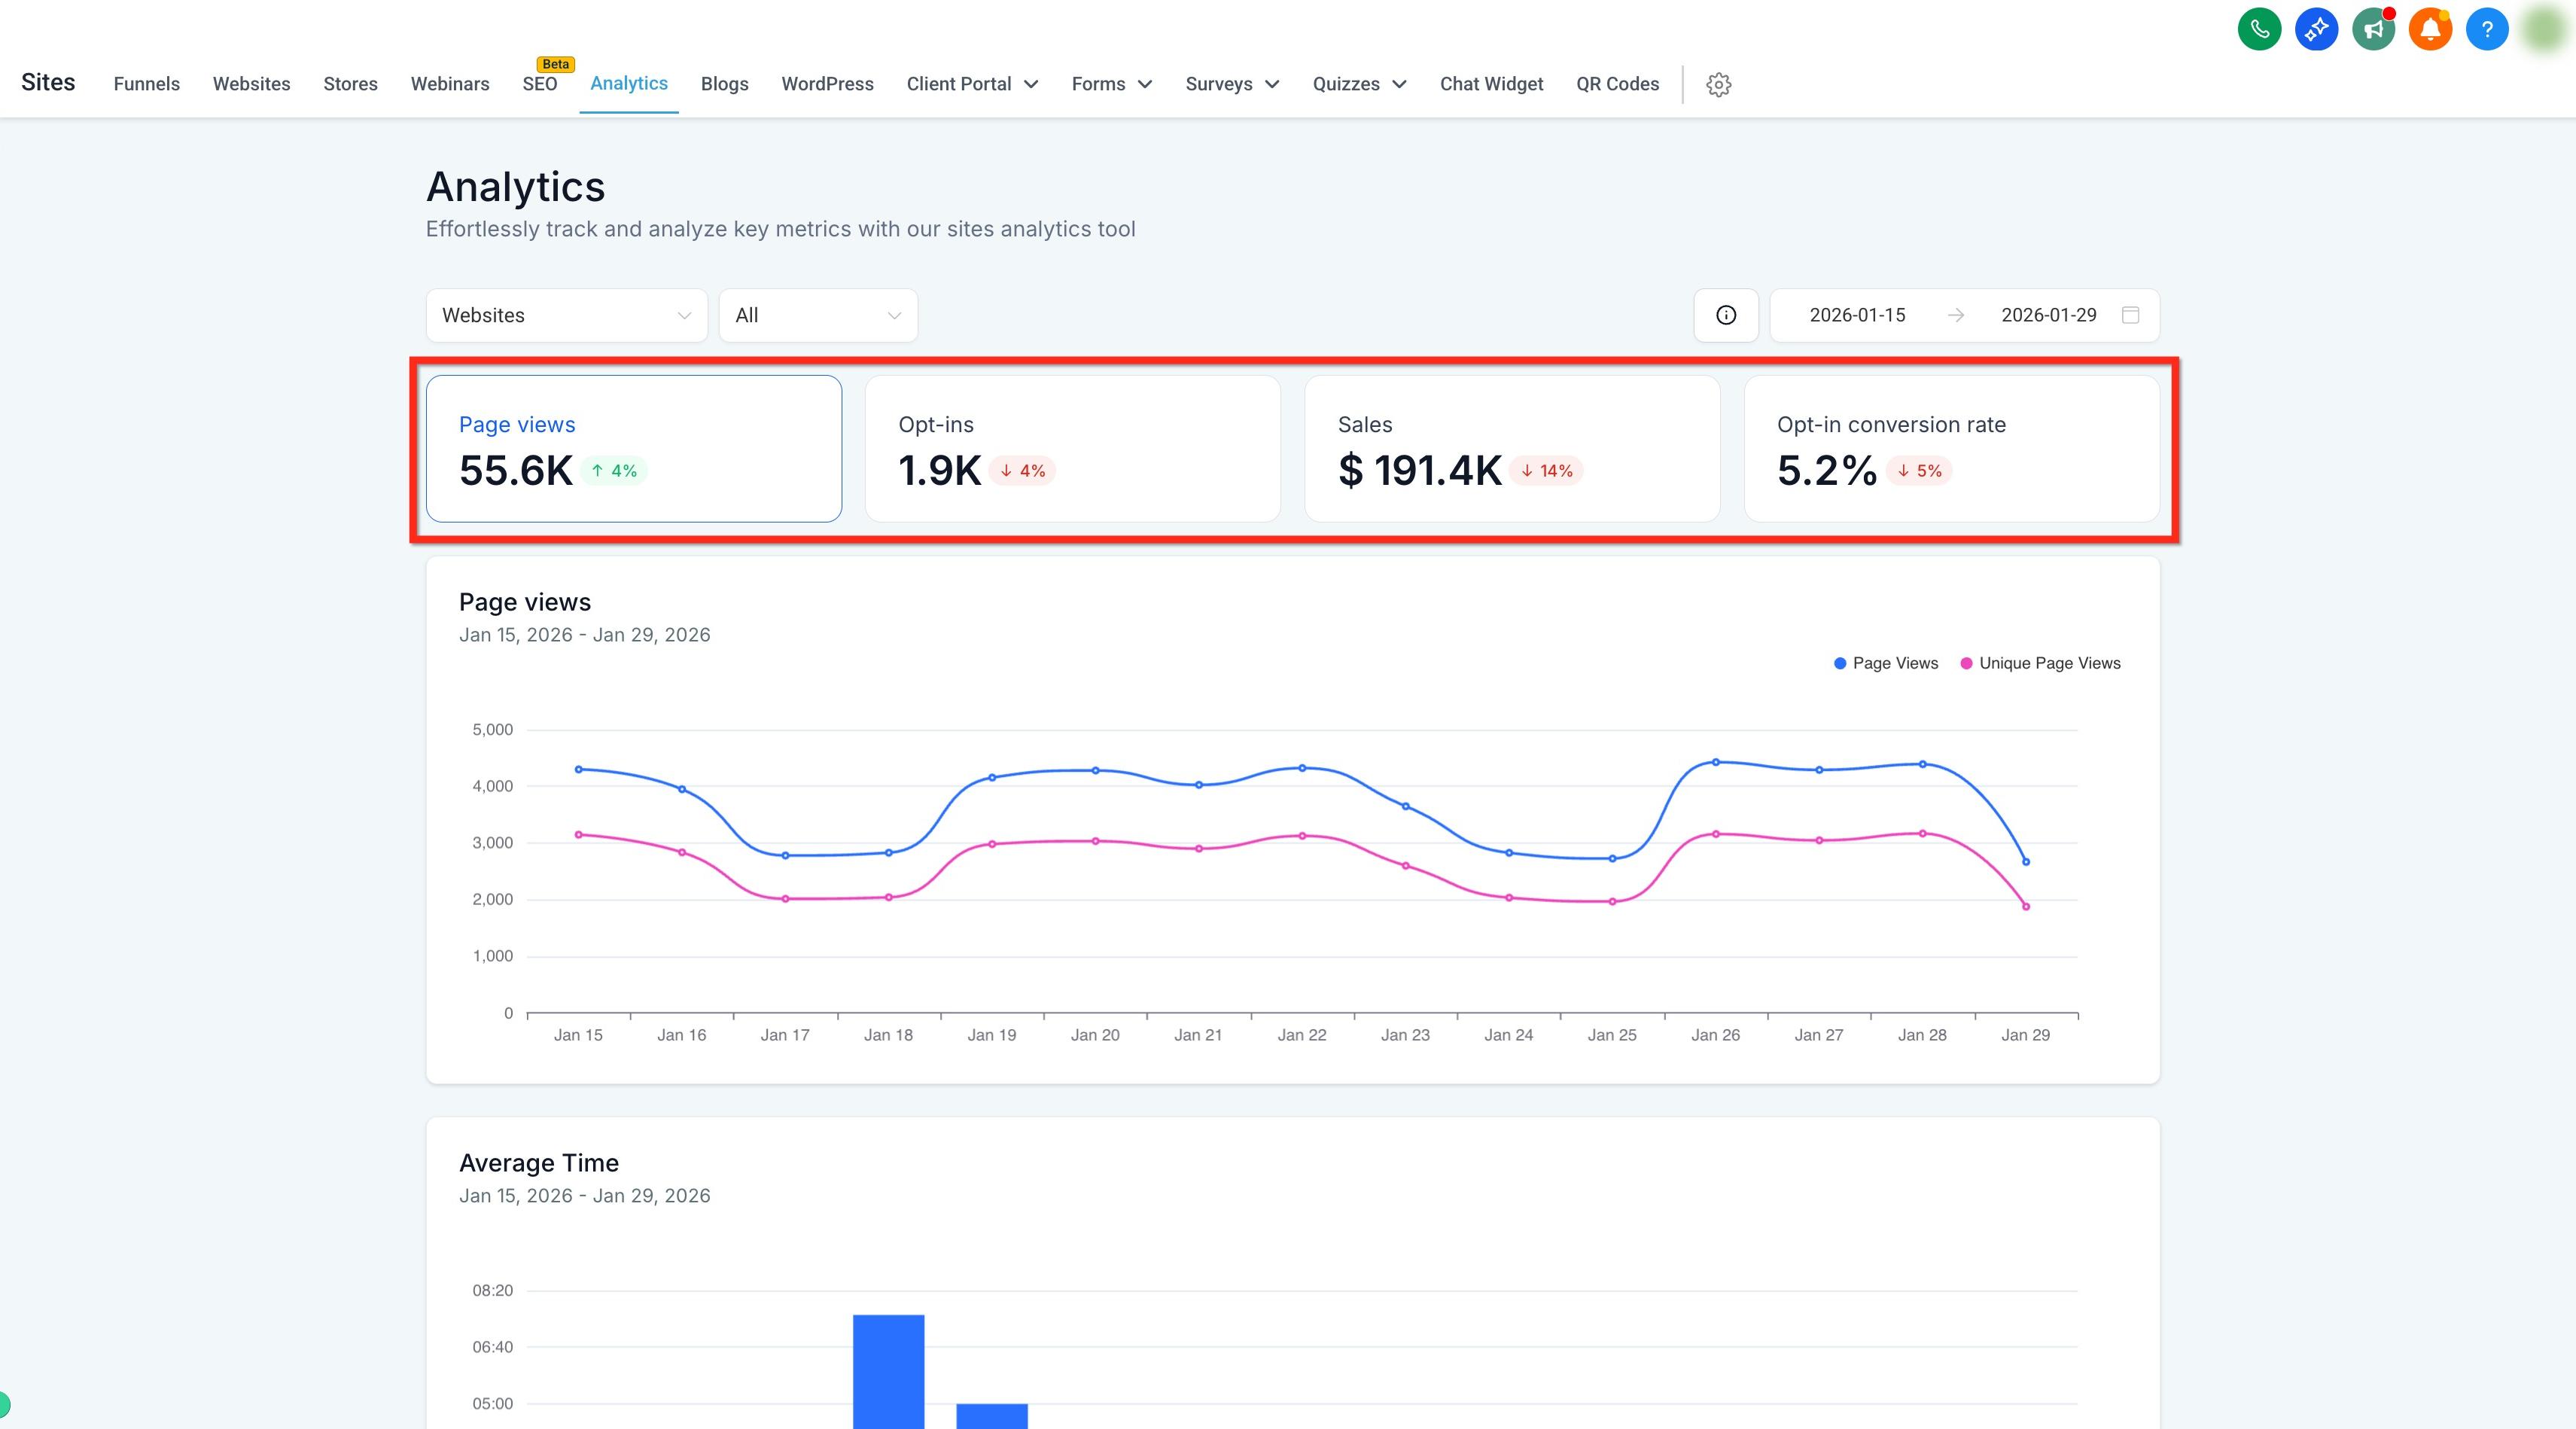
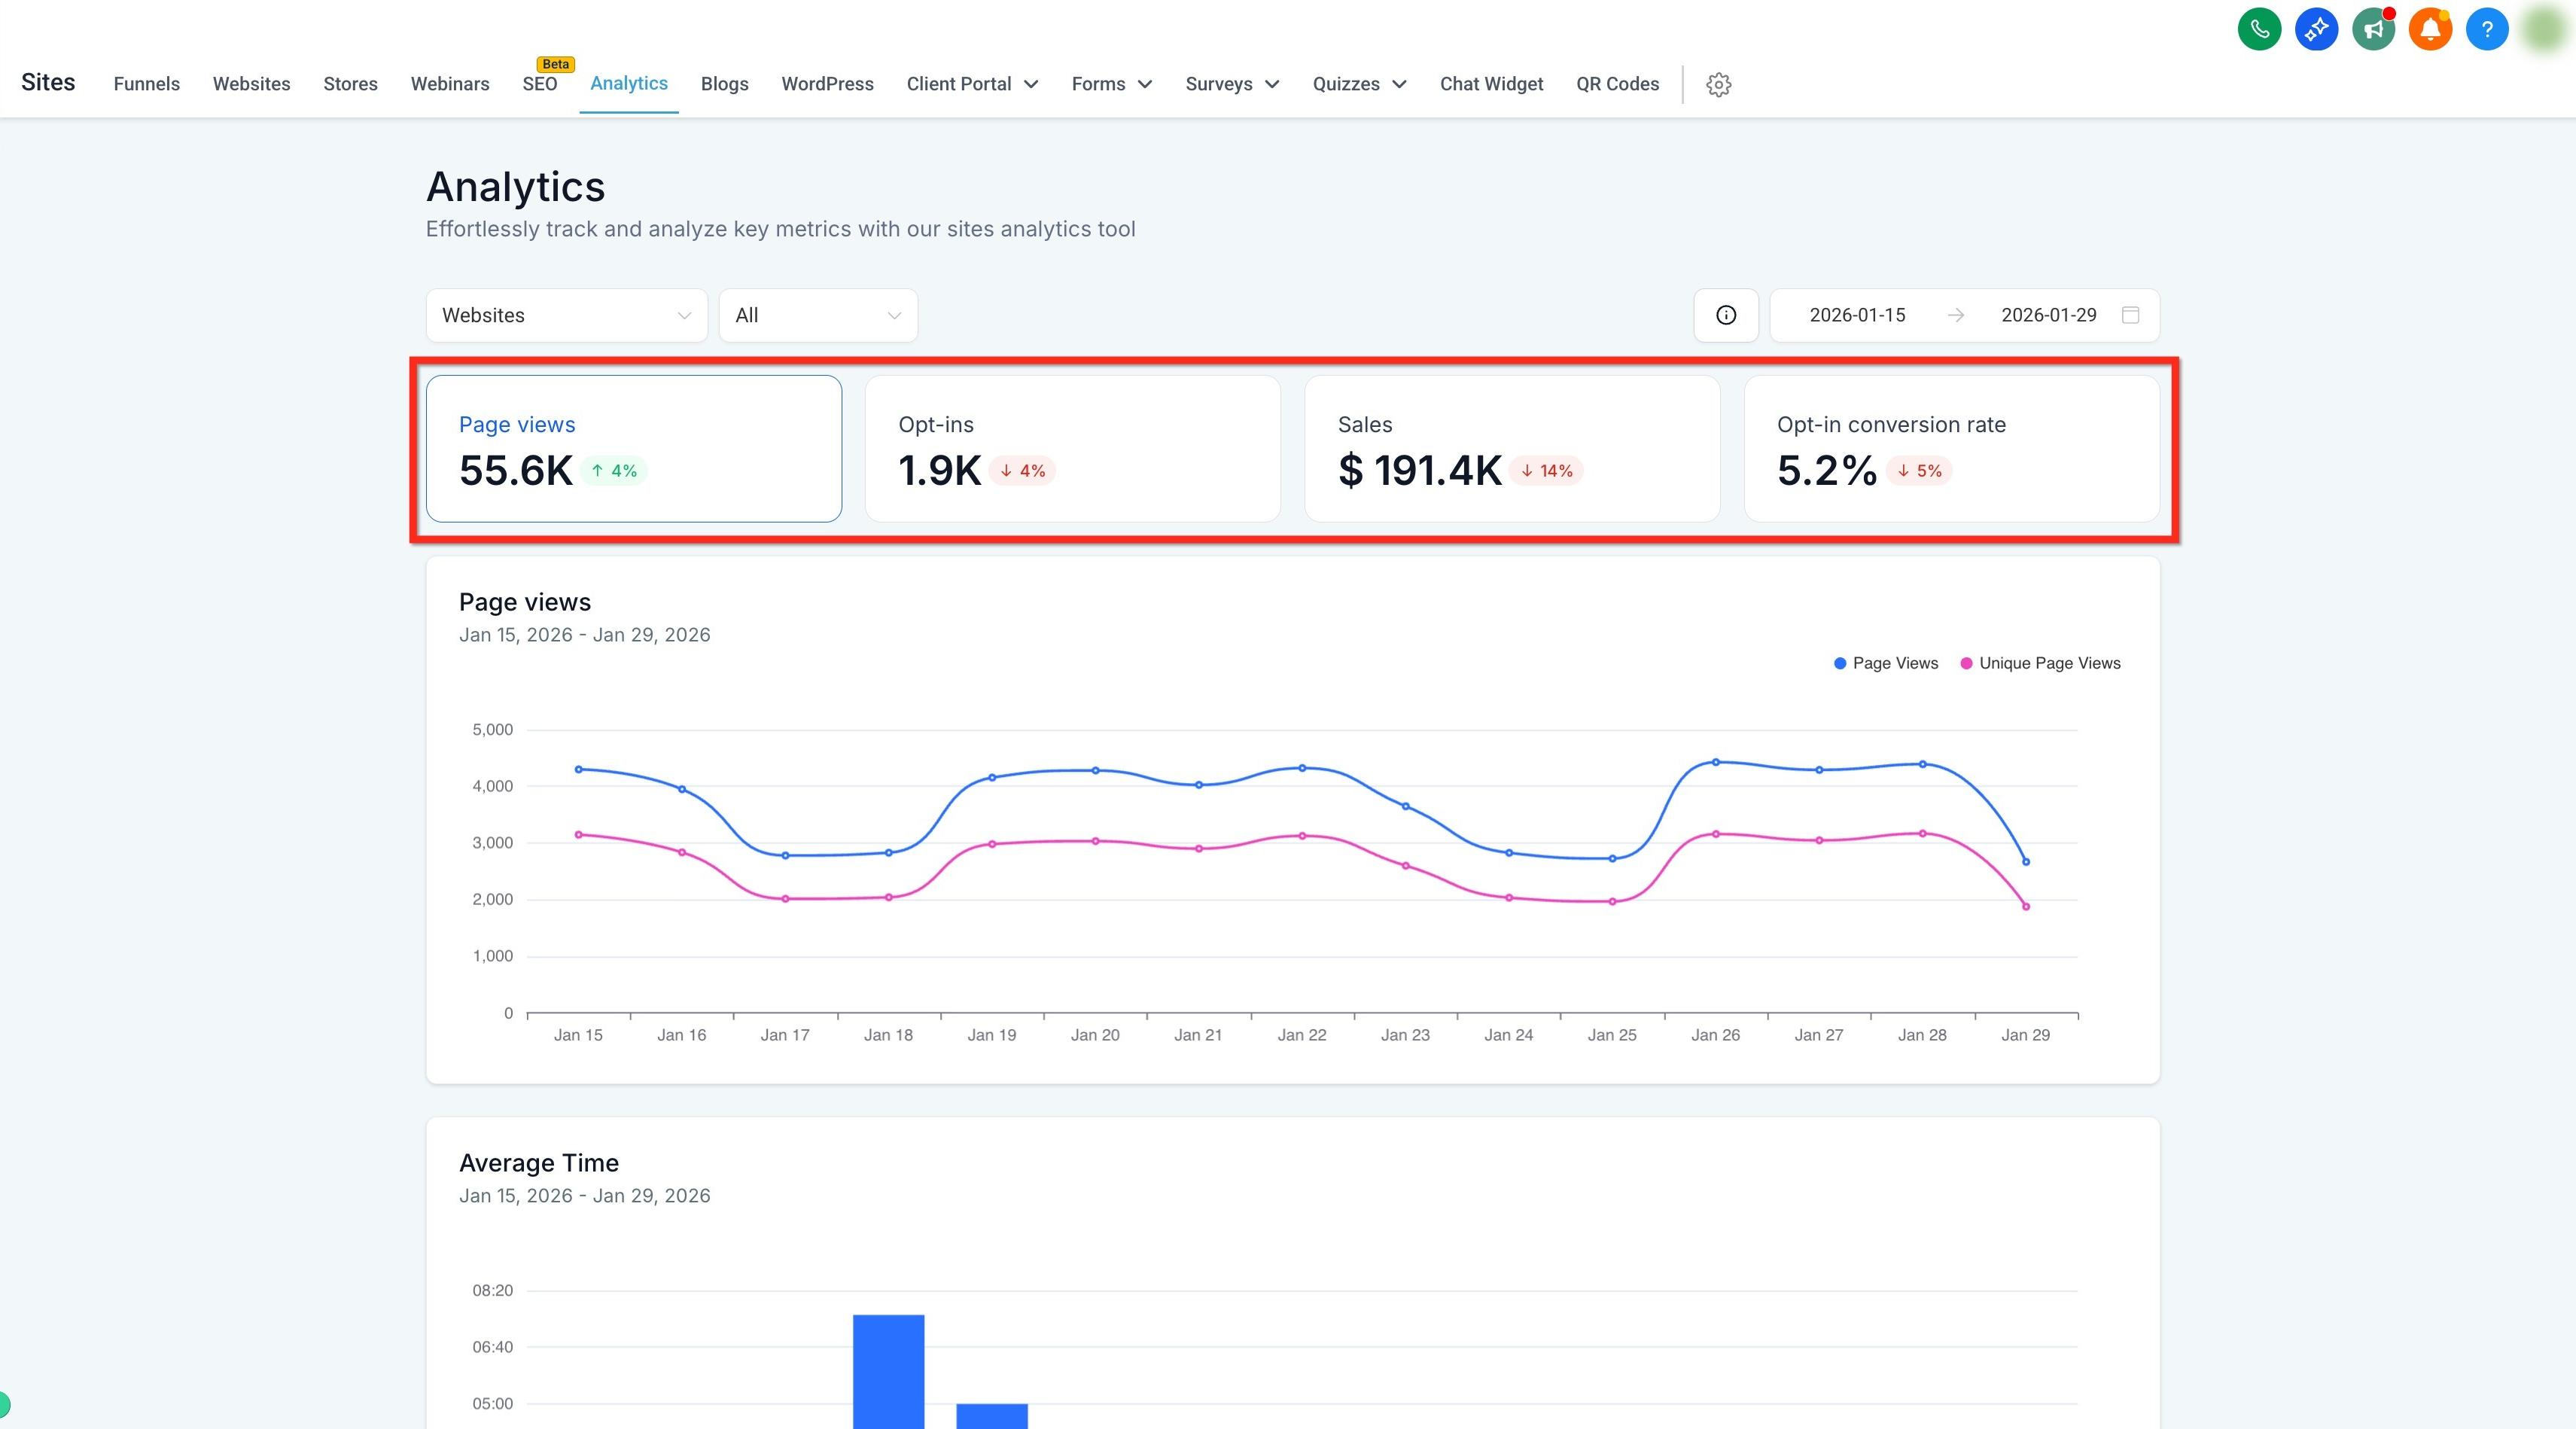
KPI cards act like tabs. Selecting a KPI card updates the charts and breakdowns below so you can explore that metric in depth. Some asset types have fewer (or zero) KPI cards.
Note: The metrics shown in the dashboard change based on the KPI card you select.
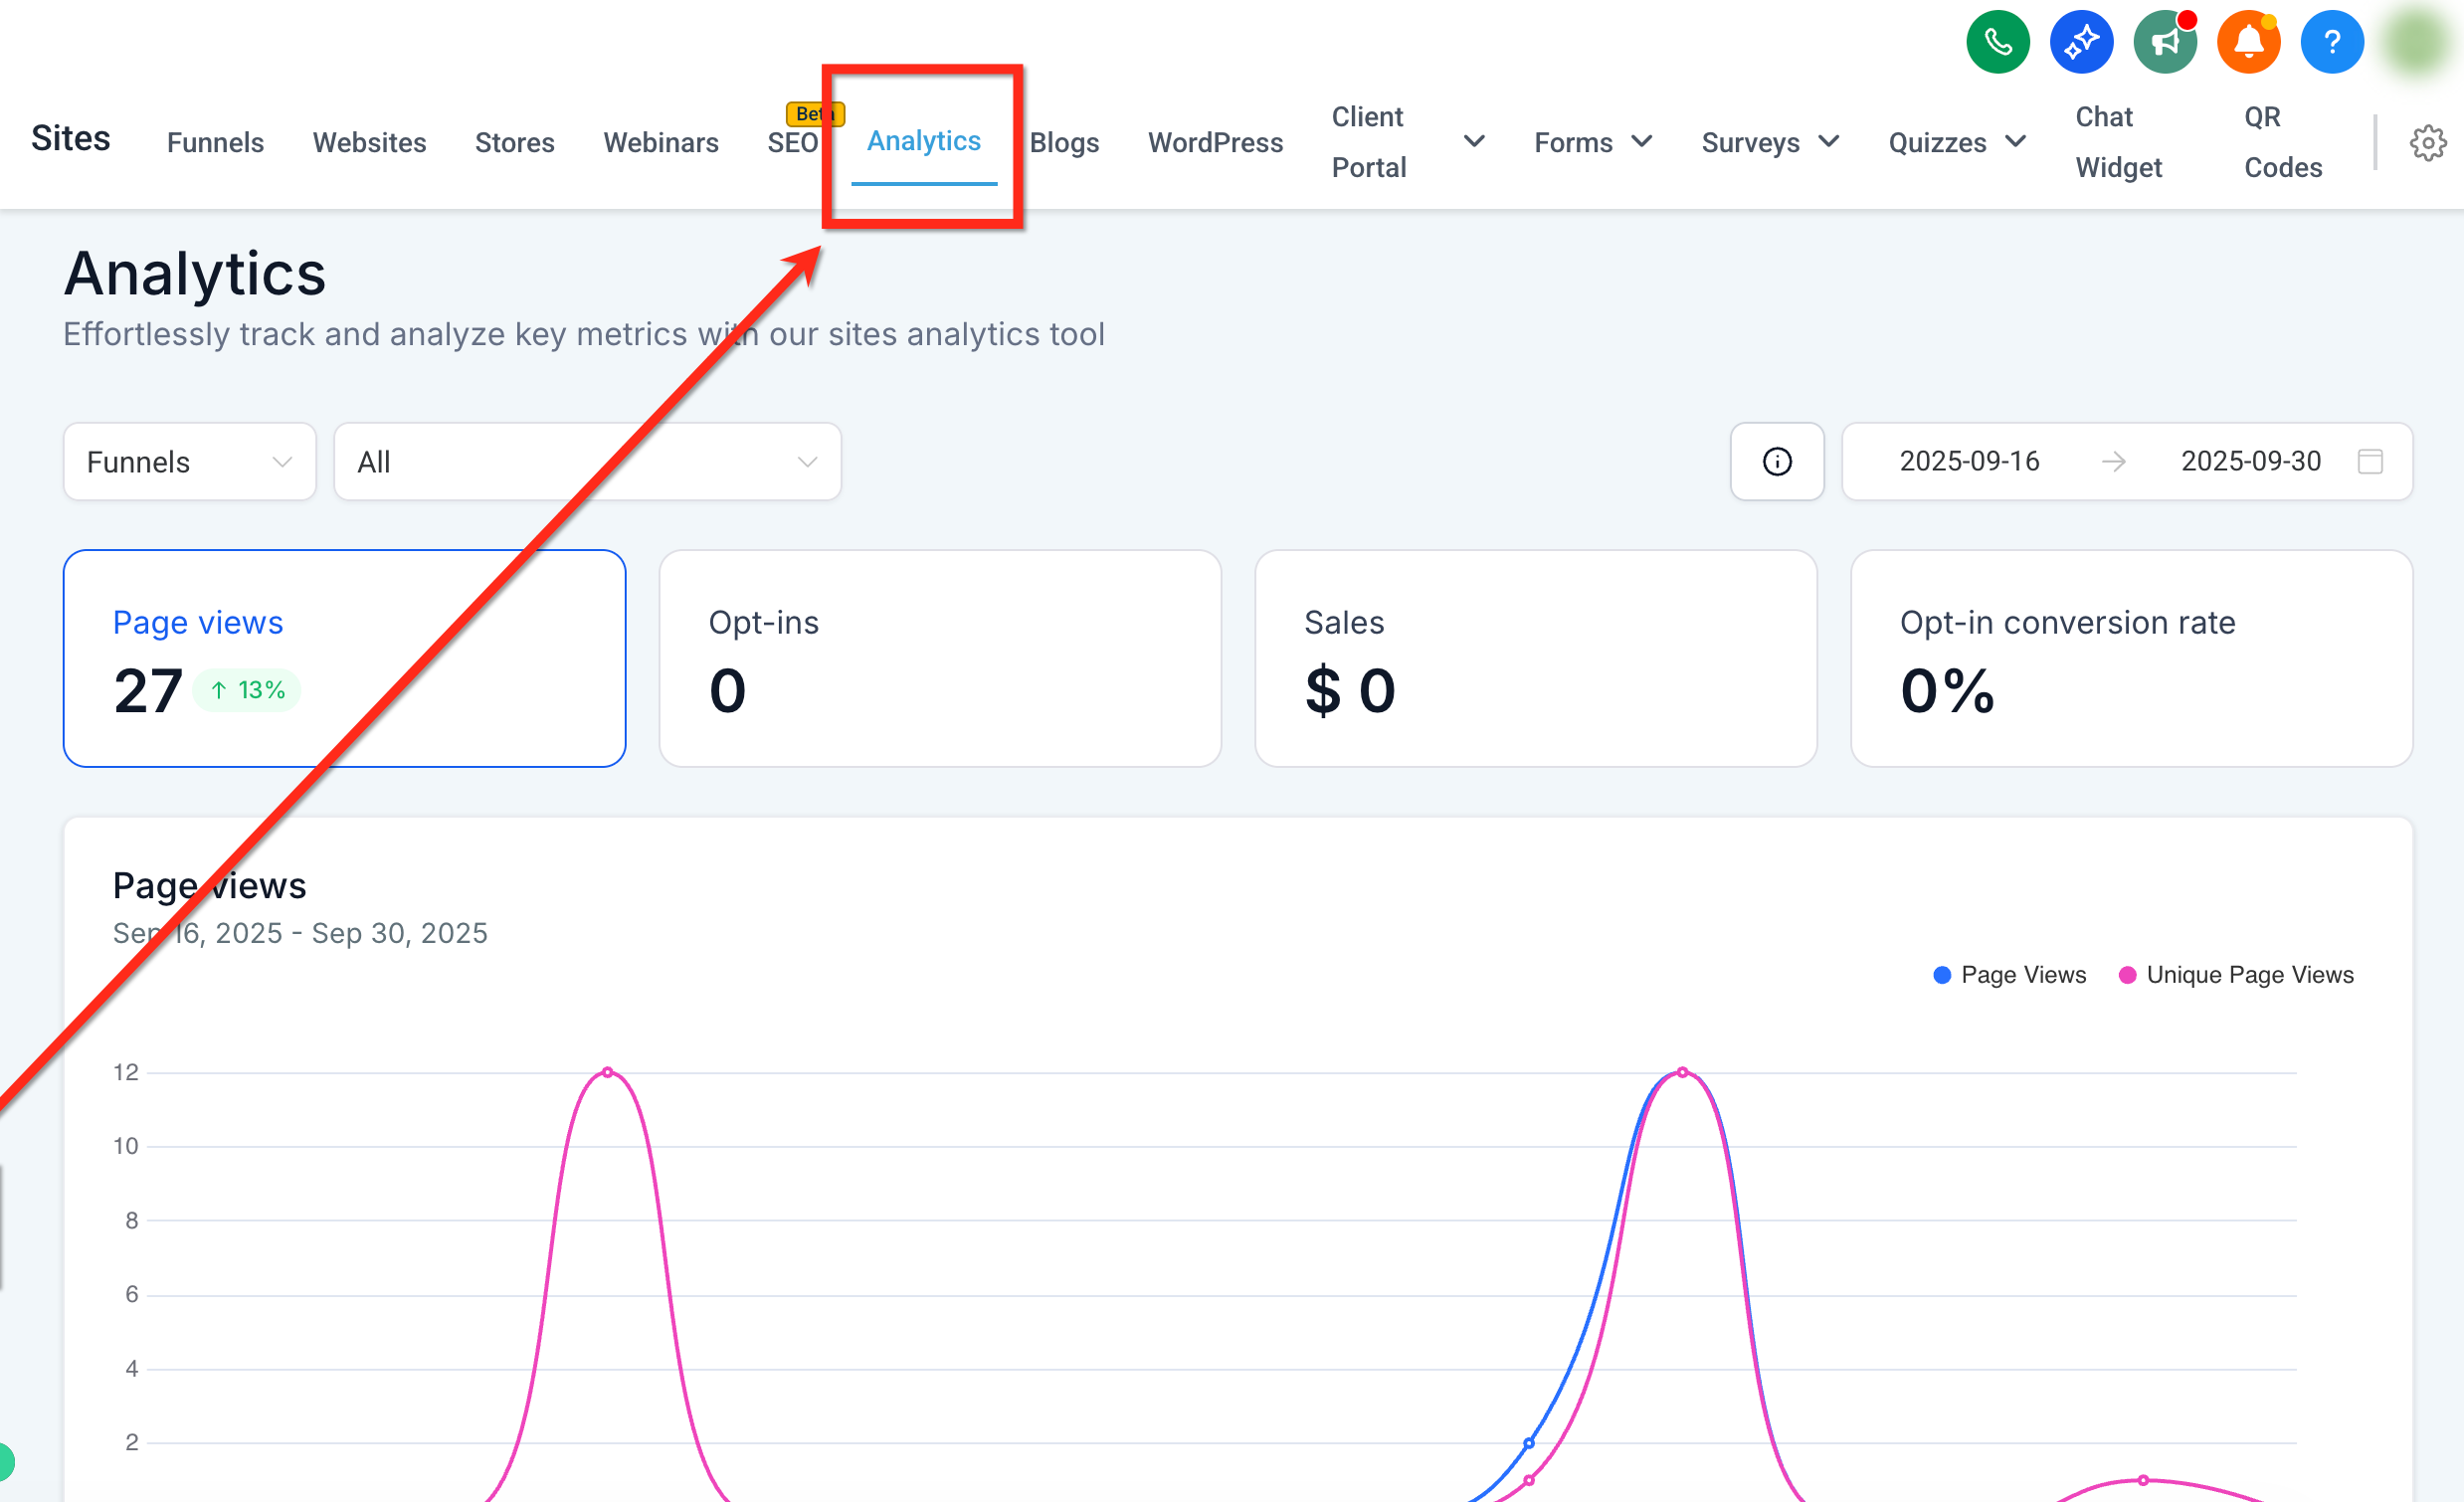
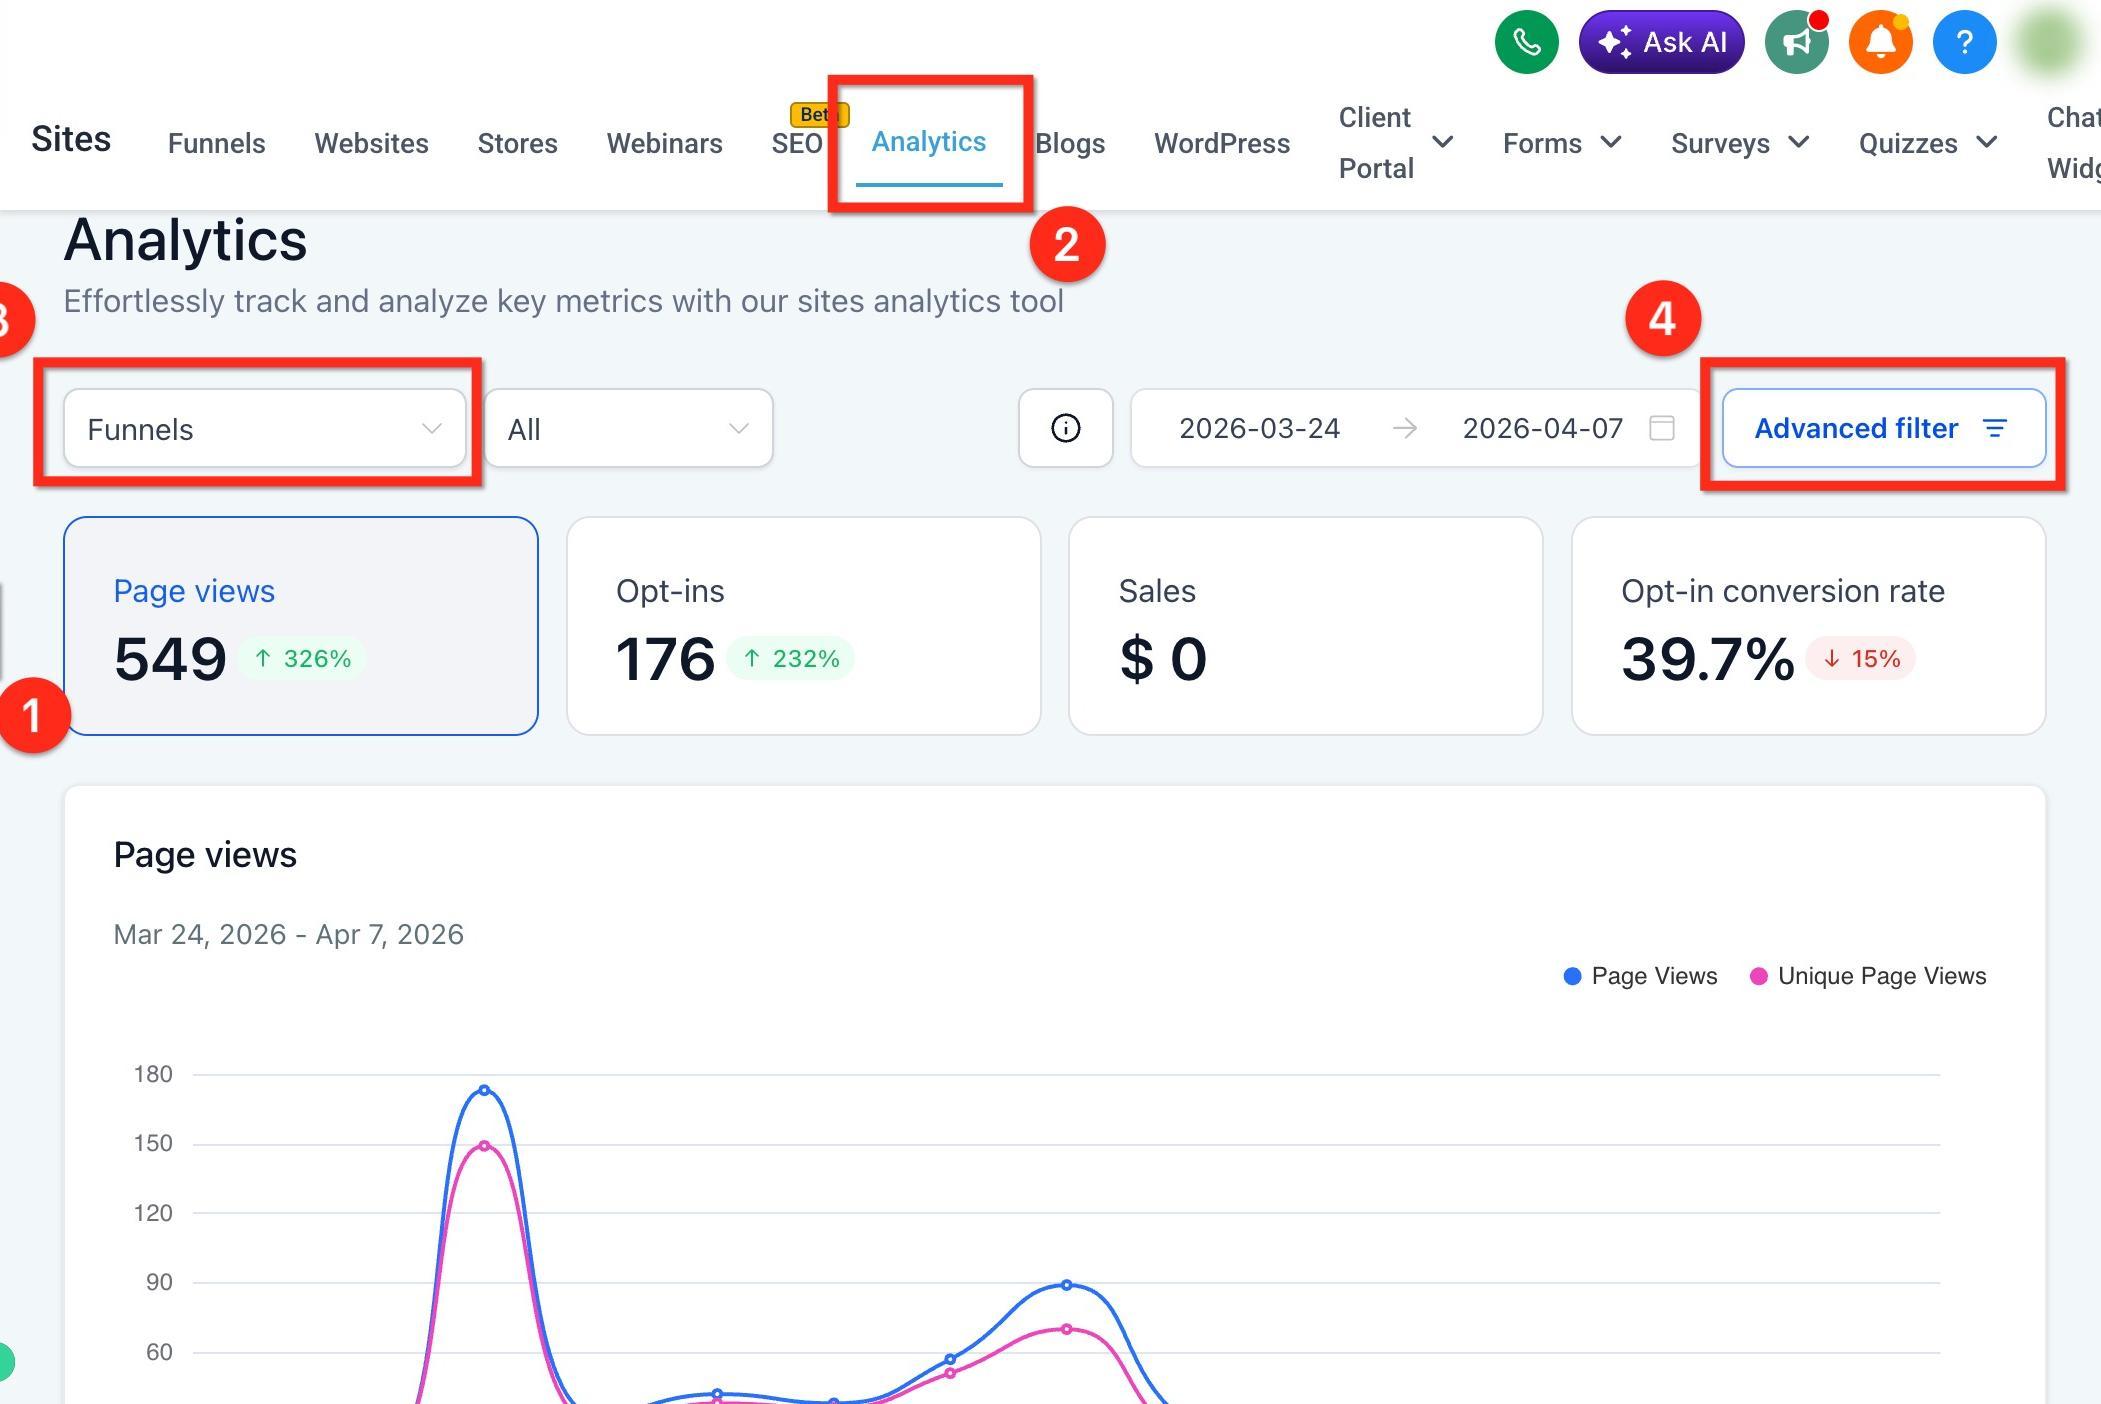
From your dashboard, use the left-side navigation to go to Web Tools → Websites. Then select the Analytics tab from the top navigation ribbon.
Use the dropdowns to select an asset type (for example, Funnels) and optionally choose a specific asset to narrow the focus.
Choose a Date Range that matches your goals.
Click KPI cards to refocus the charts, then scan the trends and breakdowns. Repeat as needed for other asset types, assets, or time frames.
Advanced Filters let you narrow analytics data so you can focus on the traffic segments that matter most. You can refine results by attributes such as city, state or province, country, page title, browser, device type, source, and medium, making it easier to uncover trends, compare audience segments, and make more informed decisions, all without exporting data for deeper analysis.
You build targeted views by selecting filter dimensions and combining them with AND and OR logic. You can also create nested filters to group related conditions together when you need more precise segmentation.
Segment your data more precisely: Narrow analytics by attributes such as geography, traffic source, page title, and browser.
Analyze multiple conditions at once: Combine filters to review highly specific audience groups and traffic patterns.
Use flexible filter logic: Apply AND and OR conditions to build more accurate views.
Create deeper filter groupings: Add nested filters when you need to organize related conditions together.
Reset or adjust easily: Remove individual filters or clear all filters to start over.
Advanced Filters are available for the following asset types:
Funnels
Websites
Webinars
Start from the main Analytics dashboard, choose a supported asset type, and then open the filter builder:
Click Web Tools → Websites in the left navigation menu.
Click Analytics in the top navigation bar.
Select a supported asset type (Funnels, Websites, or Webinars).
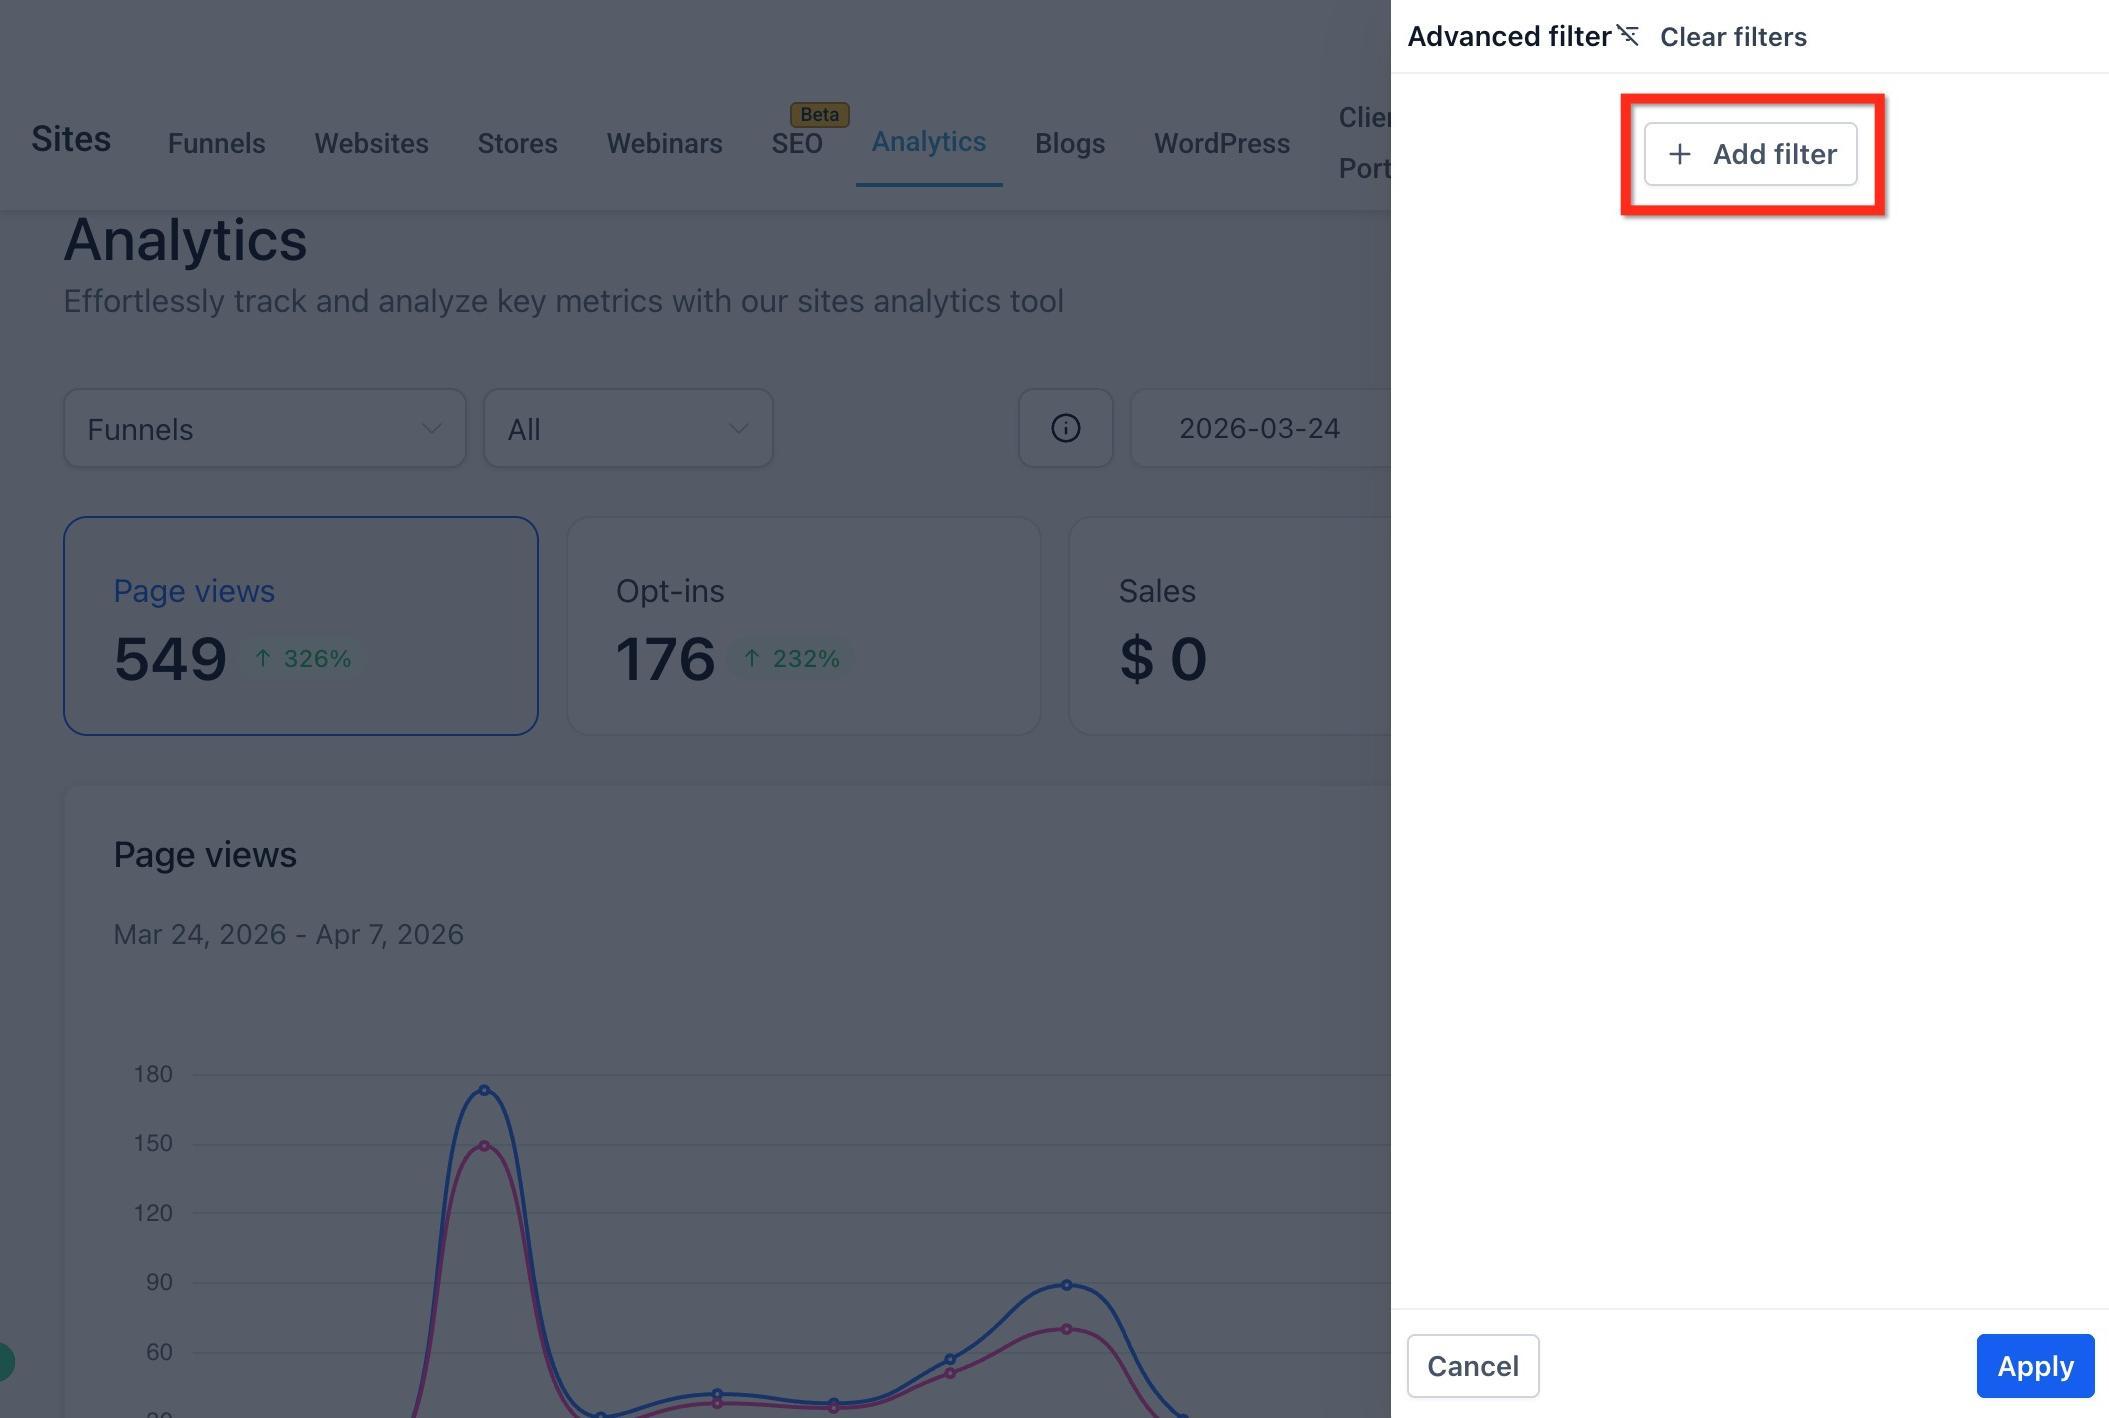
Click Advanced Filter in the top-right corner of the analytics dashboard.
Click + Add Filter.
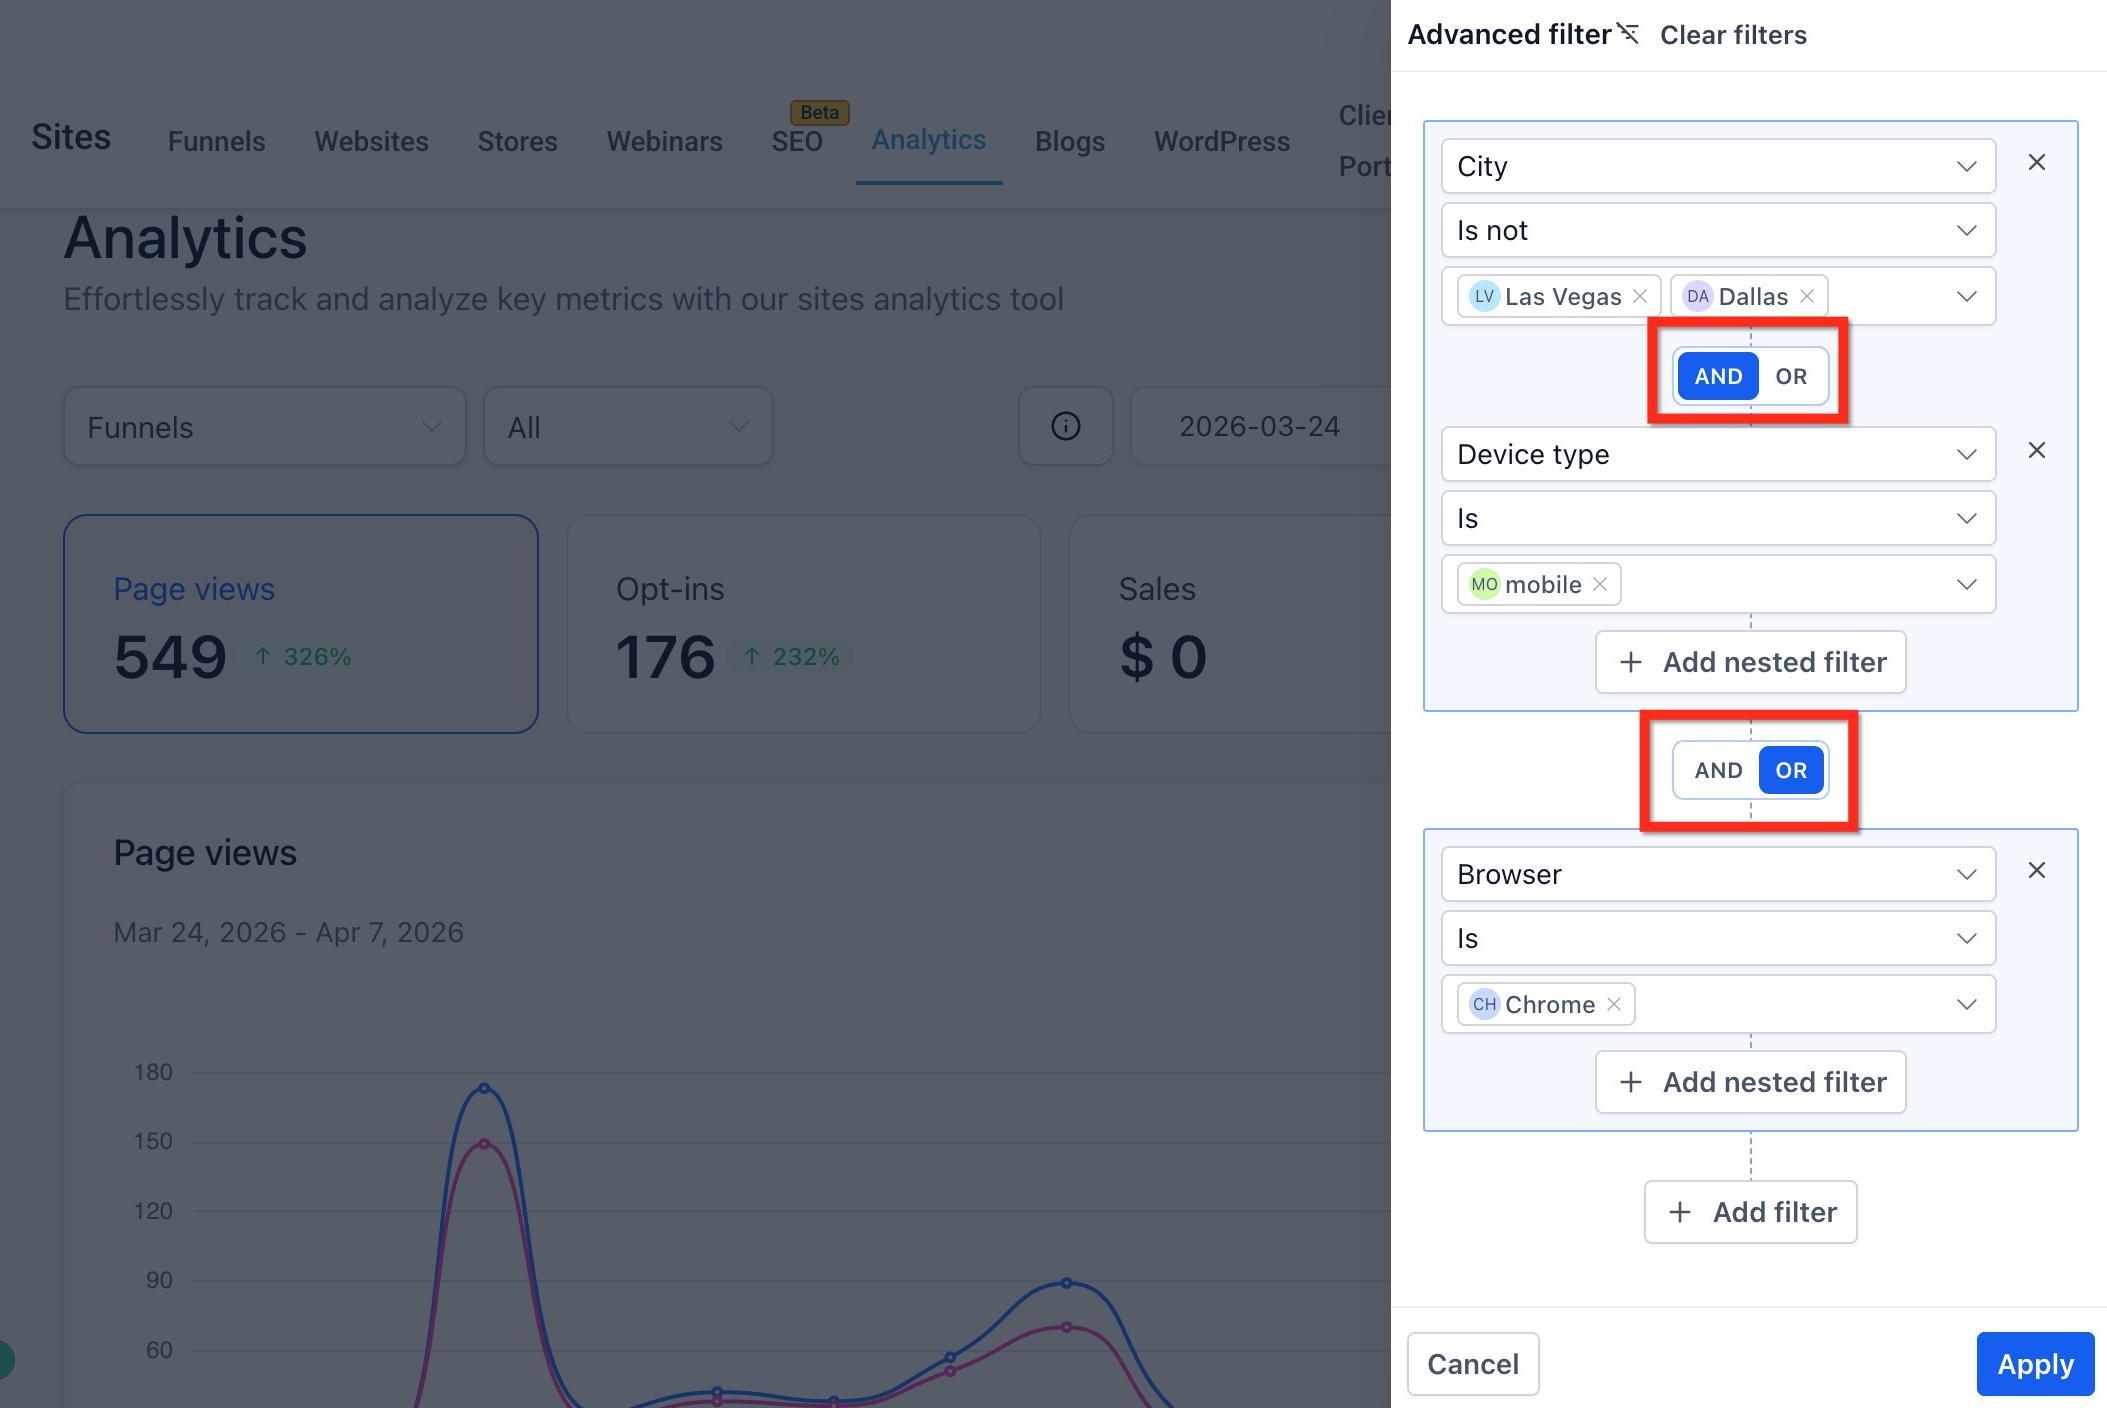
Choose the filter field you want to use, select the condition (Is or Is not), and then choose one or more values to include or exclude.
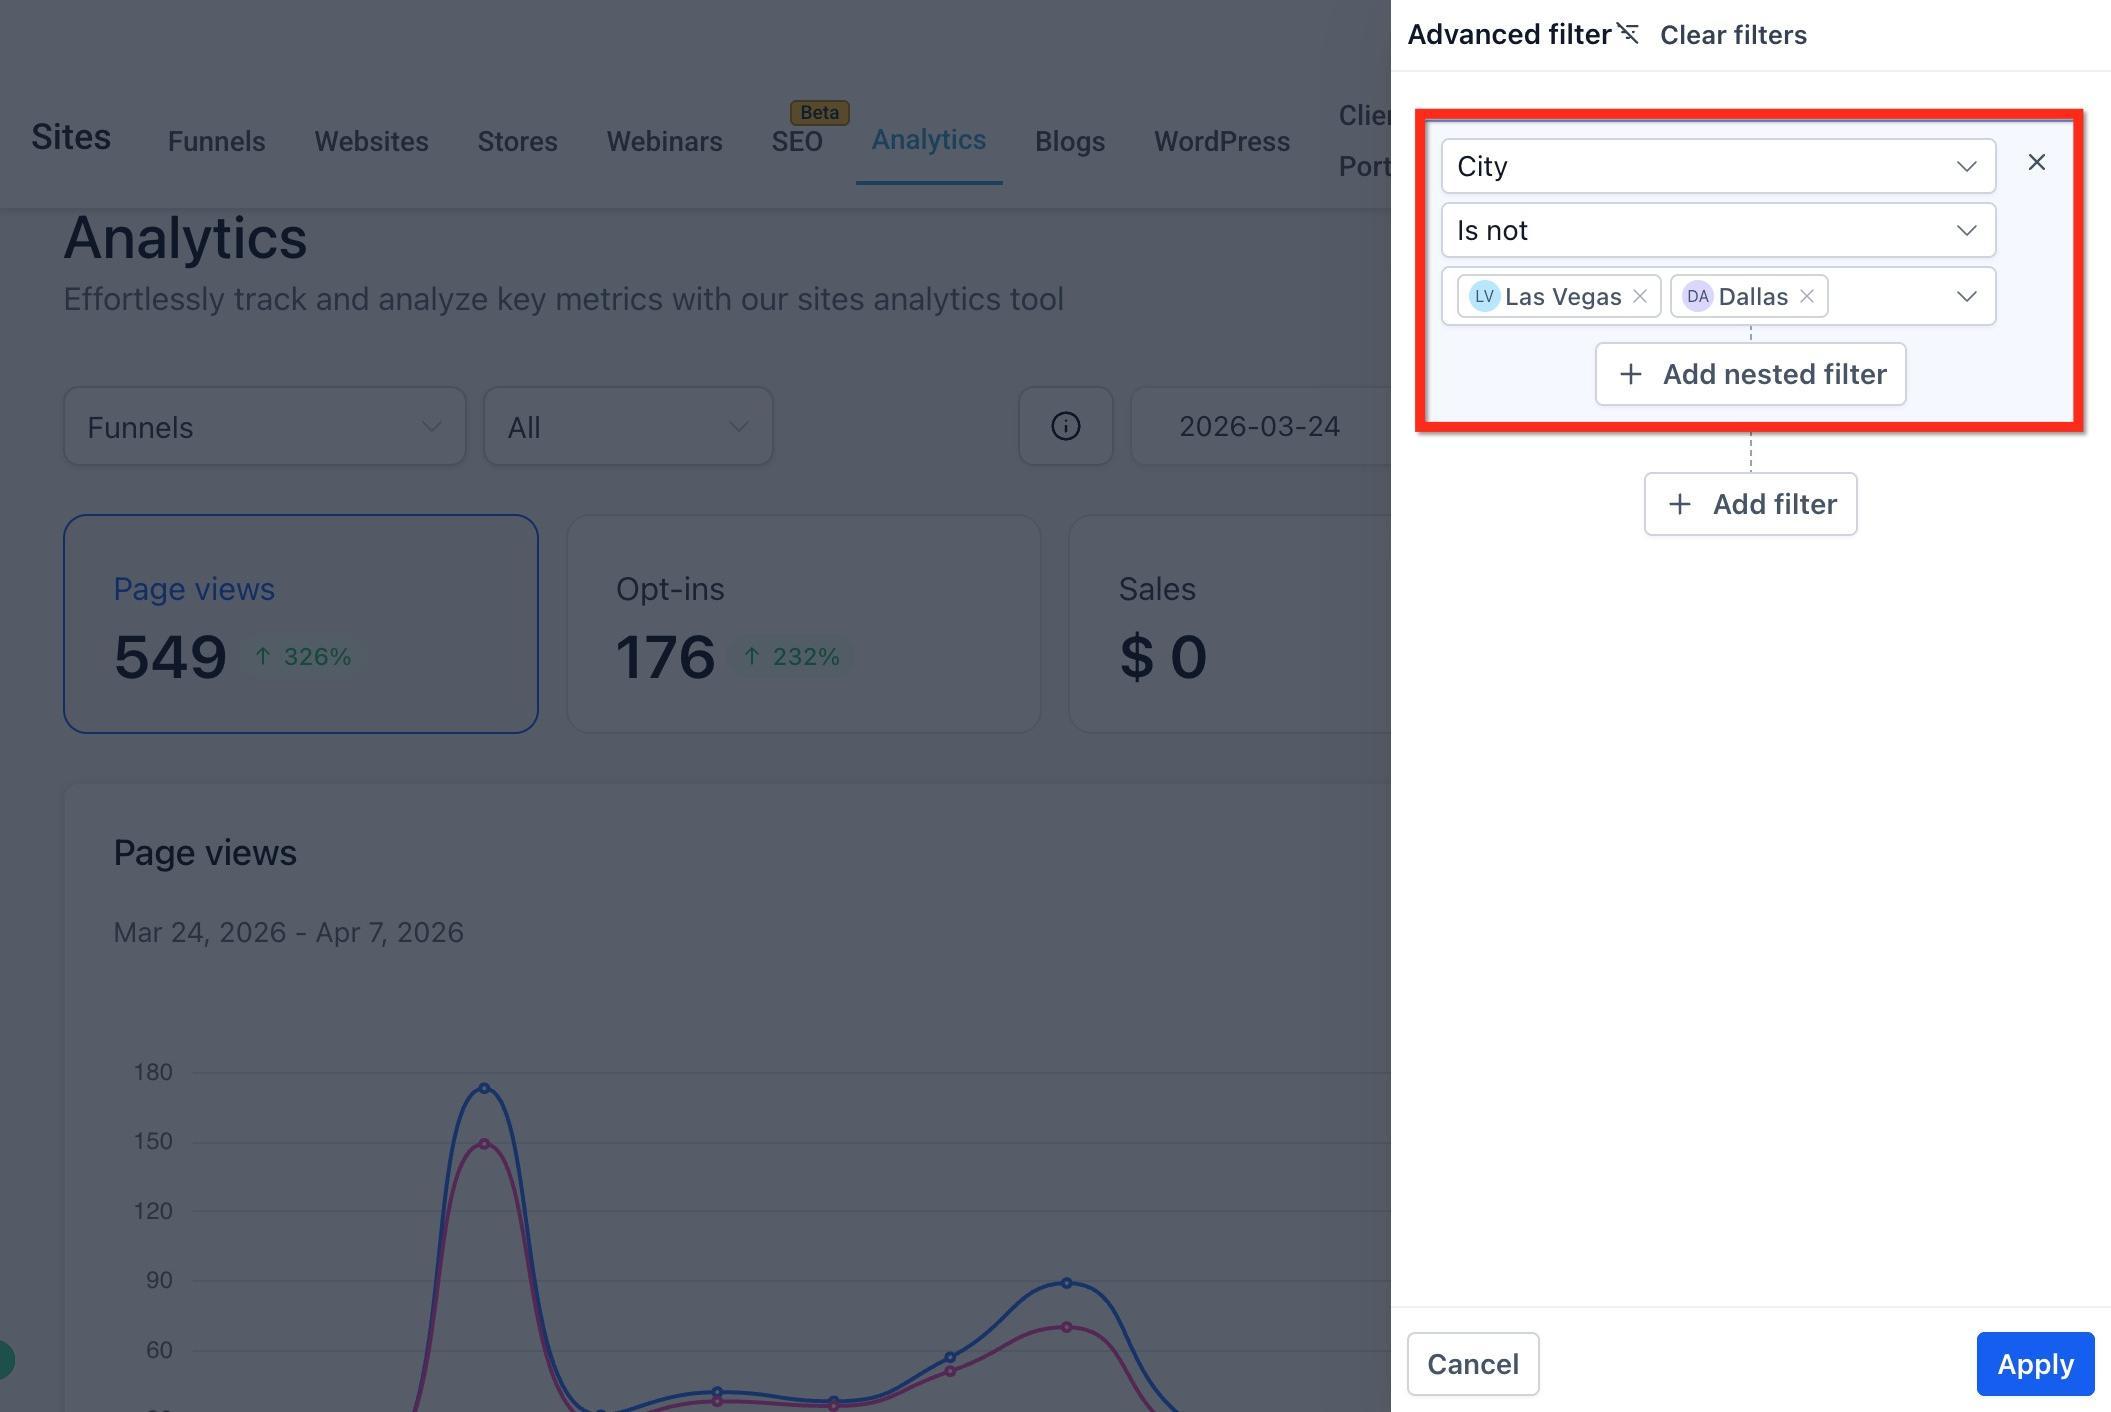
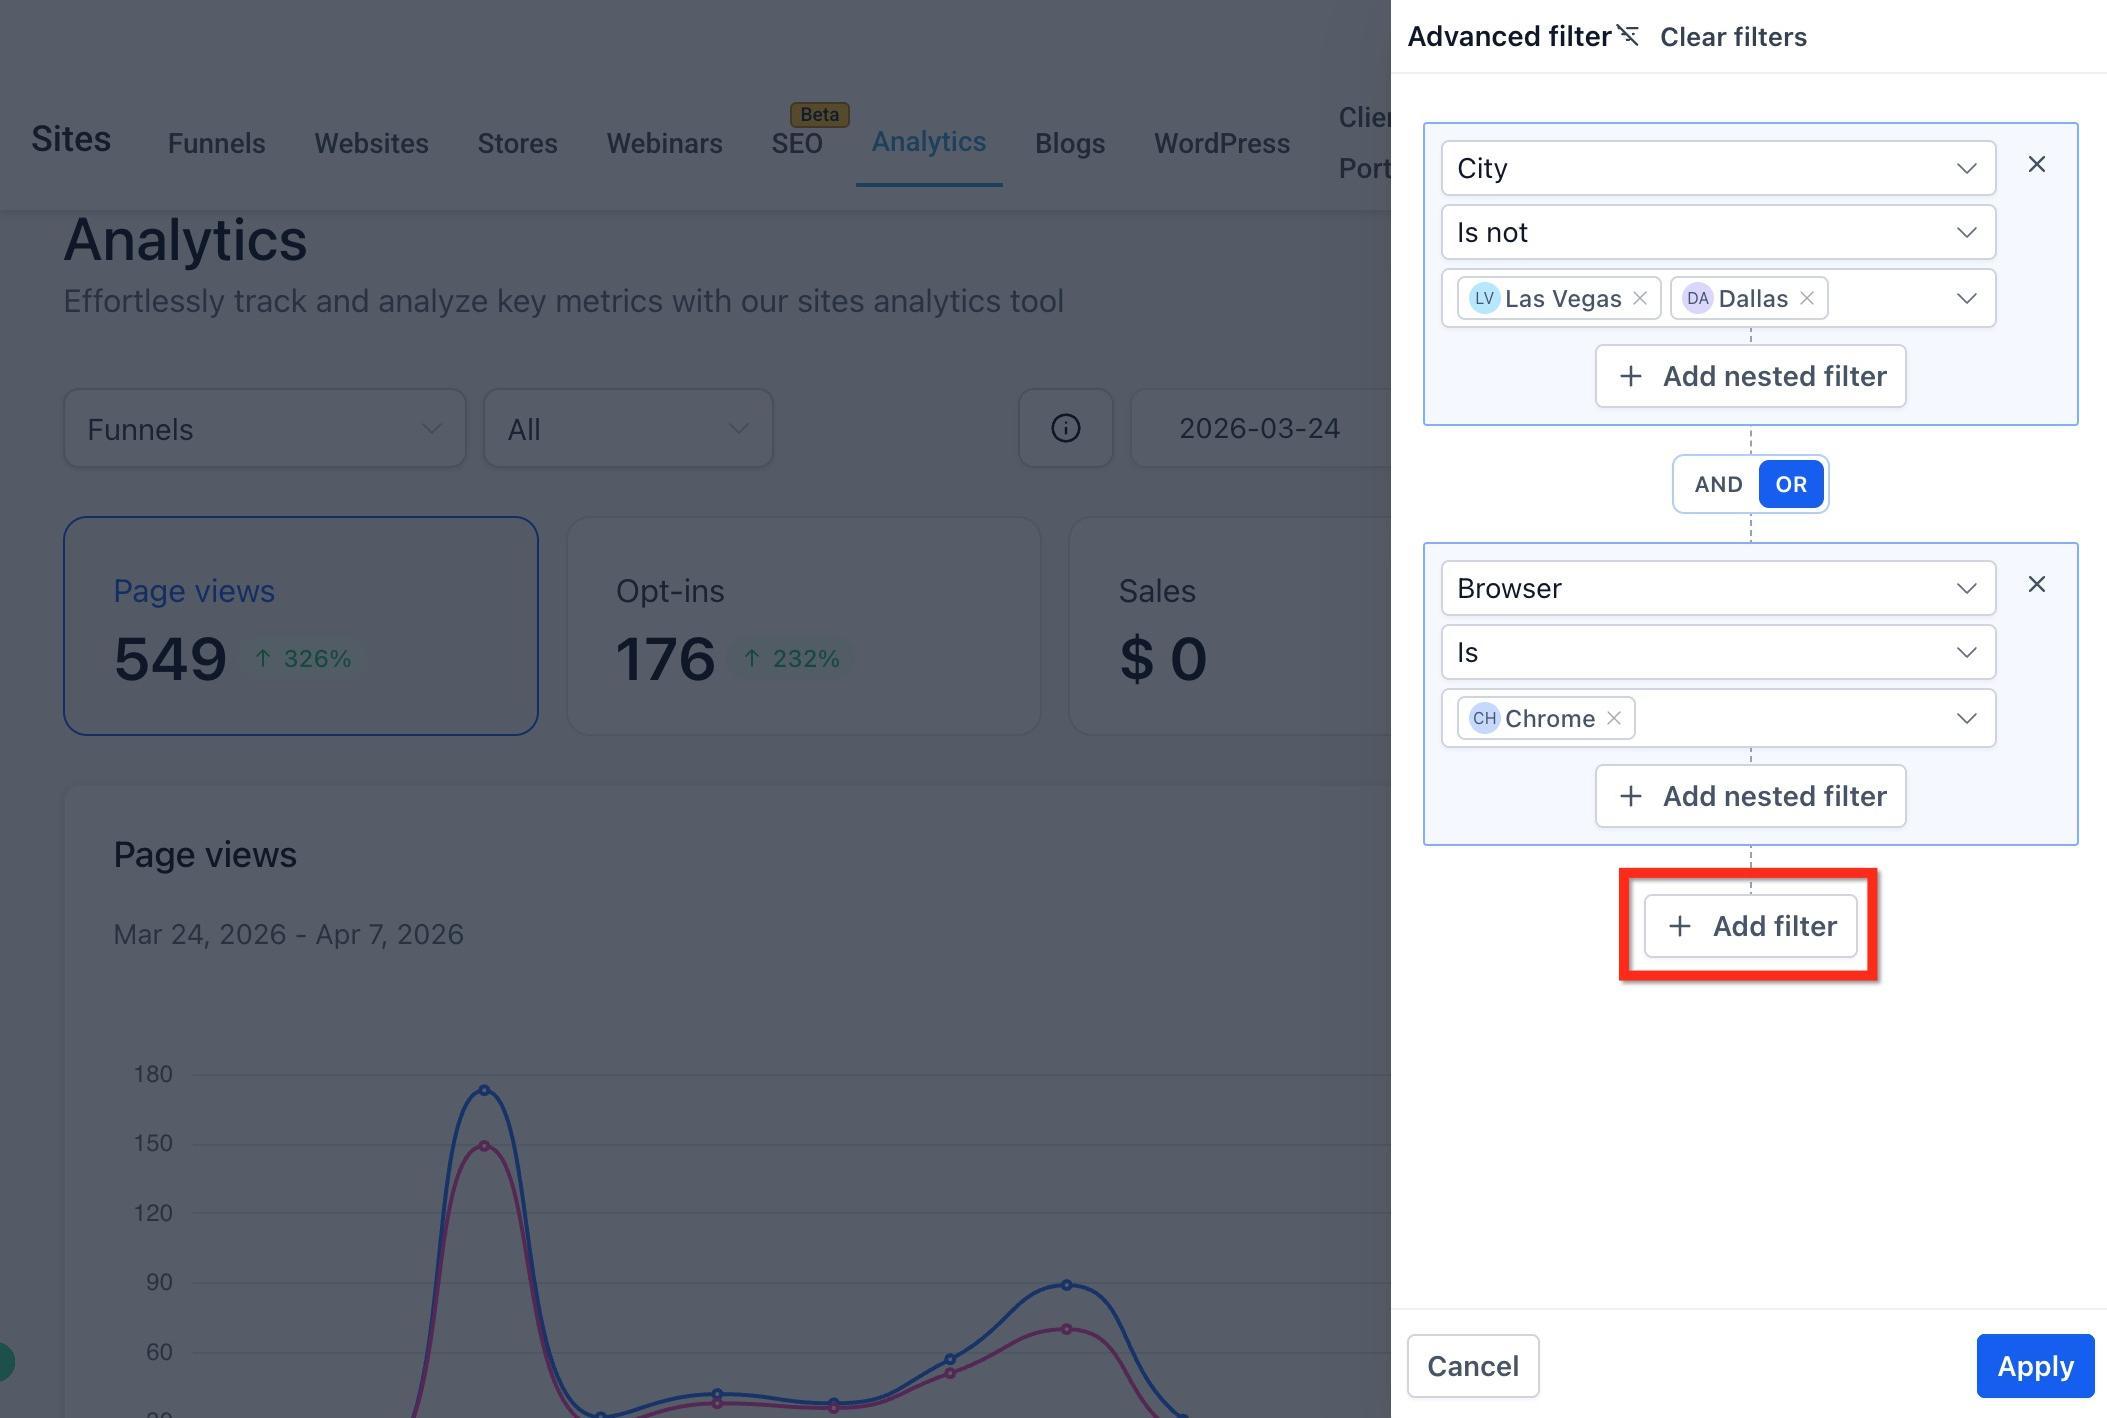
Click Add Filter to add another condition.
Click Add Nested Filter to create a grouped condition set inside your broader filter logic.
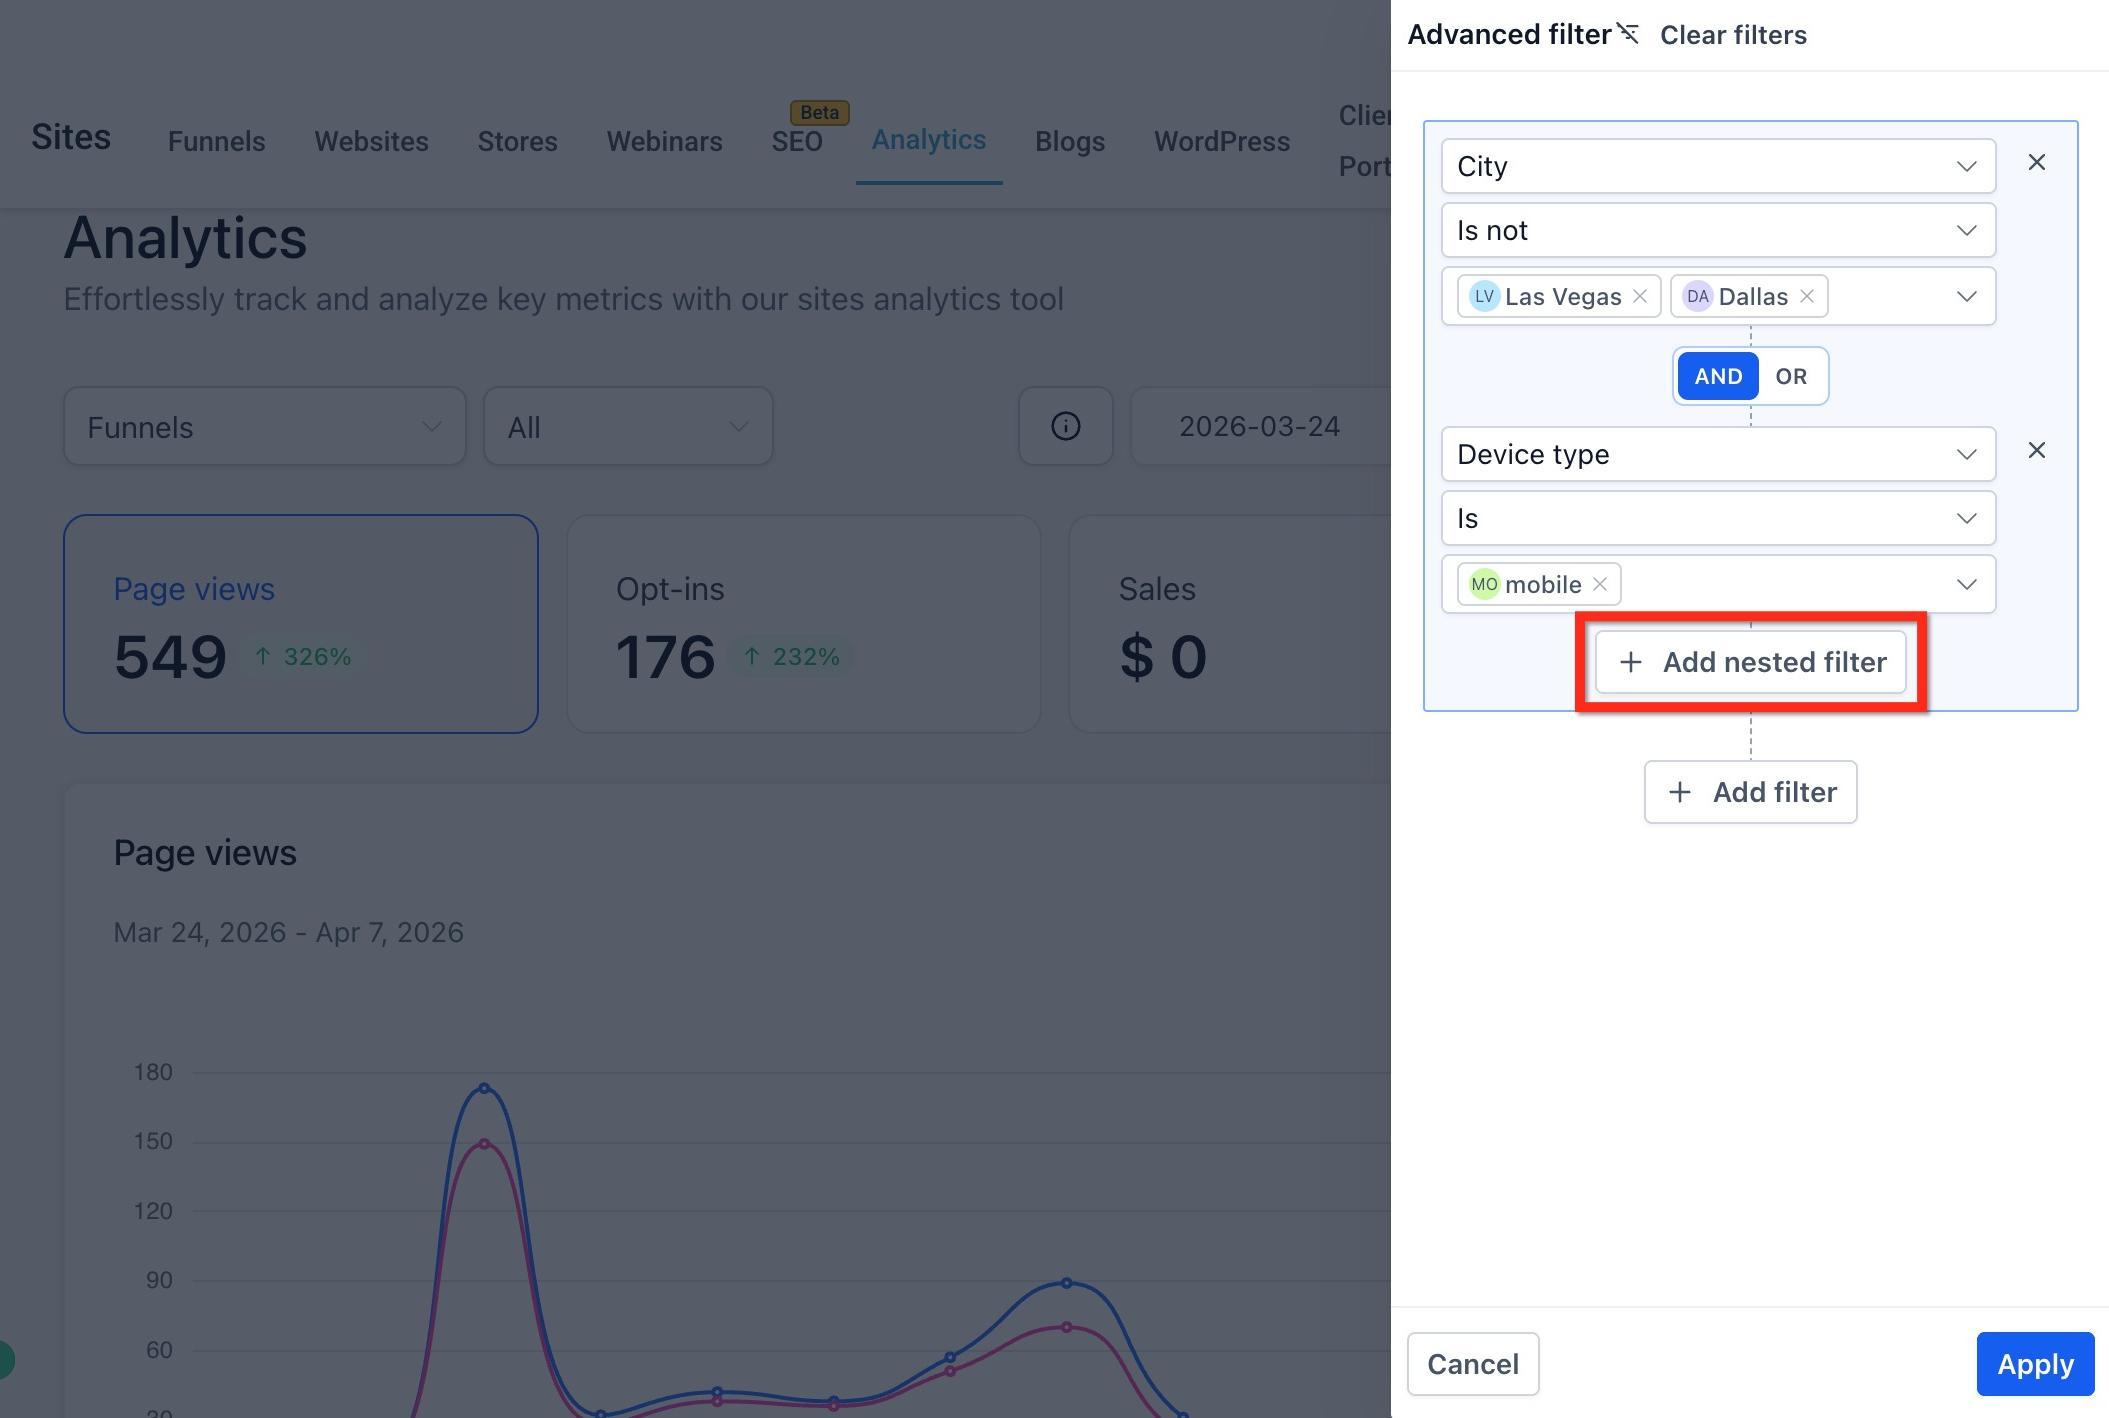
Choose AND or OR to define how your filters work together.
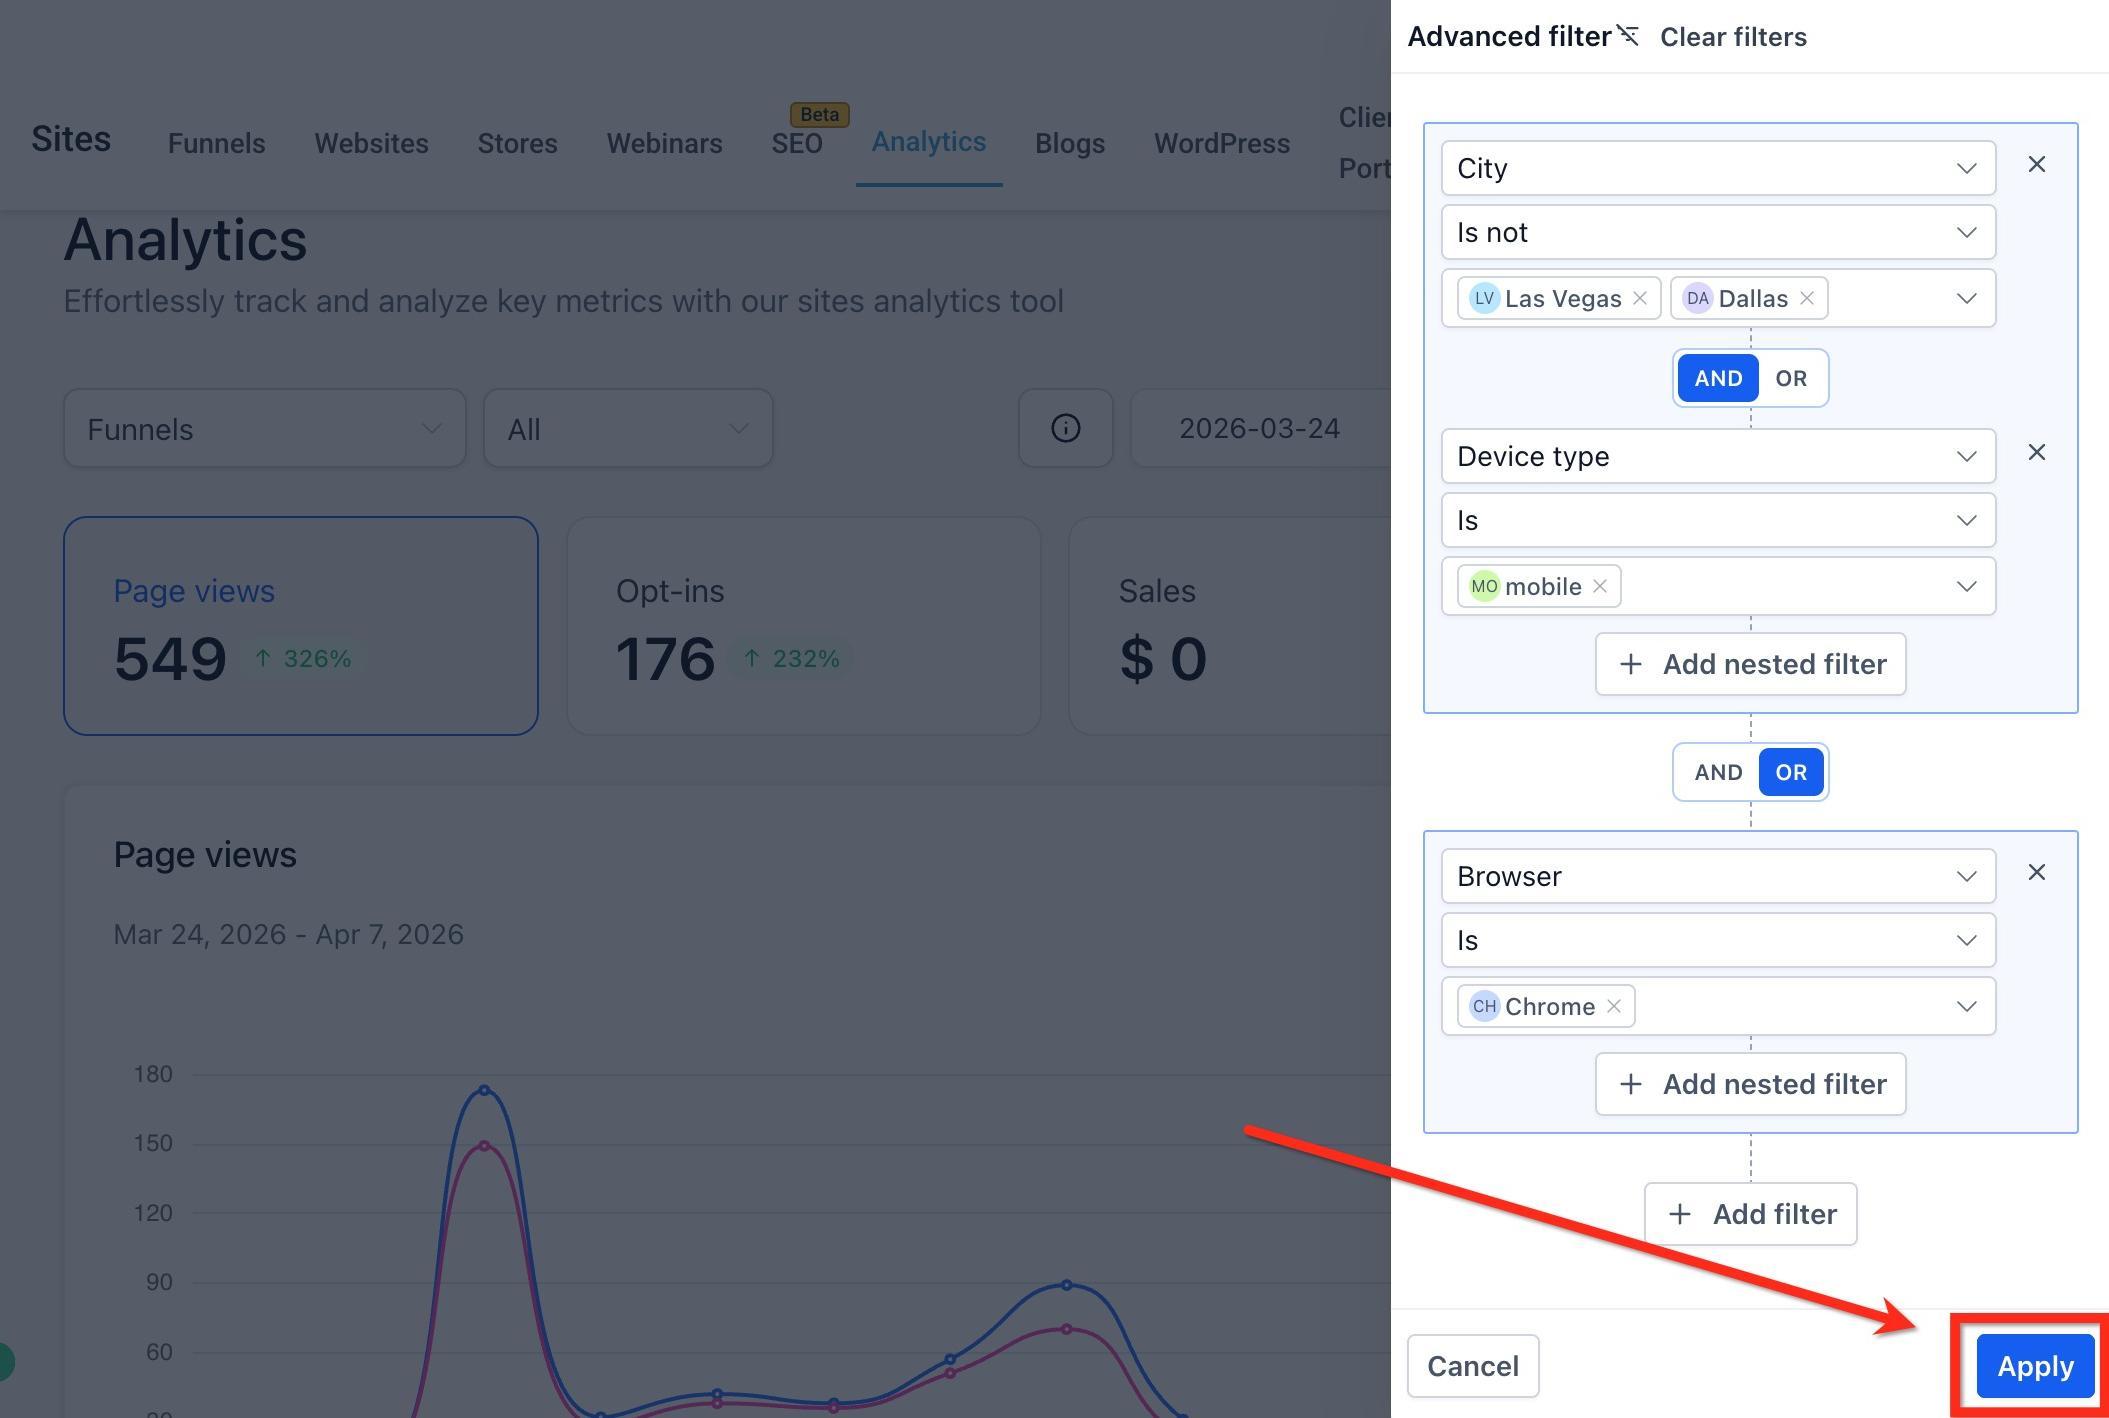
Click Apply to update the analytics dashboard.
Note: Advanced Filters do not persist after a page refresh or when you leave the Analytics page. If you return later, you will need to recreate them.
These definitions explain the meaning of each metric you'll see in Funnel & Website Analytics. Use them to interpret your performance and improve your marketing.
How many times your funnel pages are visited.
Type | Description |
|---|---|
All | All page views, including repeat visits. |
Unique | Unique visitors that visited the page. |
Example: 1 person visits twice → All = 2, Unique = 1.
Tracks users who express interest in your offer.
Type | Description |
|---|---|
All | Number of users who opted in for the product, bought the product, submitted a form or survey, or booked an appointment through a calendar. |
Rate | "All Opt-ins" divided by Unique Page Views. |
Example: 50 opt-ins from 200 unique views → Rate = 25%.
Counts purchases in your funnel.
Level | Description |
|---|---|
Funnel Step Level | Number of sale orders placed (does not consider the number of products or quantities purchased). |
Individual Product Level | Number of times the particular product has been purchased. |
Bump Product | Number of times the bump product is purchased. |
Example: 30 orders placed in a step, 18 of those included product A and 5 included the bump product → Funnel Step Level = 30, Individual Product Level = 18, and Bump Product = 5.
Shows conversion from views to purchases.
Level | Description |
|---|---|
Funnel Step Level | Number of times ANY product is purchased divided by Unique Page Views. |
Individual Product Level | Number of times the particular product is purchased divided by Unique Page Views. |
Bump Product | Number of times the bump product is purchased divided by total orders placed for the step. |
Example: 20 bump purchases out of 100 orders → Rate = 20%.
Total items sold.
Level | Description |
|---|---|
Funnel Step Level | Total quantity of all products purchased in this funnel step. |
Product Level | Total quantity of the specific product in that funnel step. |
Example: 10 orders with 3 items each → Quantity = 30.
Total revenue generated.
Level | Description |
|---|---|
Funnel Step Level | Total value of all products purchased in that funnel step. |
Product Level | Total sale value of a specific product in that funnel step. |
Average revenue per order.
Level | Description |
|---|---|
Funnel Step Level | Total Amount divided by Total Orders. |
Product Level | Not applicable. |
Example: $1,000 in sales from 20 orders → Average Cart Value = $50.
Revenue per page view.
Type | Description |
|---|---|
All | Total Sales Value divided by All Page Views (not unique page views). |
Uniques | Total Sales Value divided by Unique Page Views. |
Example: $5,000 in sales with 5,000 page views → $1 per view.
What to aim for:
Growing unique visitors and opt-ins.
Healthy and stable conversion rates.
Strong average cart value and high revenue per view.
Warning signs to watch:
Declining or consistently low unique traffic.
Low opt-in or sales conversion rates.
Small average order values or poor upsell performance.
Why don't I see KPI toggles for QR Codes?
QR Codes provide a simplified view (total scans and scans by code). KPI card toggles are not available for this asset type.
How is the previous-period percentage calculated?
The dashboard compares your selected range to the immediately prior period of equal length (for example, the last 14 days versus the 14 days before that).
What affects data availability for External Tracking?
The External Tracking script must be installed and functioning on the external site. If it is missing or blocked, views and submissions won't appear.
Can I see page views for a specific step of a funnel?
Yes. Click an item in the Page Views chart to view step-level performance and engagement metrics.
Do basic filters still apply when Advanced Filters are active?
Yes. Basic filters such as the selected asset or timeframe still shape the dataset you're viewing. Advanced Filters further narrow those results.
What's the difference between Add Filter and Add Nested Filter?
Add Filter adds another condition at the current level of your setup. Add Nested Filter adds conditions inside a grouped filter, so you can control how those conditions work together before combining them with the rest of your logic.