Opportunity Forecasting helps your team move beyond simple pipeline tracking and into more accurate revenue planning. Using the Forecast tab inside Opportunities, you can review expected revenue, monitor deal timing, spot risks, and improve forecast quality by working from cleaner opportunity data.
This feature gives sales teams and managers a more realistic view of what may close and when. It builds on the existing Opportunities and Pipelines experience in Aesthetix CRM, which already supports deal tracking, stage movement, and revenue visibility.
Opportunity Forecasting is a forecasting workspace inside Opportunities that helps you estimate revenue based on deal value, expected timing, and opportunity probability. It introduces a dedicated Forecast tab where you can:
Review summary metrics
Analyze pipeline timing in a visual forecast view
Drill into the underlying deals
Improve forecast quality by addressing missing or outdated data
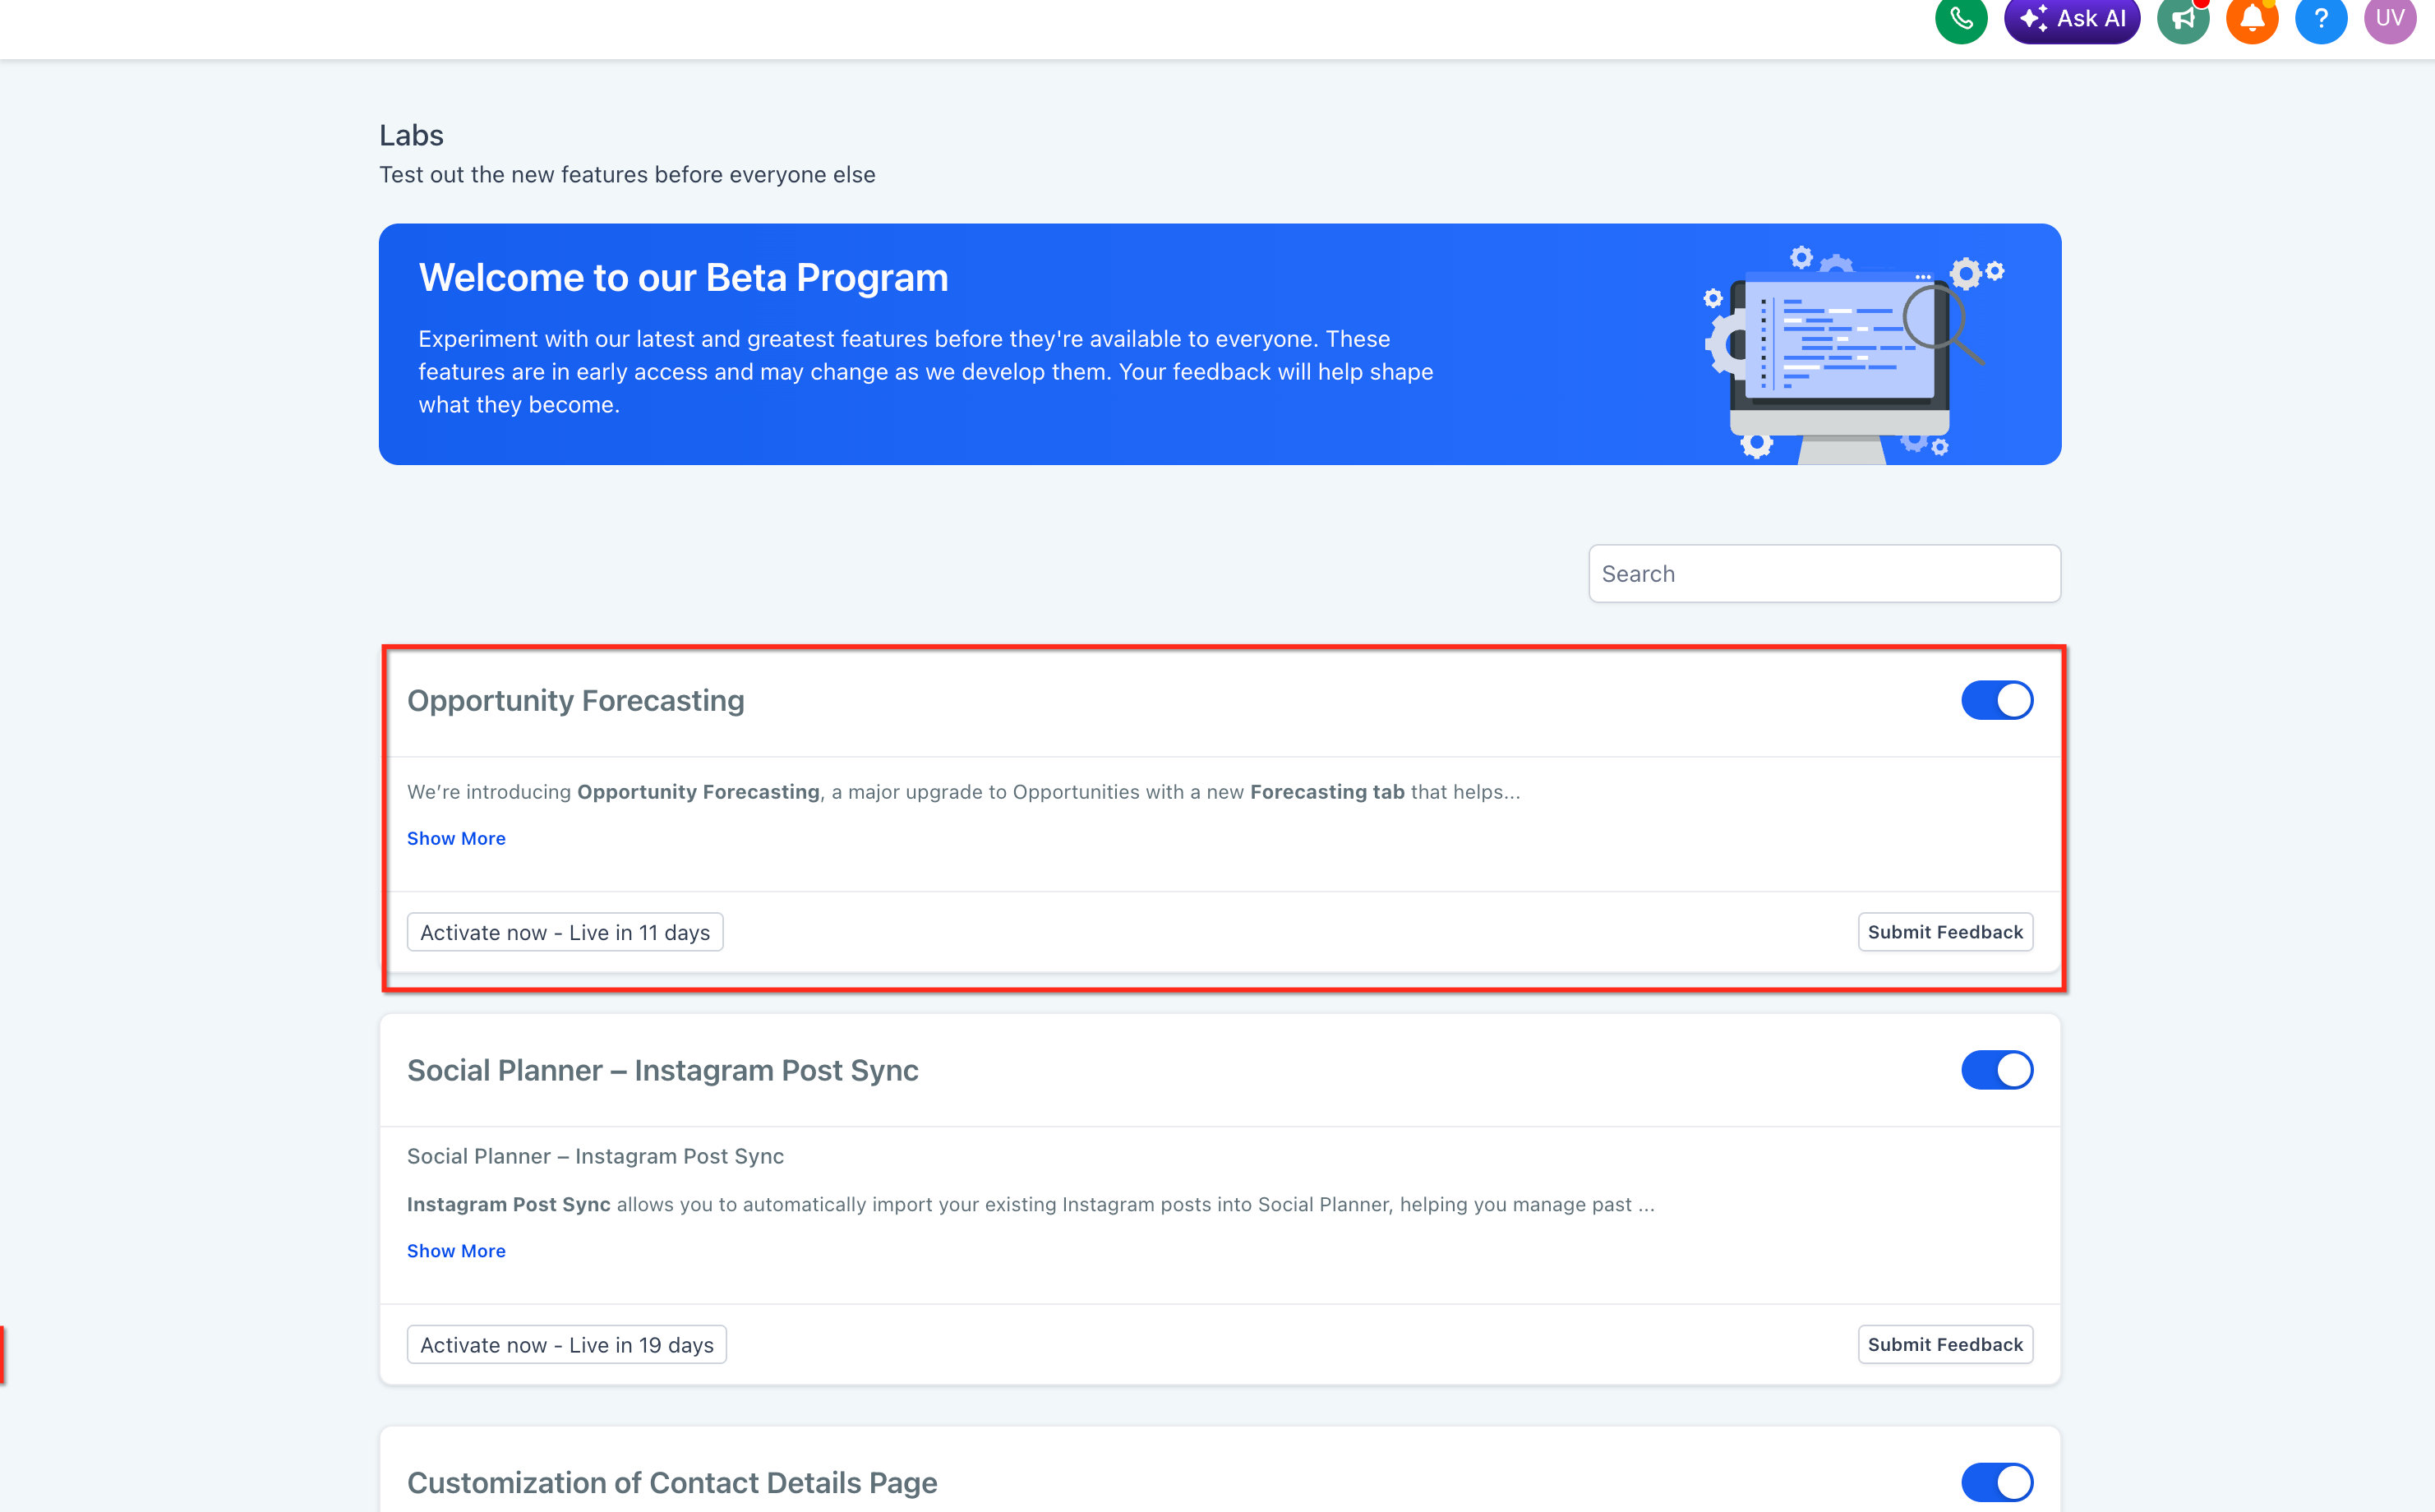
The feature is enabled through Labs, which Aesthetix CRM uses for early-access and evolving functionality.
Key features include:
Forecast tab inside Opportunities
Summary dashboard for revenue visibility
Forecast Timeline for time-based pipeline tracking
Weighted revenue forecasting
Expected Close Date support
Risk classification for deals
Data hygiene insights for forecast accuracy
Time-based views by Week, Month, and Quarter
Advanced filtering and grouping options
Drilldowns to inspect and update opportunities
Opportunity Forecasting helps you understand pipeline health in a more practical way by combining revenue estimates, timing, and deal-quality signals. This makes it easier to plan follow-up actions, improve forecast confidence, and reduce manual spreadsheet work.
Better Revenue Visibility: Review maximum potential revenue, expected revenue, and won revenue from one forecasting workspace.
More Realistic Forecasting: Use weighted opportunity values instead of relying only on total pipeline value.
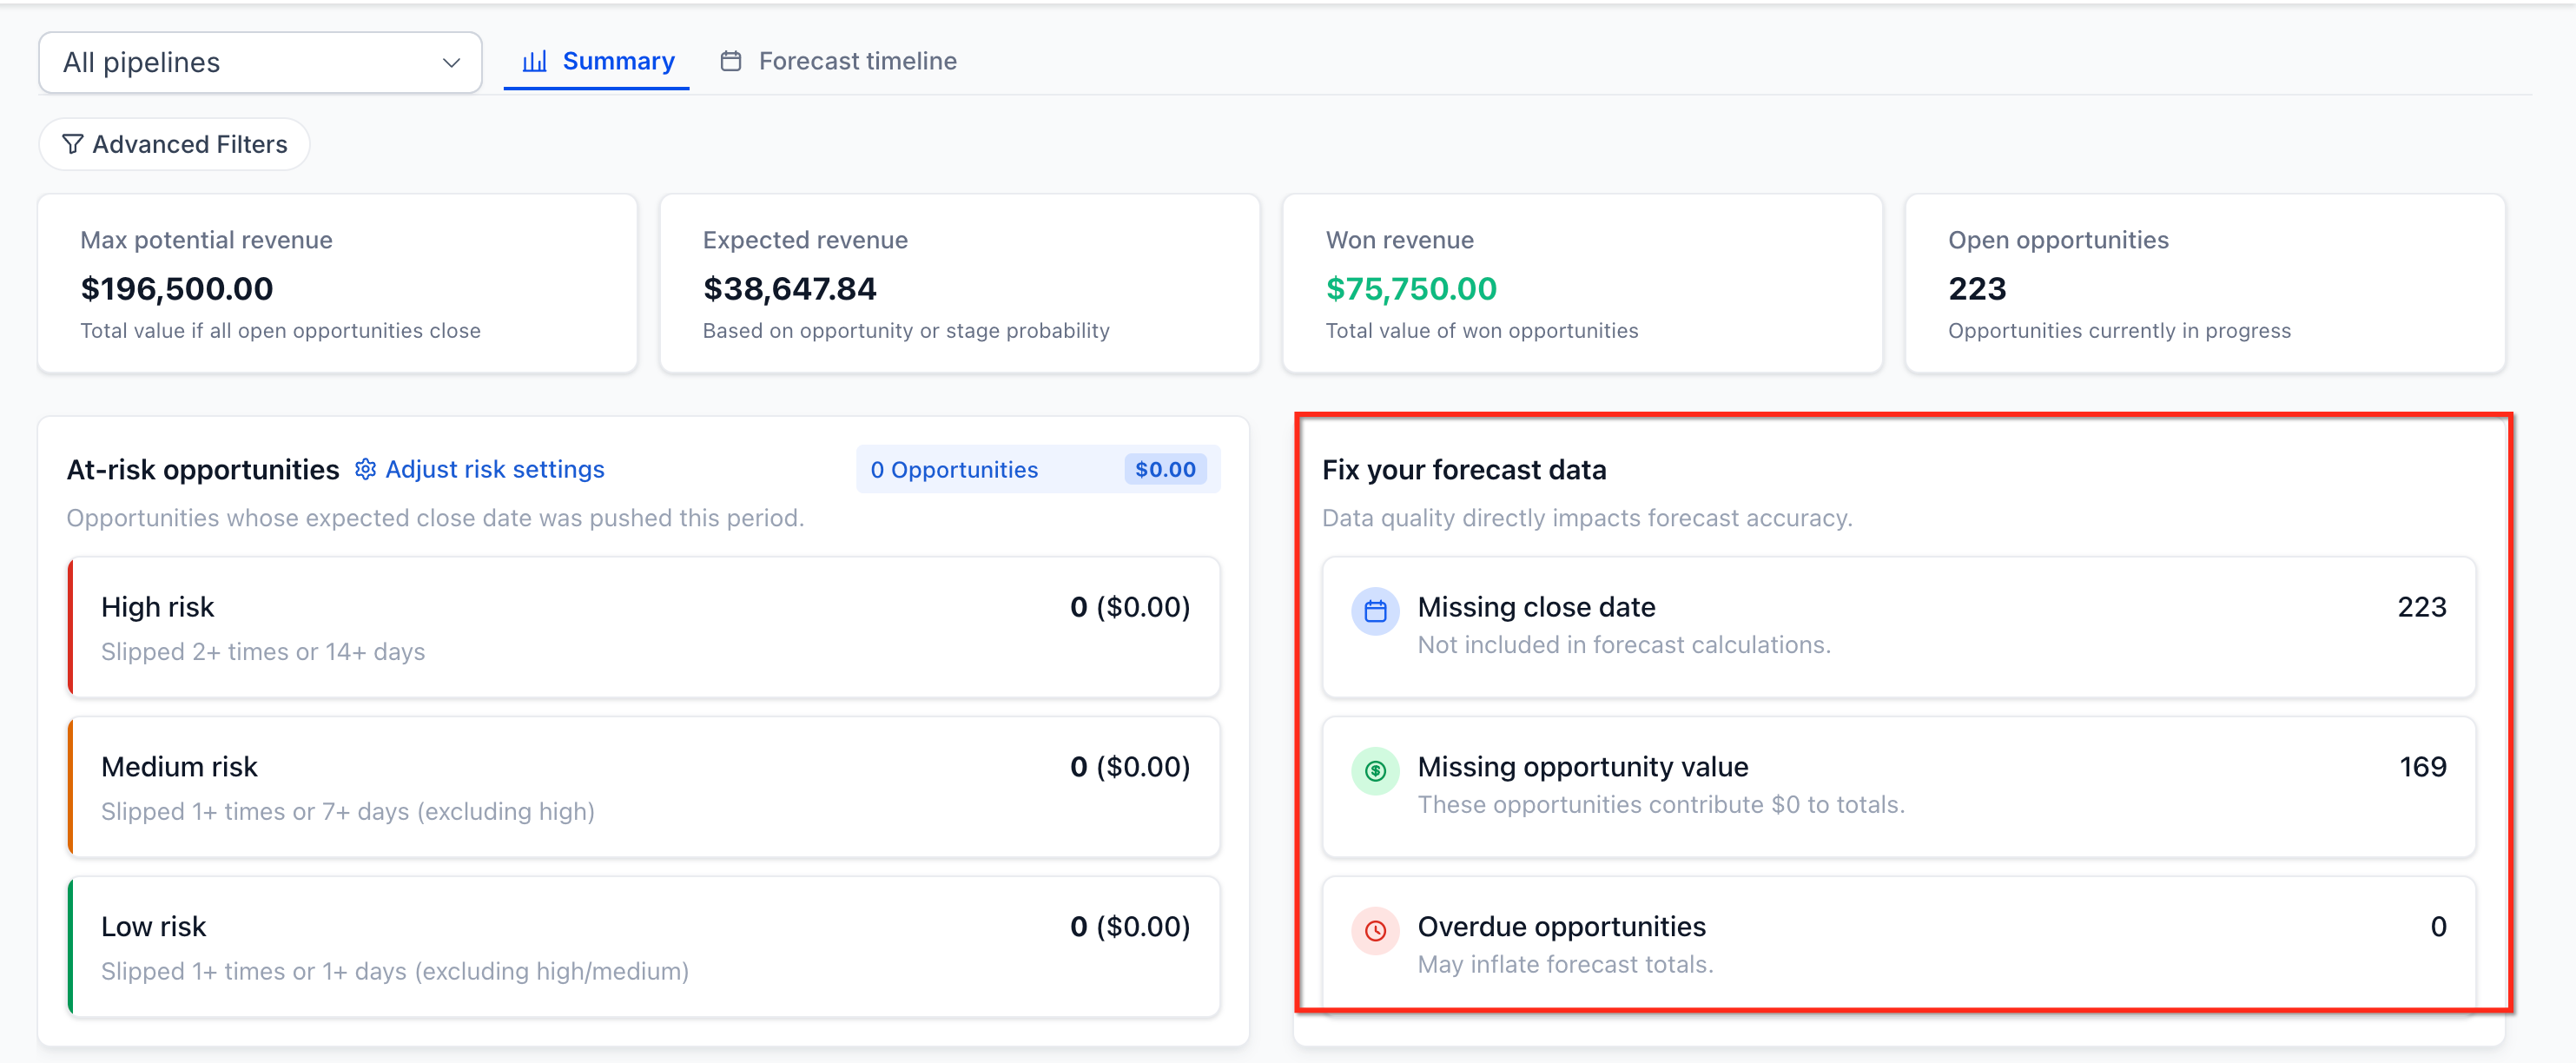
Cleaner Pipeline Management: Identify missing amount values, missing dates, stale opportunities, and other data issues that can weaken forecast quality.
Faster Decision-Making: Use timeline views, filters, and drilldowns to focus on specific owners, pipelines, or date ranges.
Improved Risk Awareness: Highlight deals that may be slipping so your team can take action earlier.
Less Manual Work: Reduce dependency on external spreadsheets and manual forecasting workflows.
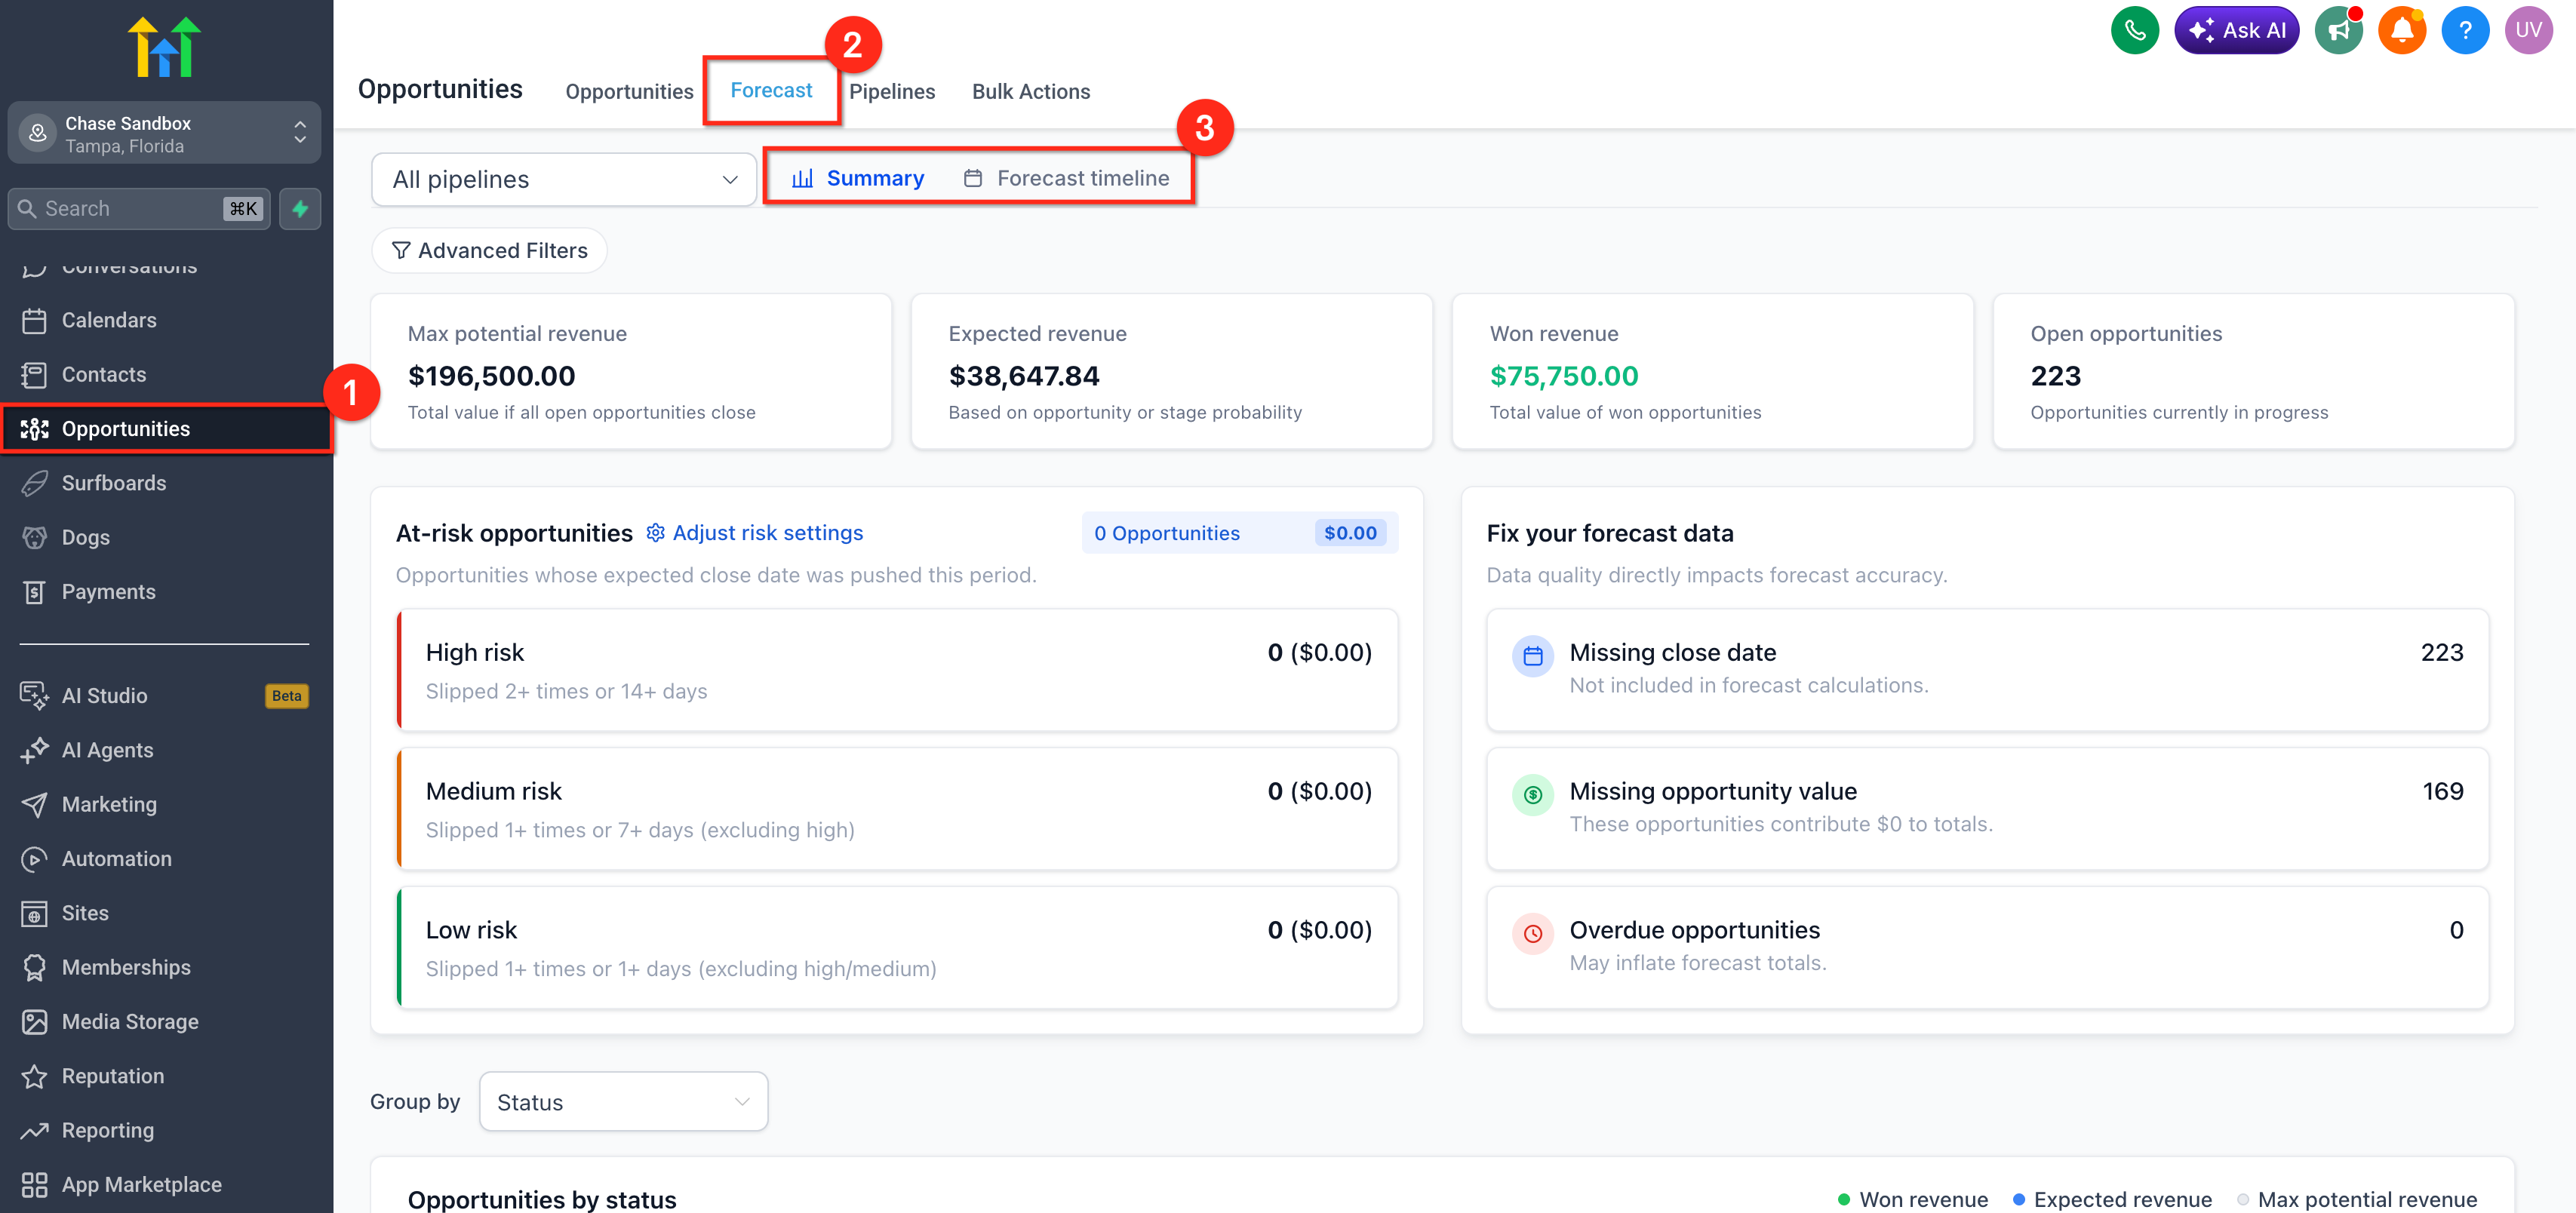
The Forecast Summary view helps you understand your current revenue outlook at a glance. It is useful for quick reviews, pipeline check-ins, and identifying which areas need immediate attention before you dive deeper into individual deals.
The Summary view provides a high-level dashboard of forecast performance. You can review key revenue metrics and click into them to inspect the opportunities behind the numbers. This view is best when you want a fast snapshot of pipeline strength and expected outcomes.
Forecasting becomes more useful when you can see when revenue is expected to land. A time-based timeline helps you understand pacing, identify crowded periods, and recognize when deals may be slipping into future periods.
The Forecast Timeline view gives you a visual way to track opportunities across time. You can switch between Week, Month, and Quarter views to understand when revenue is expected to close and how the pipeline is distributed over time.
Weighted forecasting helps you avoid overestimating revenue by using opportunity probability rather than treating every open deal as equally likely to close. This creates a more practical revenue expectation and supports more informed planning.
Opportunity Forecasting includes Expected Revenue, which is the weighted forecast value shown in the Forecast tab. Weighting can use stage probability or manual probability overrides when applied.
Forecast accuracy depends heavily on timing. Expected Close Date helps you estimate when revenue is likely to land, so forecasts can reflect realistic sales timing rather than only stage position.
Opportunity Forecasting introduces a new Expected Close Date field. This field supports time-based forecasting across weekly, monthly, and quarterly views. Keeping it updated helps you place opportunities in the correct forecast period and improves the usefulness of the Forecast Timeline.
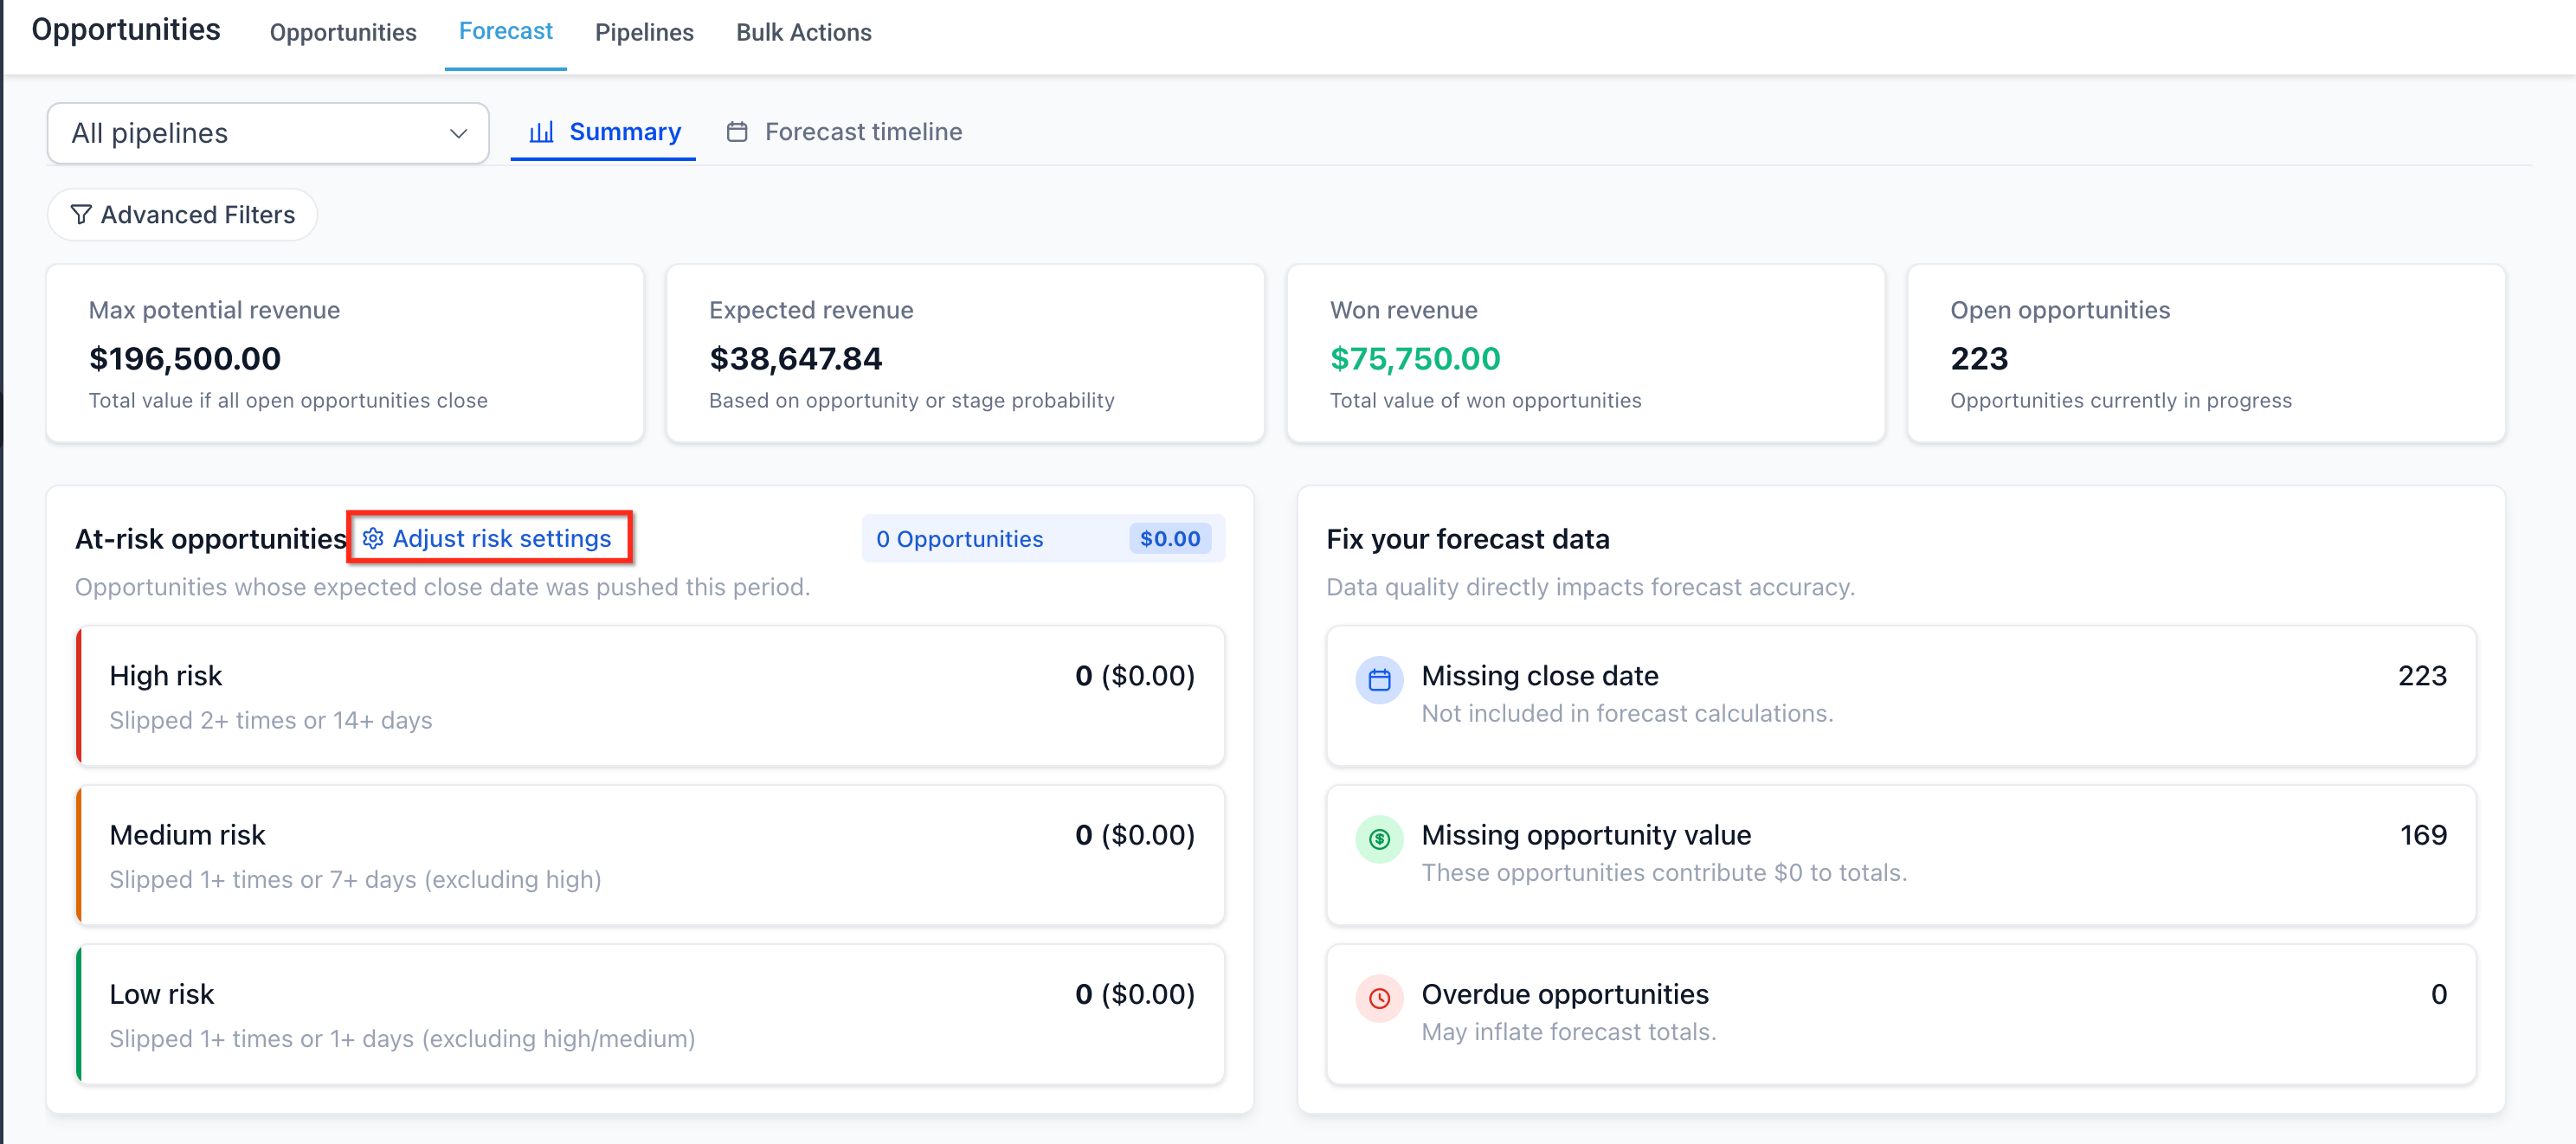
Forecasting is not only about projected revenue. It is also about understanding how likely deals are to slip or miss their expected timing. Risk indicators help you focus attention on opportunities that may need follow-up before they affect forecast accuracy.
Opportunity Forecasting includes a risk classification system with High, Medium, and Low risk levels. Risk is based on delays and slippage, and it includes configurable risk settings so you can define your own thresholds for slippage and overdue deals.
Setup matters because forecasting depends on both feature access and clean opportunity data. Enabling the feature is only the first step. To get useful results, review your opportunity values, dates, and pipeline hygiene before relying on forecast outputs.
Step 1: Enable the feature in Labs. From your sub-account, open Labs and enable Opportunity Forecasting.
Step 2: Open the Forecast tab. Navigate to Opportunities, open the Forecast tab, and choose either Summary or Forecast Timeline.
Step 3: Choose your time granularity. Select your preferred view: Week, Month, or Quarter.
Step 4: Apply filters. Filter for specific pipelines, owners, or other segments.
Step 5: Drill into the details. Click into any metric or time bucket to drill down into the underlying opportunities.
Step 6: Review risk settings. Review the risk settings and adjust the thresholds if needed.
Step 7: Clean up your data. Use the data hygiene insights to fix missing or outdated opportunity details.
Where do I enable Opportunity Forecasting? Enable it from your sub-account under Labs, then open Opportunities → Forecast.
What does Expected Revenue mean? Expected Revenue is the weighted forecast value shown in the Forecast tab. It can use stage probability or manual probability overrides when applied.
Why are some opportunities not helping my forecast? Missing amounts, missing dates, stale deals, or outdated records can reduce forecast accuracy and may appear in your data hygiene insights.
What is the Forecast Timeline used for? The Forecast Timeline helps you review expected revenue visually across time periods such as week, month, or quarter.
Can I review forecasts by owner or segment? Yes. Opportunity Forecasting supports advanced filtering and grouping, including analysis by owner and close-date-related views.
What does deal risk mean in Opportunity Forecasting? Risk identifies whether an opportunity may be slipping or delayed. The feature includes High, Medium, and Low risk classifications, plus configurable thresholds.
Why should I keep amount and date fields updated? Forecast quality depends on complete and current opportunity data. Missing values can make projections less reliable.
Does Opportunity Forecasting replace the regular Opportunities view? No. It adds a dedicated Forecast tab inside Opportunities, extending your existing opportunity management experience rather than replacing it.
Understanding Opportunities
Understanding Pipelines
How to Filter Opportunities
Step-by-Step Guide to Creating Opportunities
How to Use Custom Fields for Opportunities
For pipeline dashboards and revenue reporting across your account, see the Reporting section.