What are the benefits of having Statistics for ad campaigns in Ad Manager?
The merit of having Statistics of the published ad campaigns in Ad Manager is crucial to make moderations to the existing campaigns based on their performance and other parameters which are mentioned as follows. This assists in ad campaign optimising and generate maximum outcome off it.
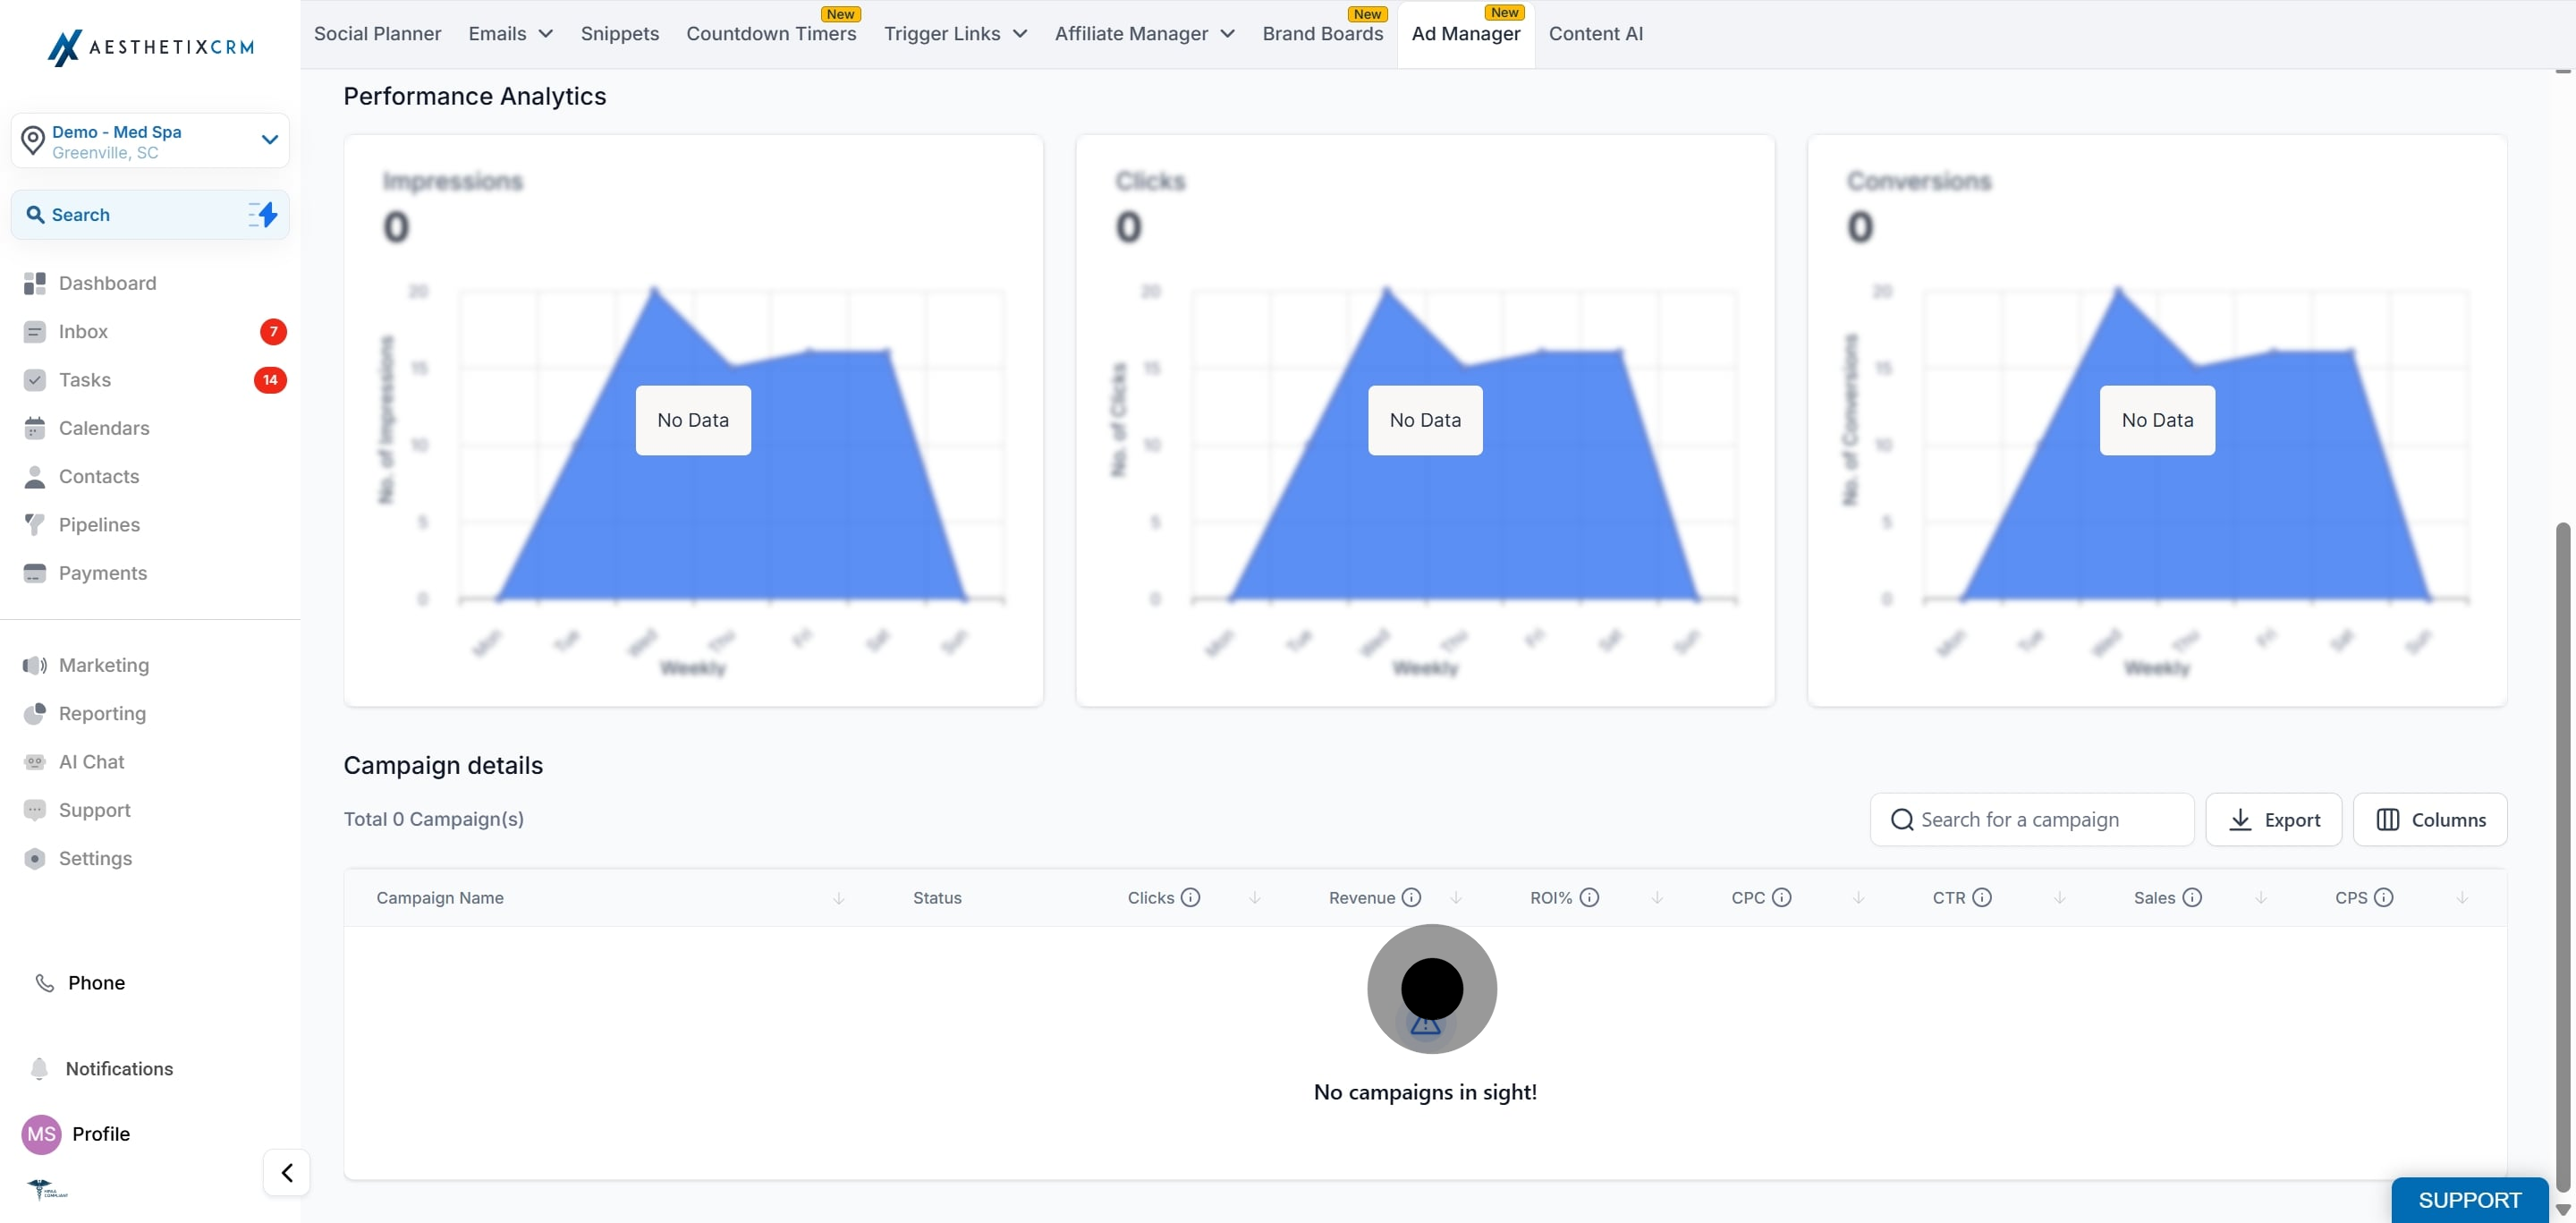
Performance Analysis- Understand how ads are doing
ROI Measurement- See if ads are making money
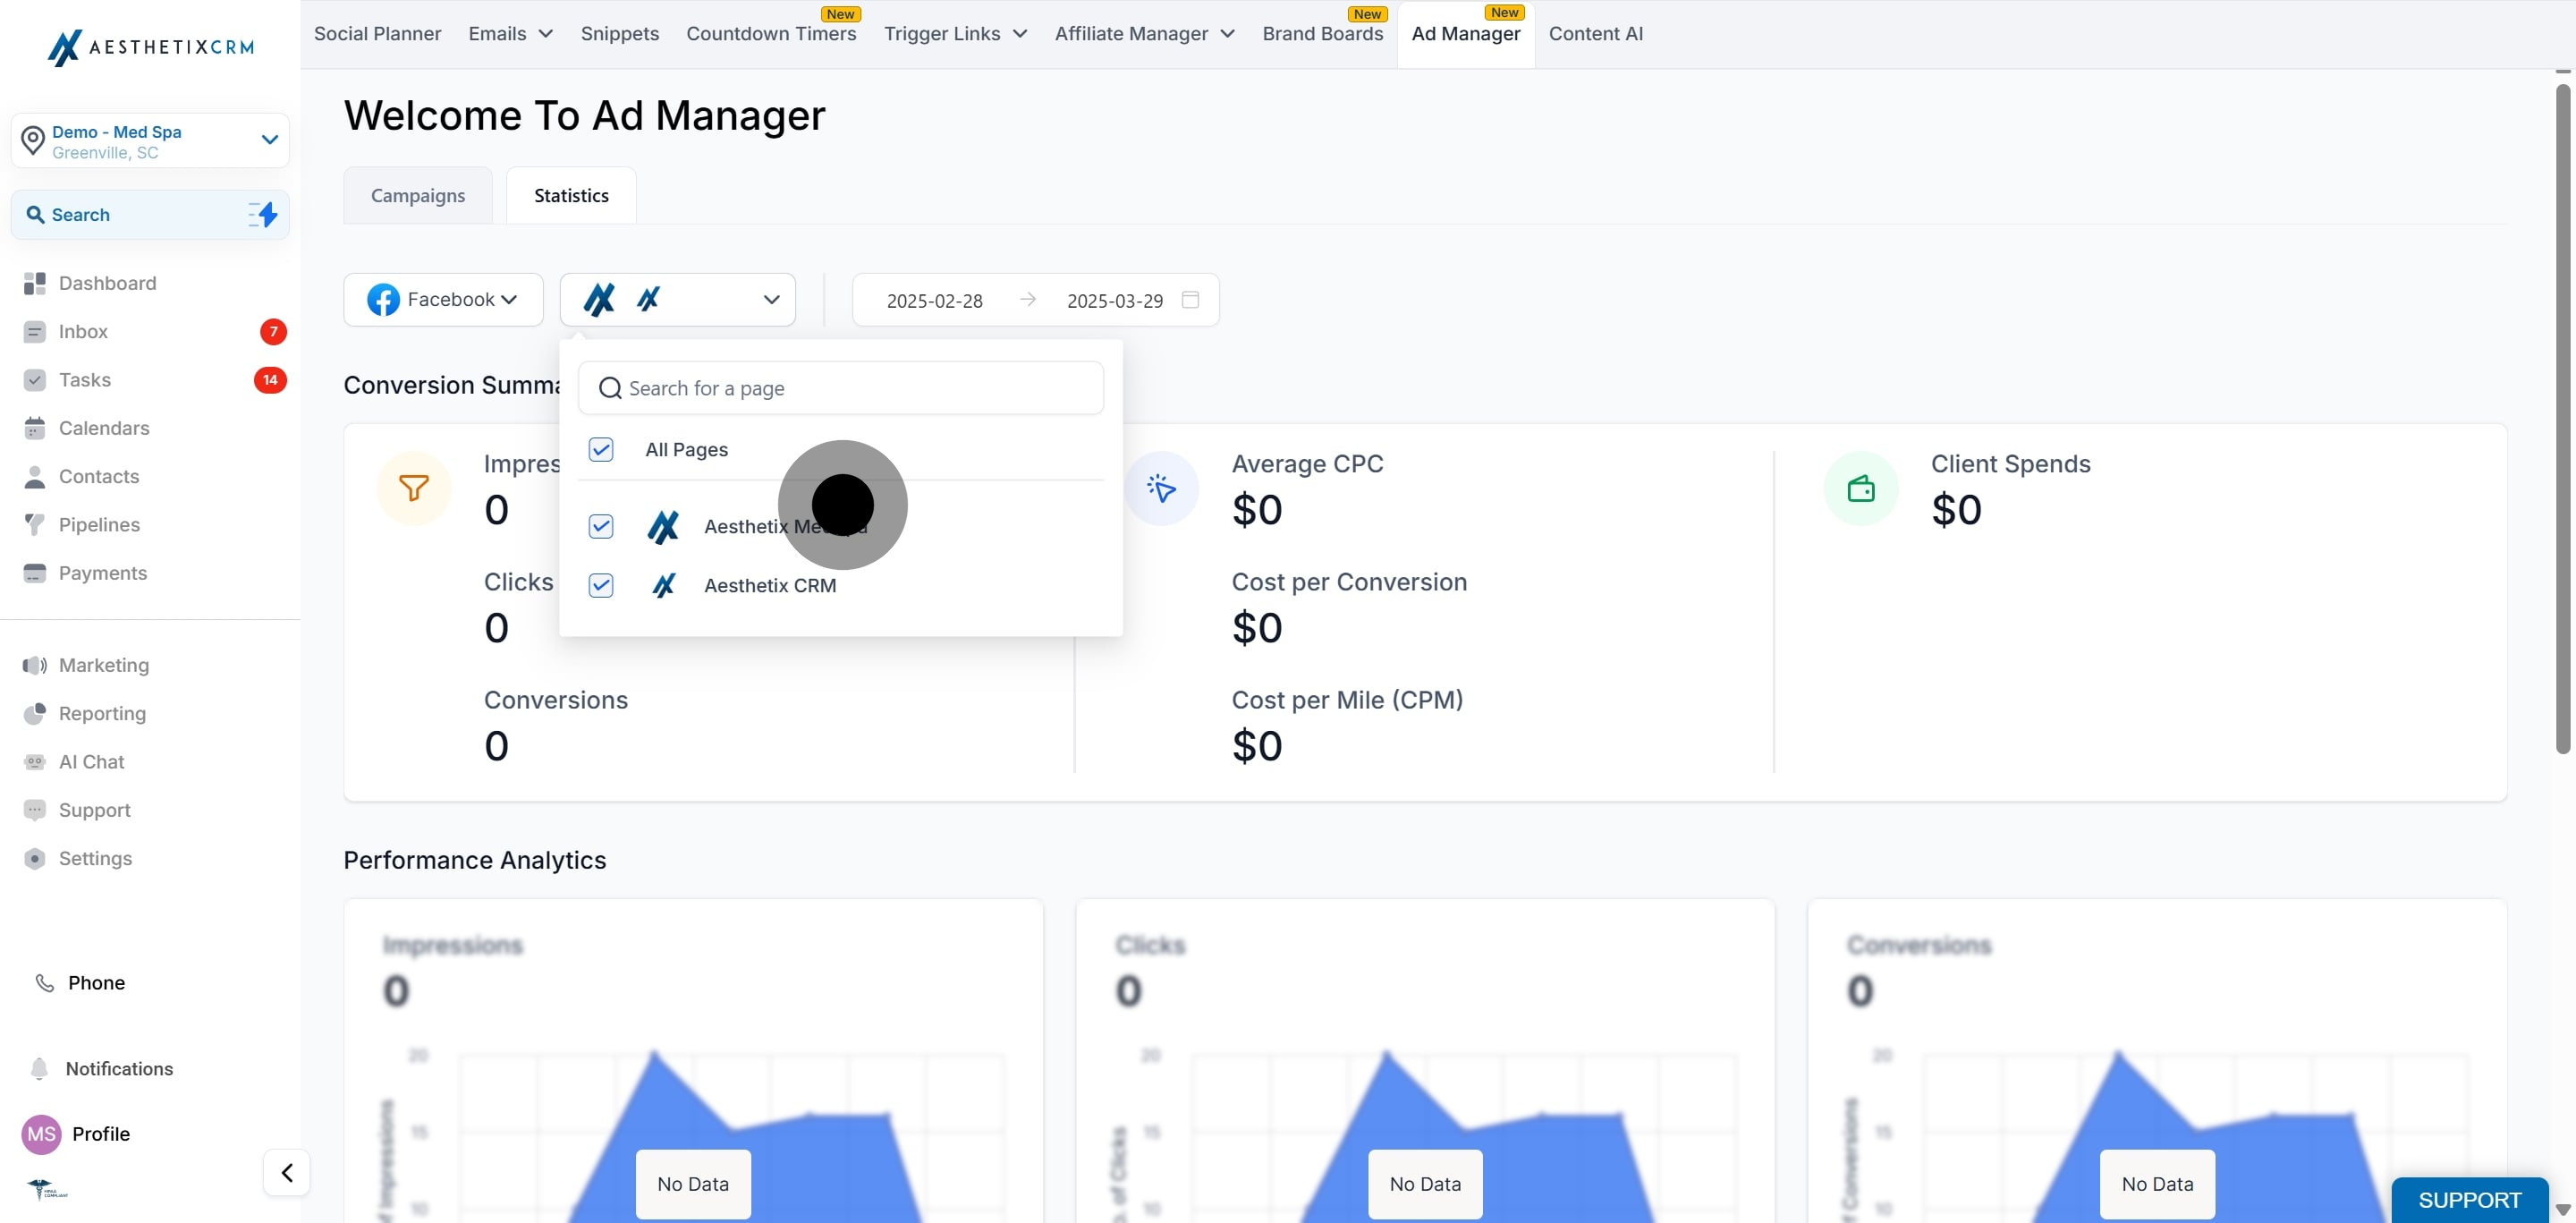
Audience Insights- Know who's seeing the ads
Campaign Optimisation- Make ads work better
Budget Allocation- Spend money wisely
Goal Tracking- Check if ads meet objectives
Competitive Analysis- See how ads stack up against rivals
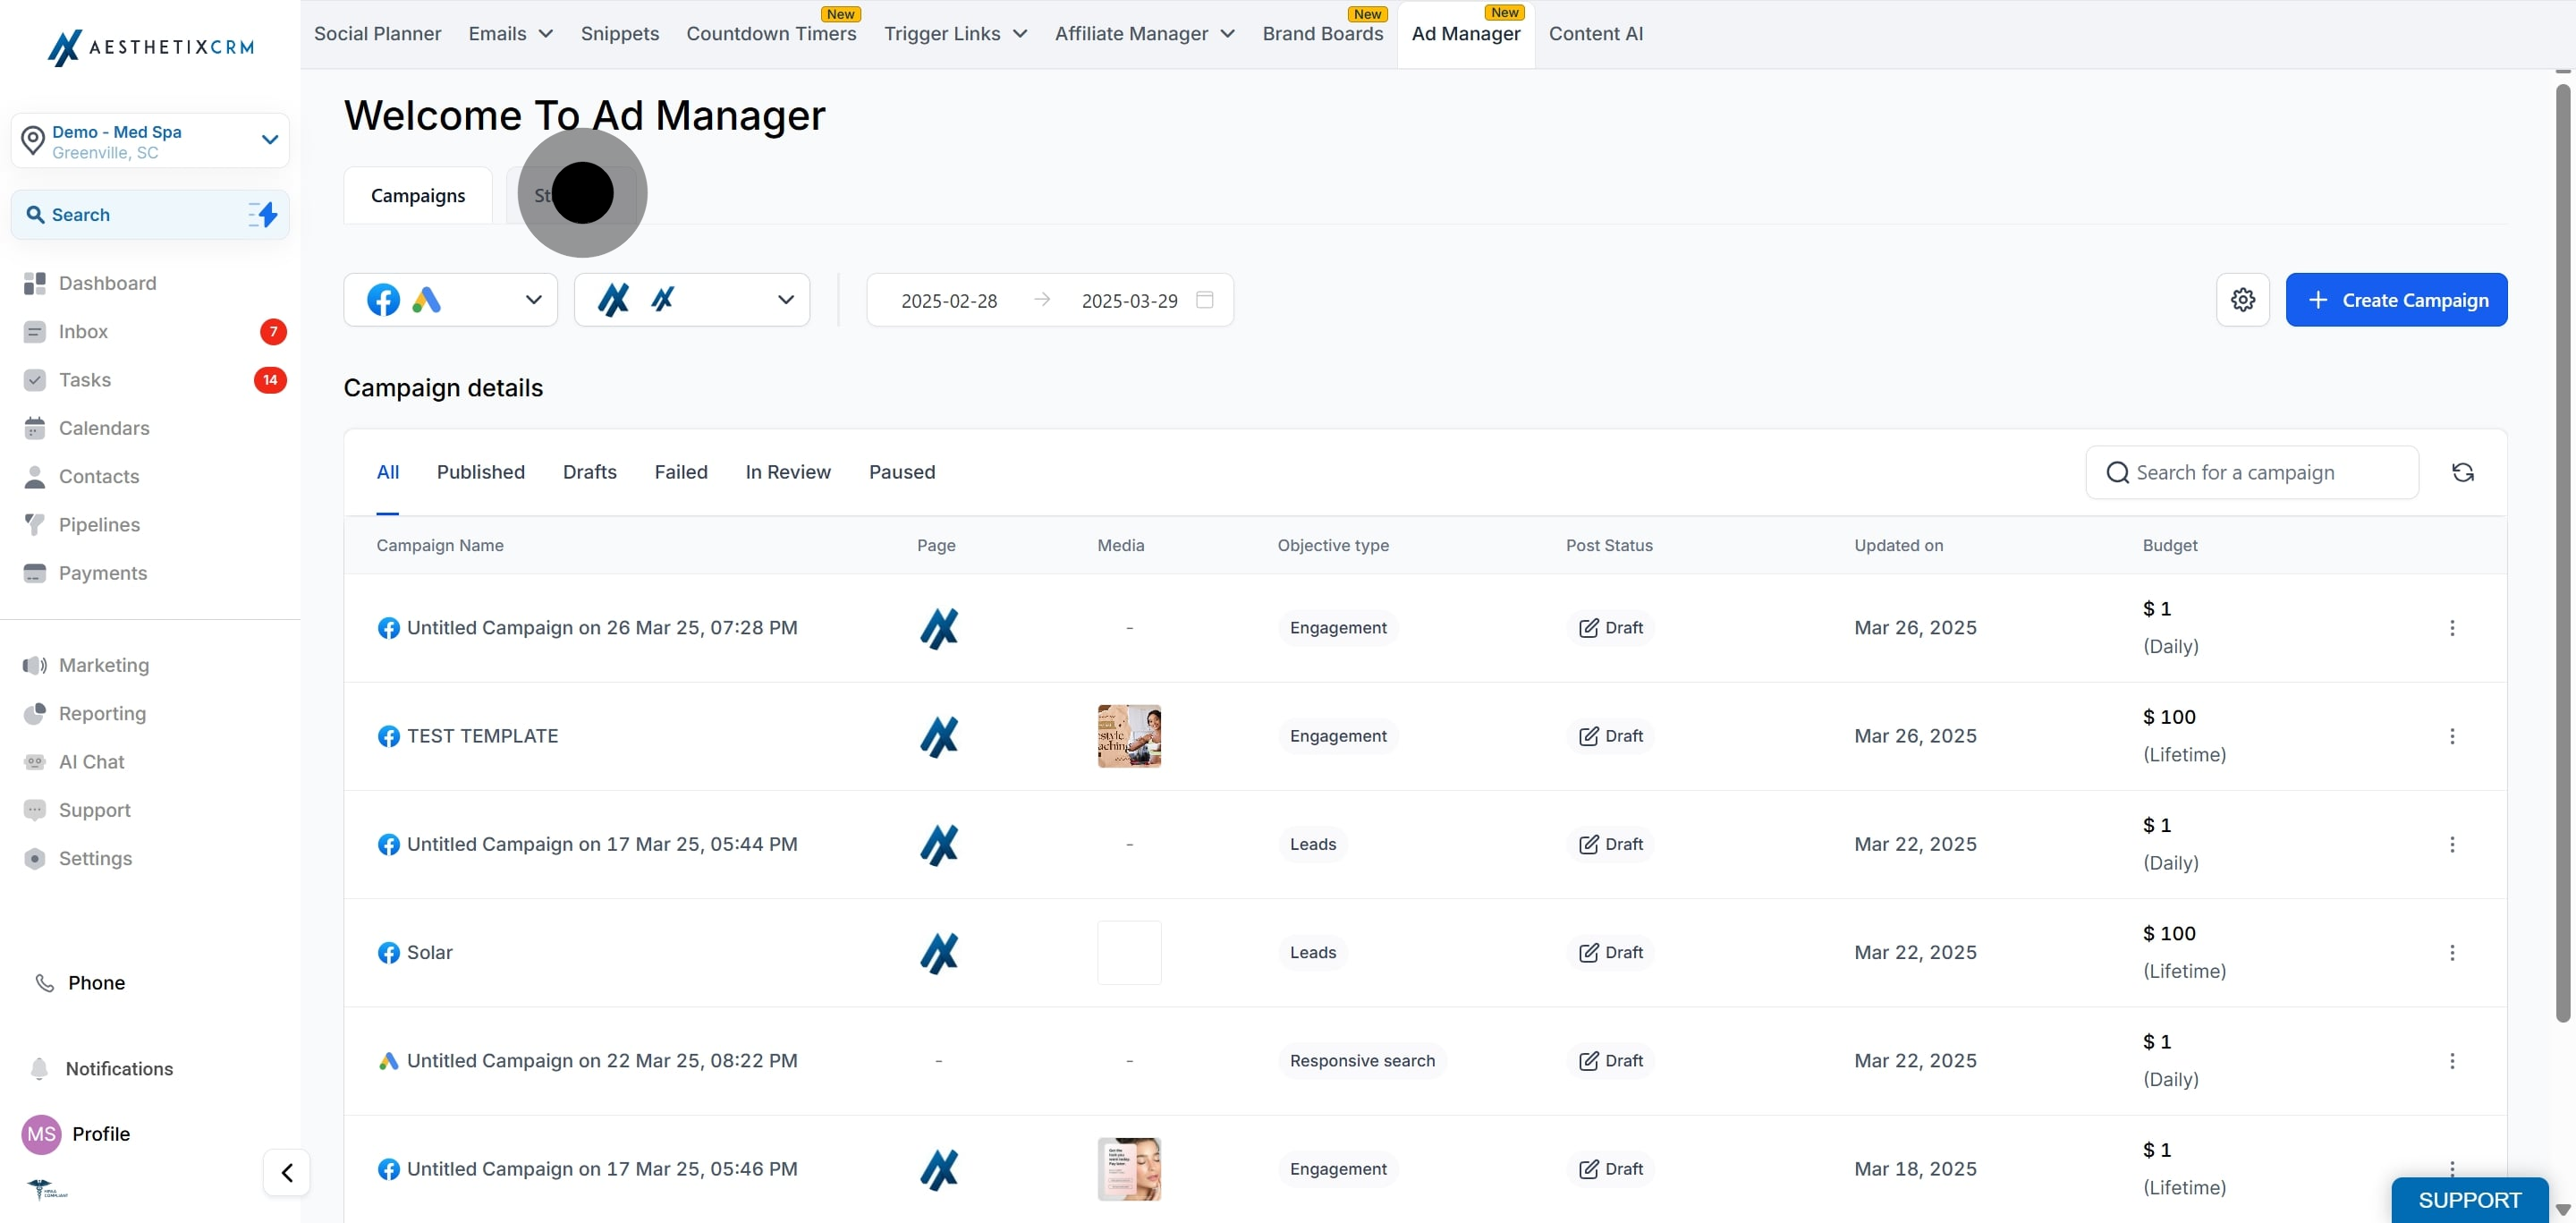
What are the different metrics that are shown in the tabular form?
The various parameters which are essential to understand how an ad campaign is performing are shown in a tabular form against each campaign. It is crucial for advertisers to measure, analyse, and optimise their advertising campaigns, ultimately driving better results and maximising return on investment.
Given below is a brief information on each campaign details table column headers in statistics:
Clicks: The total number of times users have clicked on your ad. This metric helps gauge interest in your offer.
Revenue: The total income generated from your ad campaign, often measured through sales or conversions attributed to the ad.
ROI%: Return on Investment is a percentage that measures the return on your advertising spend.
CPC: Cost per Click is the average amount you pay for each click on your ad.
CTR: Click-Through-Rate is the percentage of people who clicked on your ad after seeing it.
Sales: The total number of purchases made as a result of the ad campaign. This metric directly correlates to the success of sales-focused campaigns.
CPS: Cost per Sale is the average cost incurred for each sale generated through the ad. It’s calculated by dividing total ad spend by the number of sales.
Leads: The number of potential customers who have shown interest in your product or service, typically by submitting their contact information.
Results: The number of times that your ad achieved an outcome, based on the objective selected.
CPL: Cost per Lead is the average cost of acquiring a lead.
Impressions: The total number of times your ad was displayed to users, regardless of whether it was clicked.
Spend: The total amount of money spent on the ad campaign. This includes all costs associated with running the ads.
Frequently Asked Questions
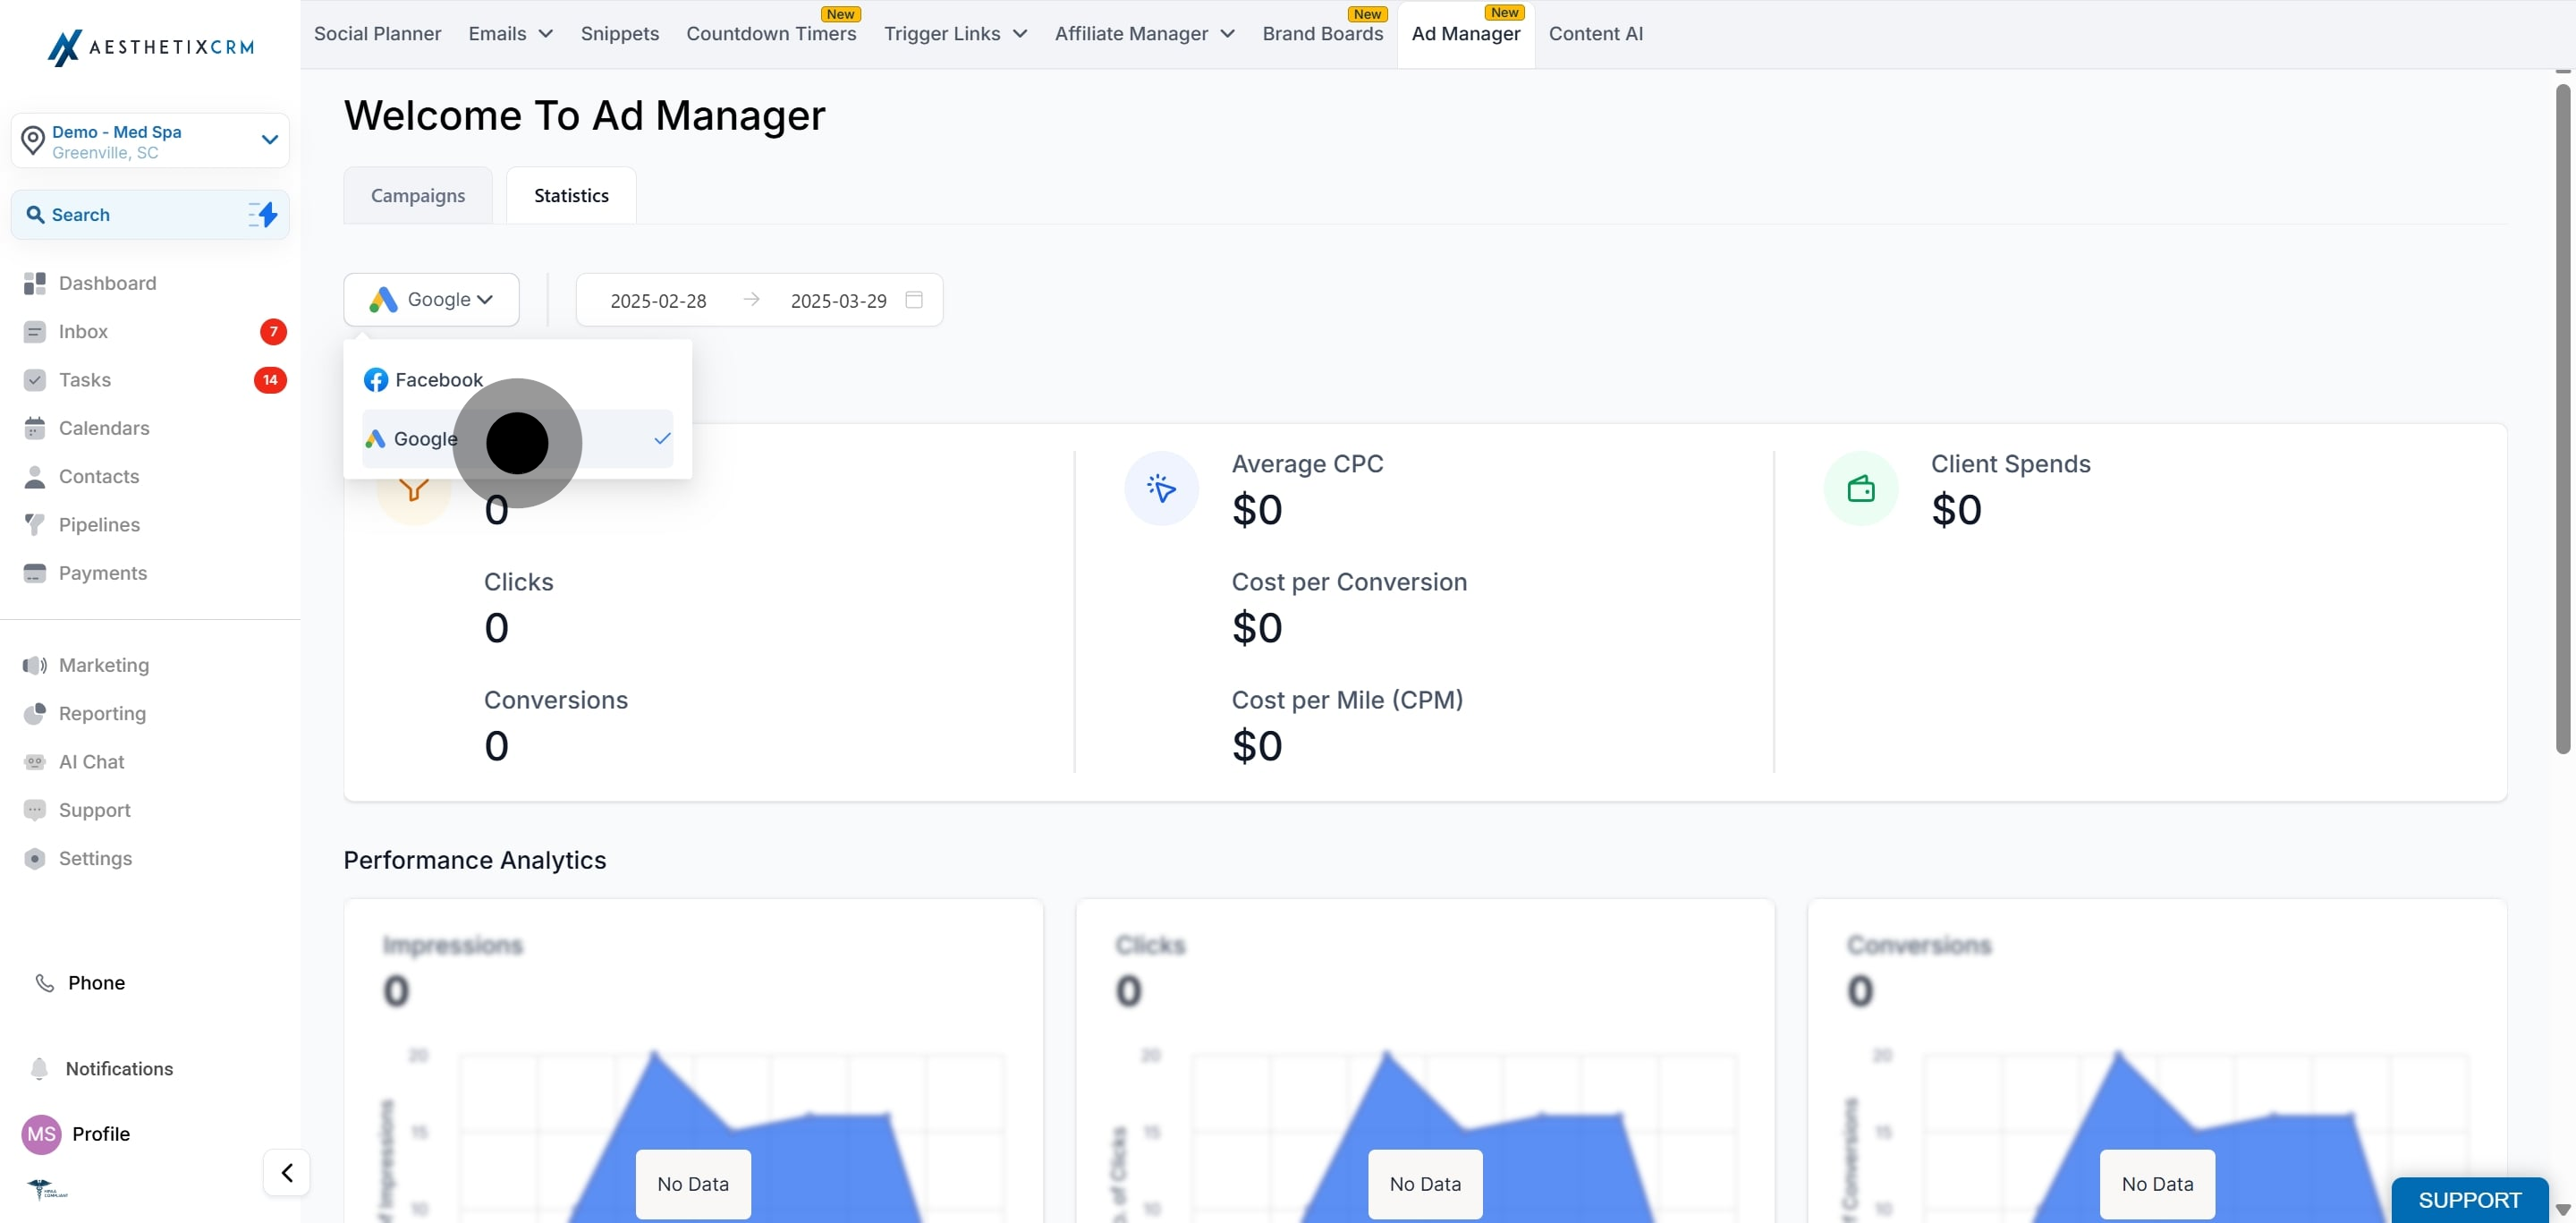
1. What key metrics can I track in the Ad Manager?
In Ad Manager, you can track various metrics such as impressions, clicks, conversions, click-through rate (CTR), cost per click (CPC), and return on ad spend (ROAS), among others.
2. How often are the campaign statistics updated?
Campaign statistics are updated in real-time, allowing you to monitor performance and make adjustments as needed.
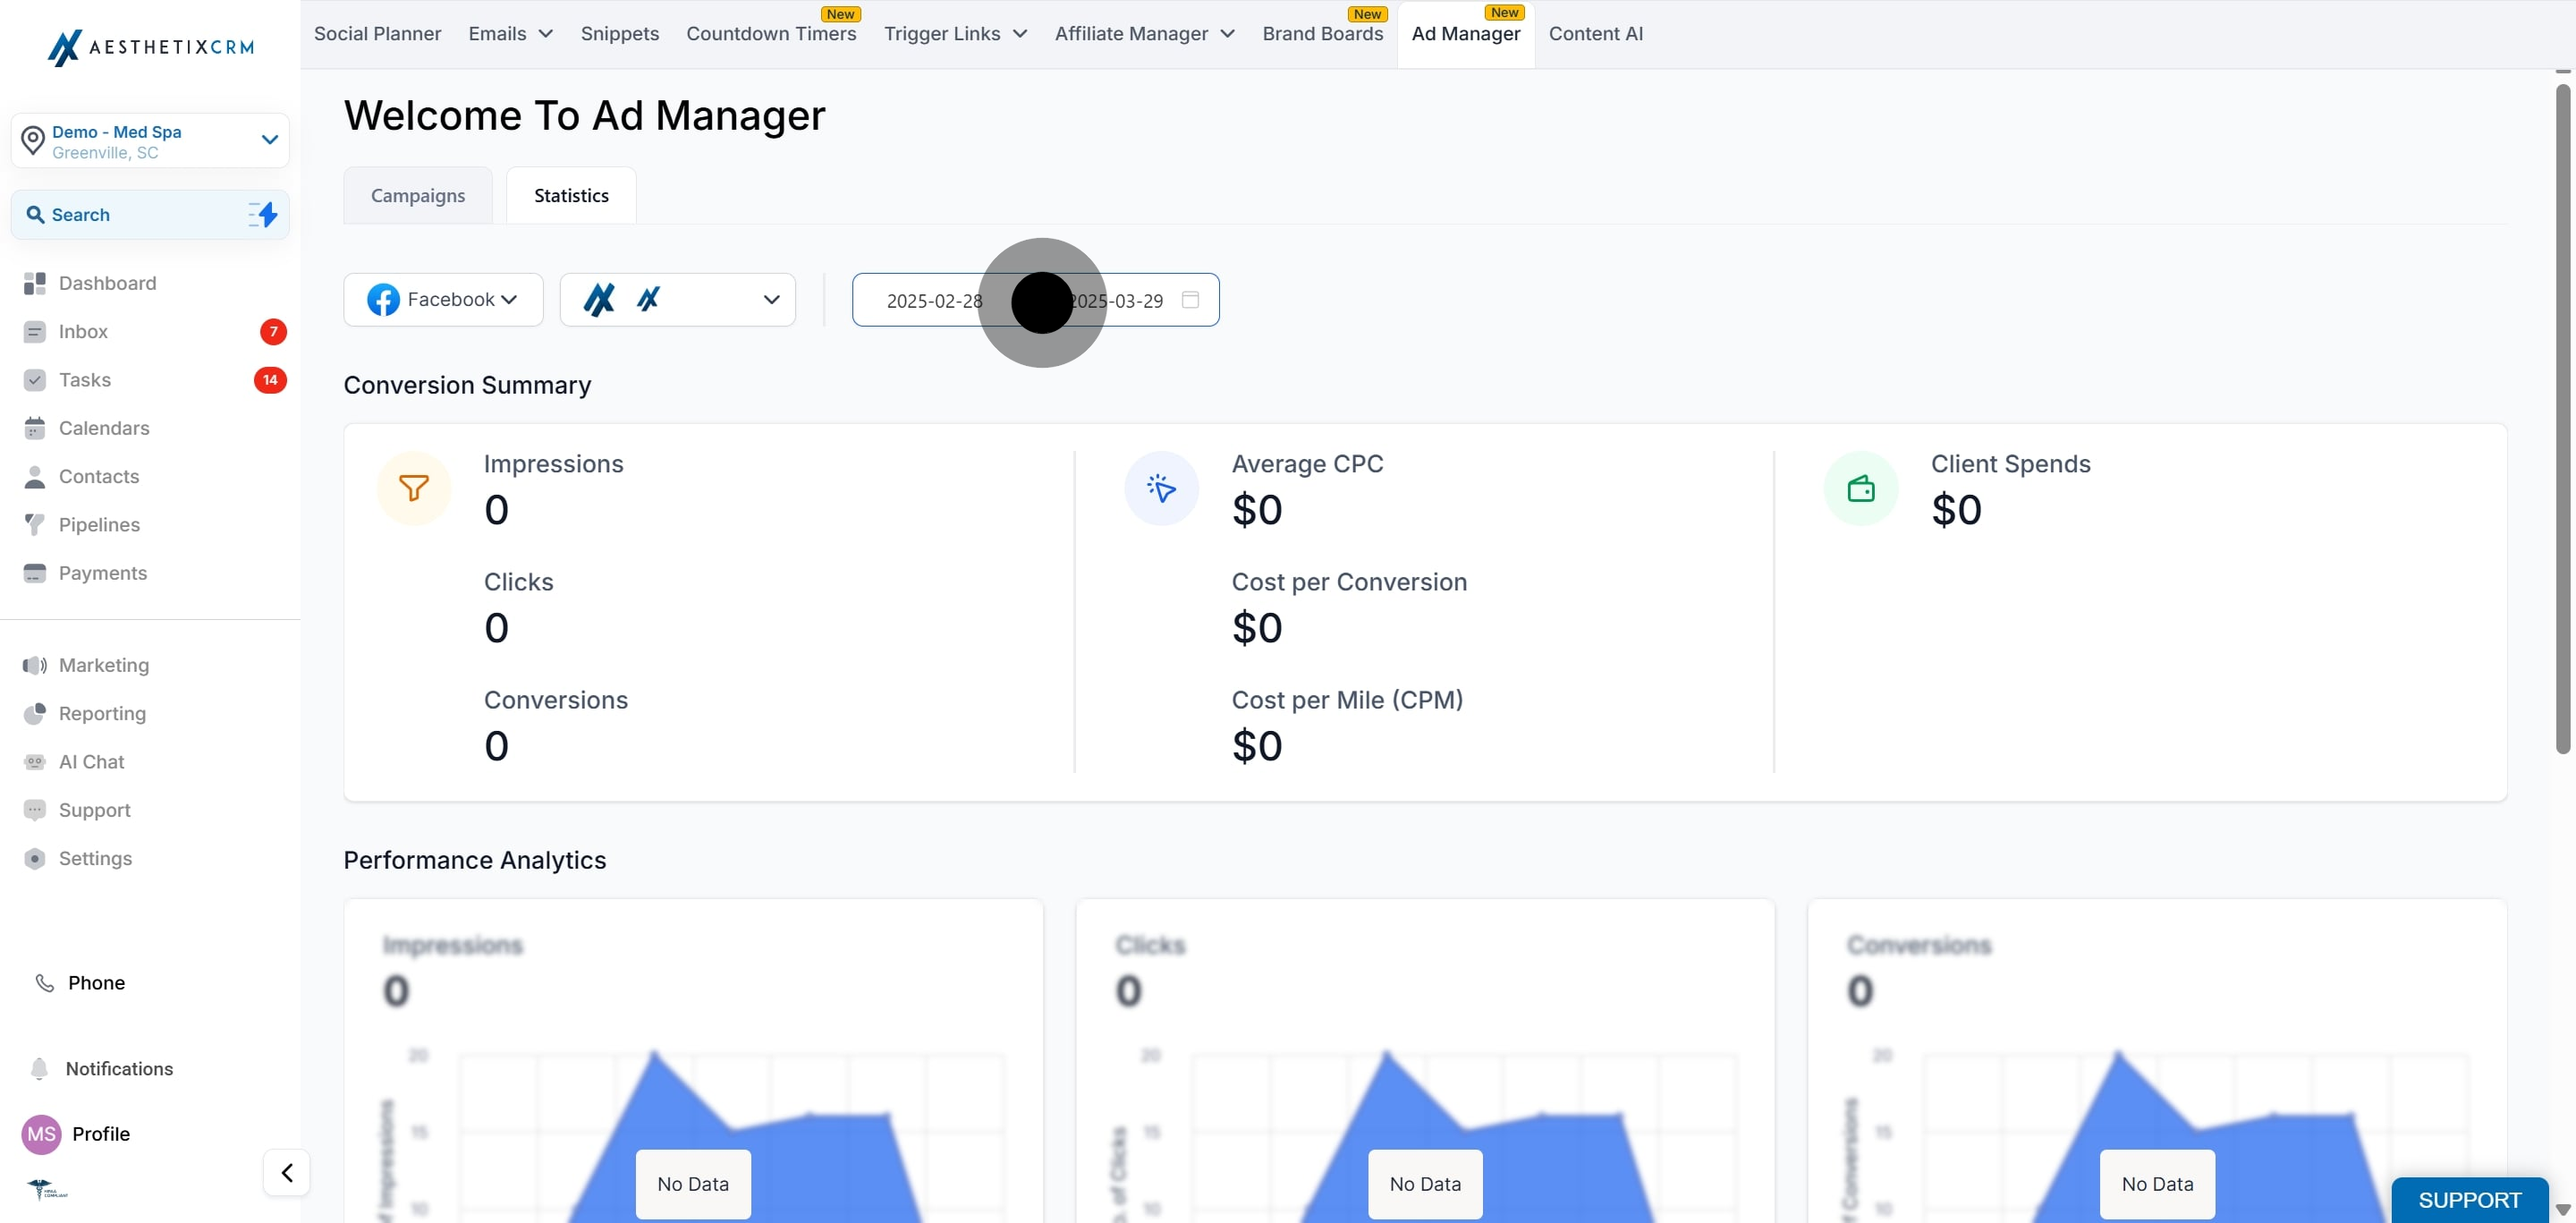
3. Can I filter statistics by specific time periods?
Yes, you can filter statistics by custom date ranges, allowing you to analyze campaign performance over specific periods.
4. What should I do if my ad performance is below expectations?
If your ad performance is lacking, consider adjusting your targeting, reviewing your ad creative, or testing different ad formats. Utilize the statistics to identify areas for improvement.
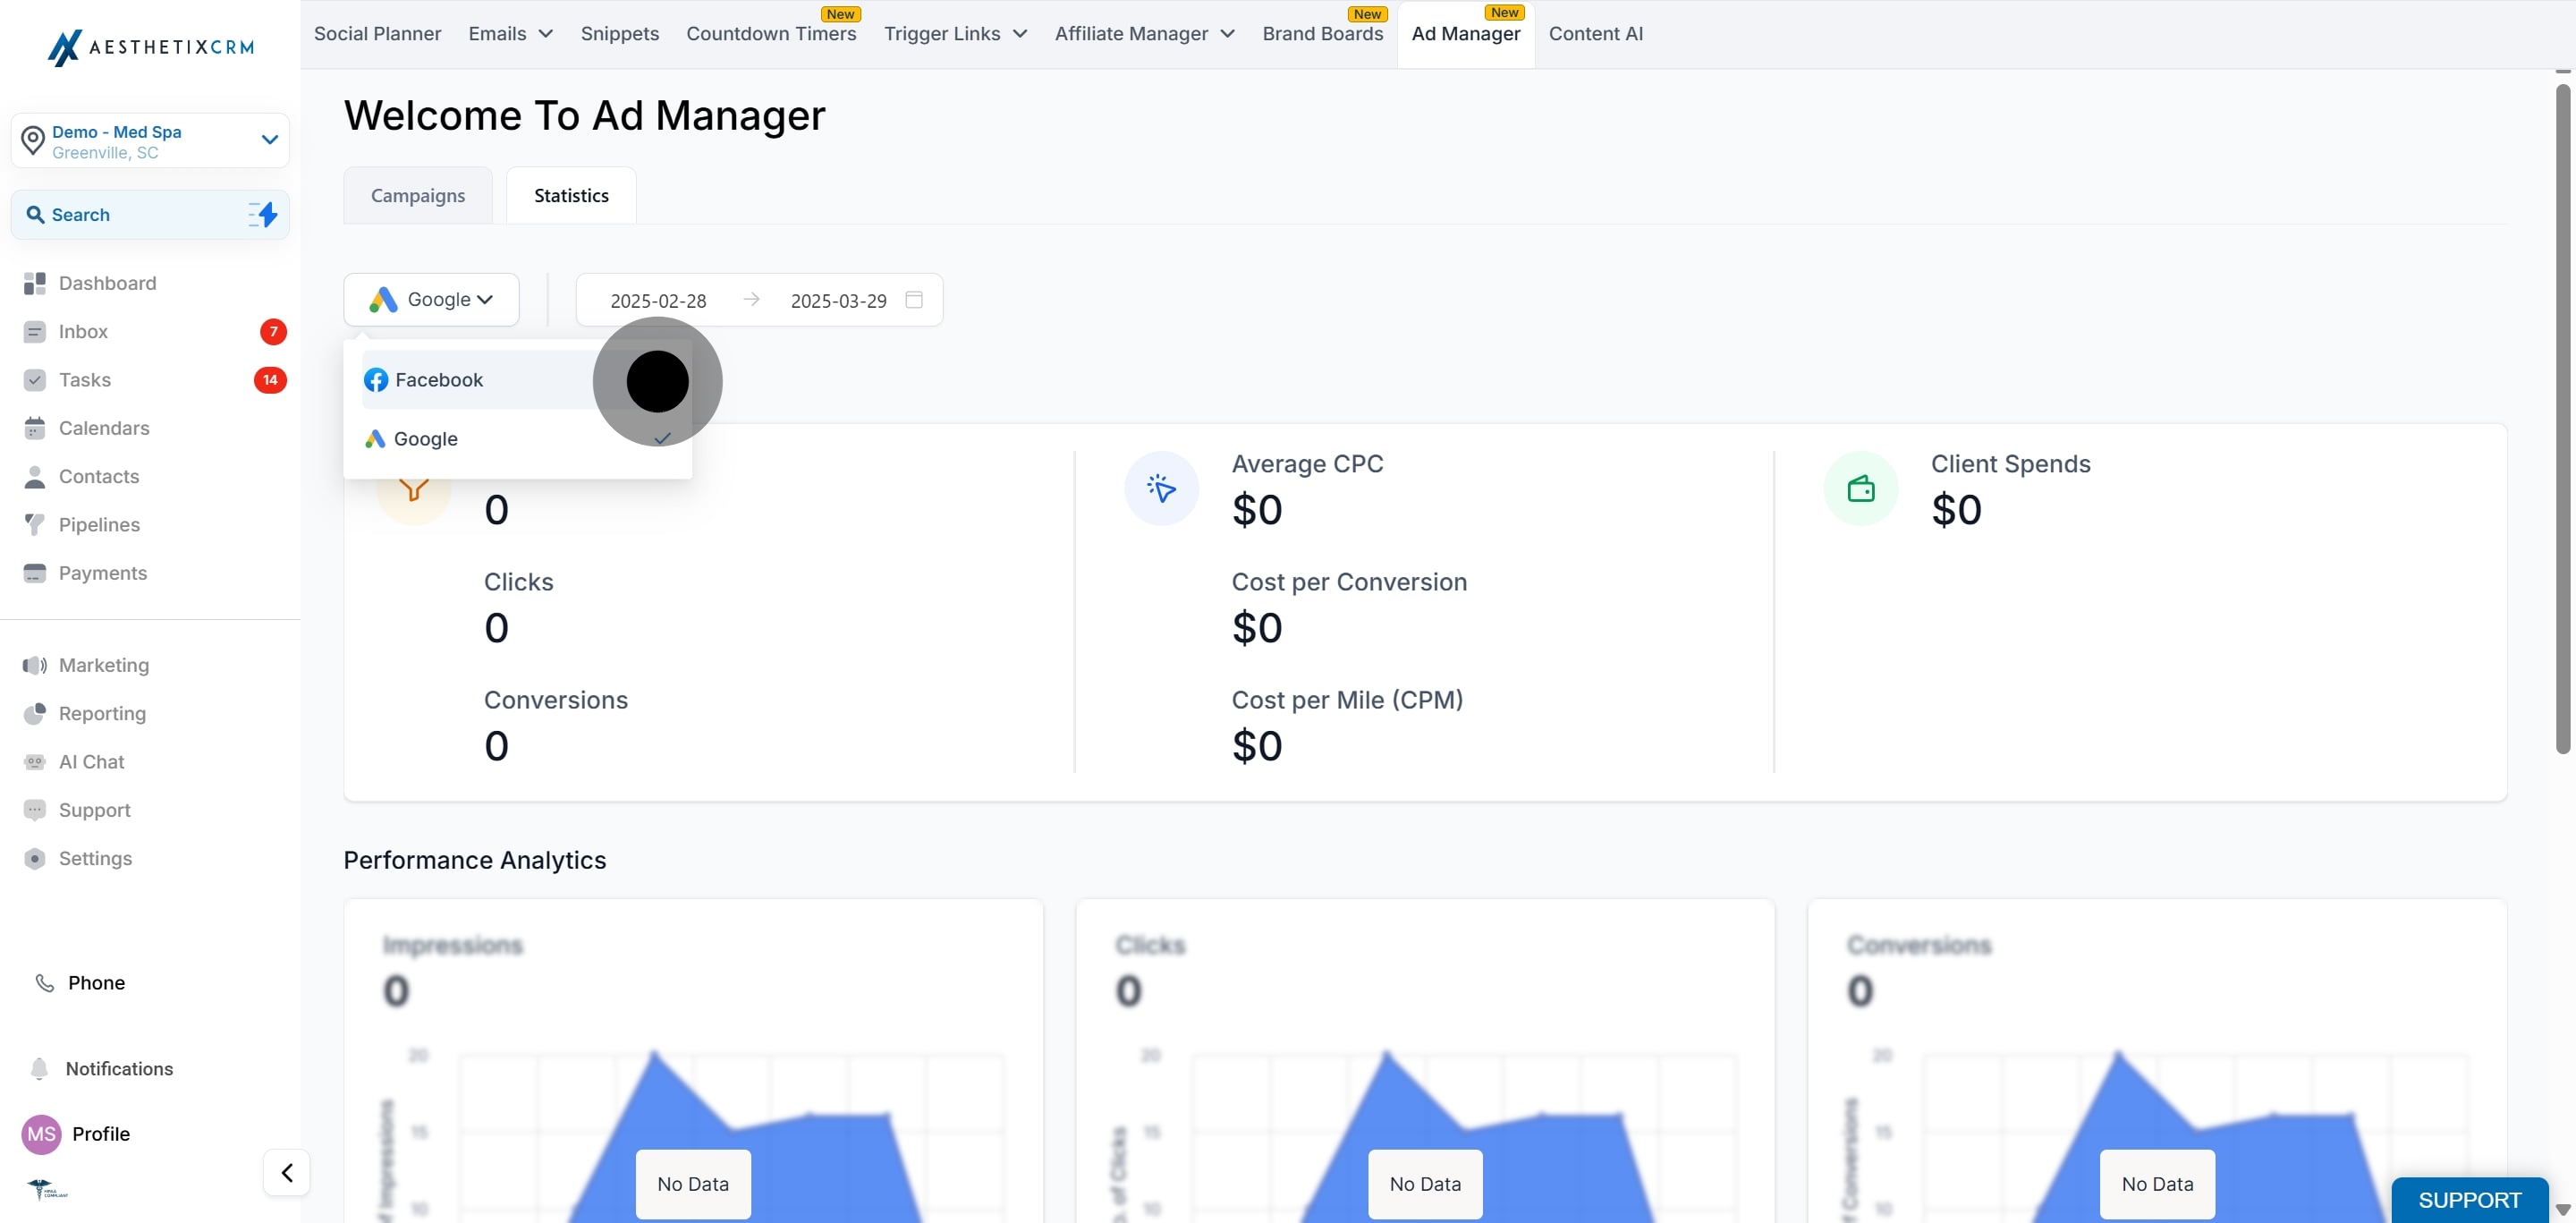
5. How can I compare the performance of multiple ad campaigns?
You can compare the performance of multiple ad campaigns by using the comparison feature in the Ad Manager, which allows you to view key metrics side by side.
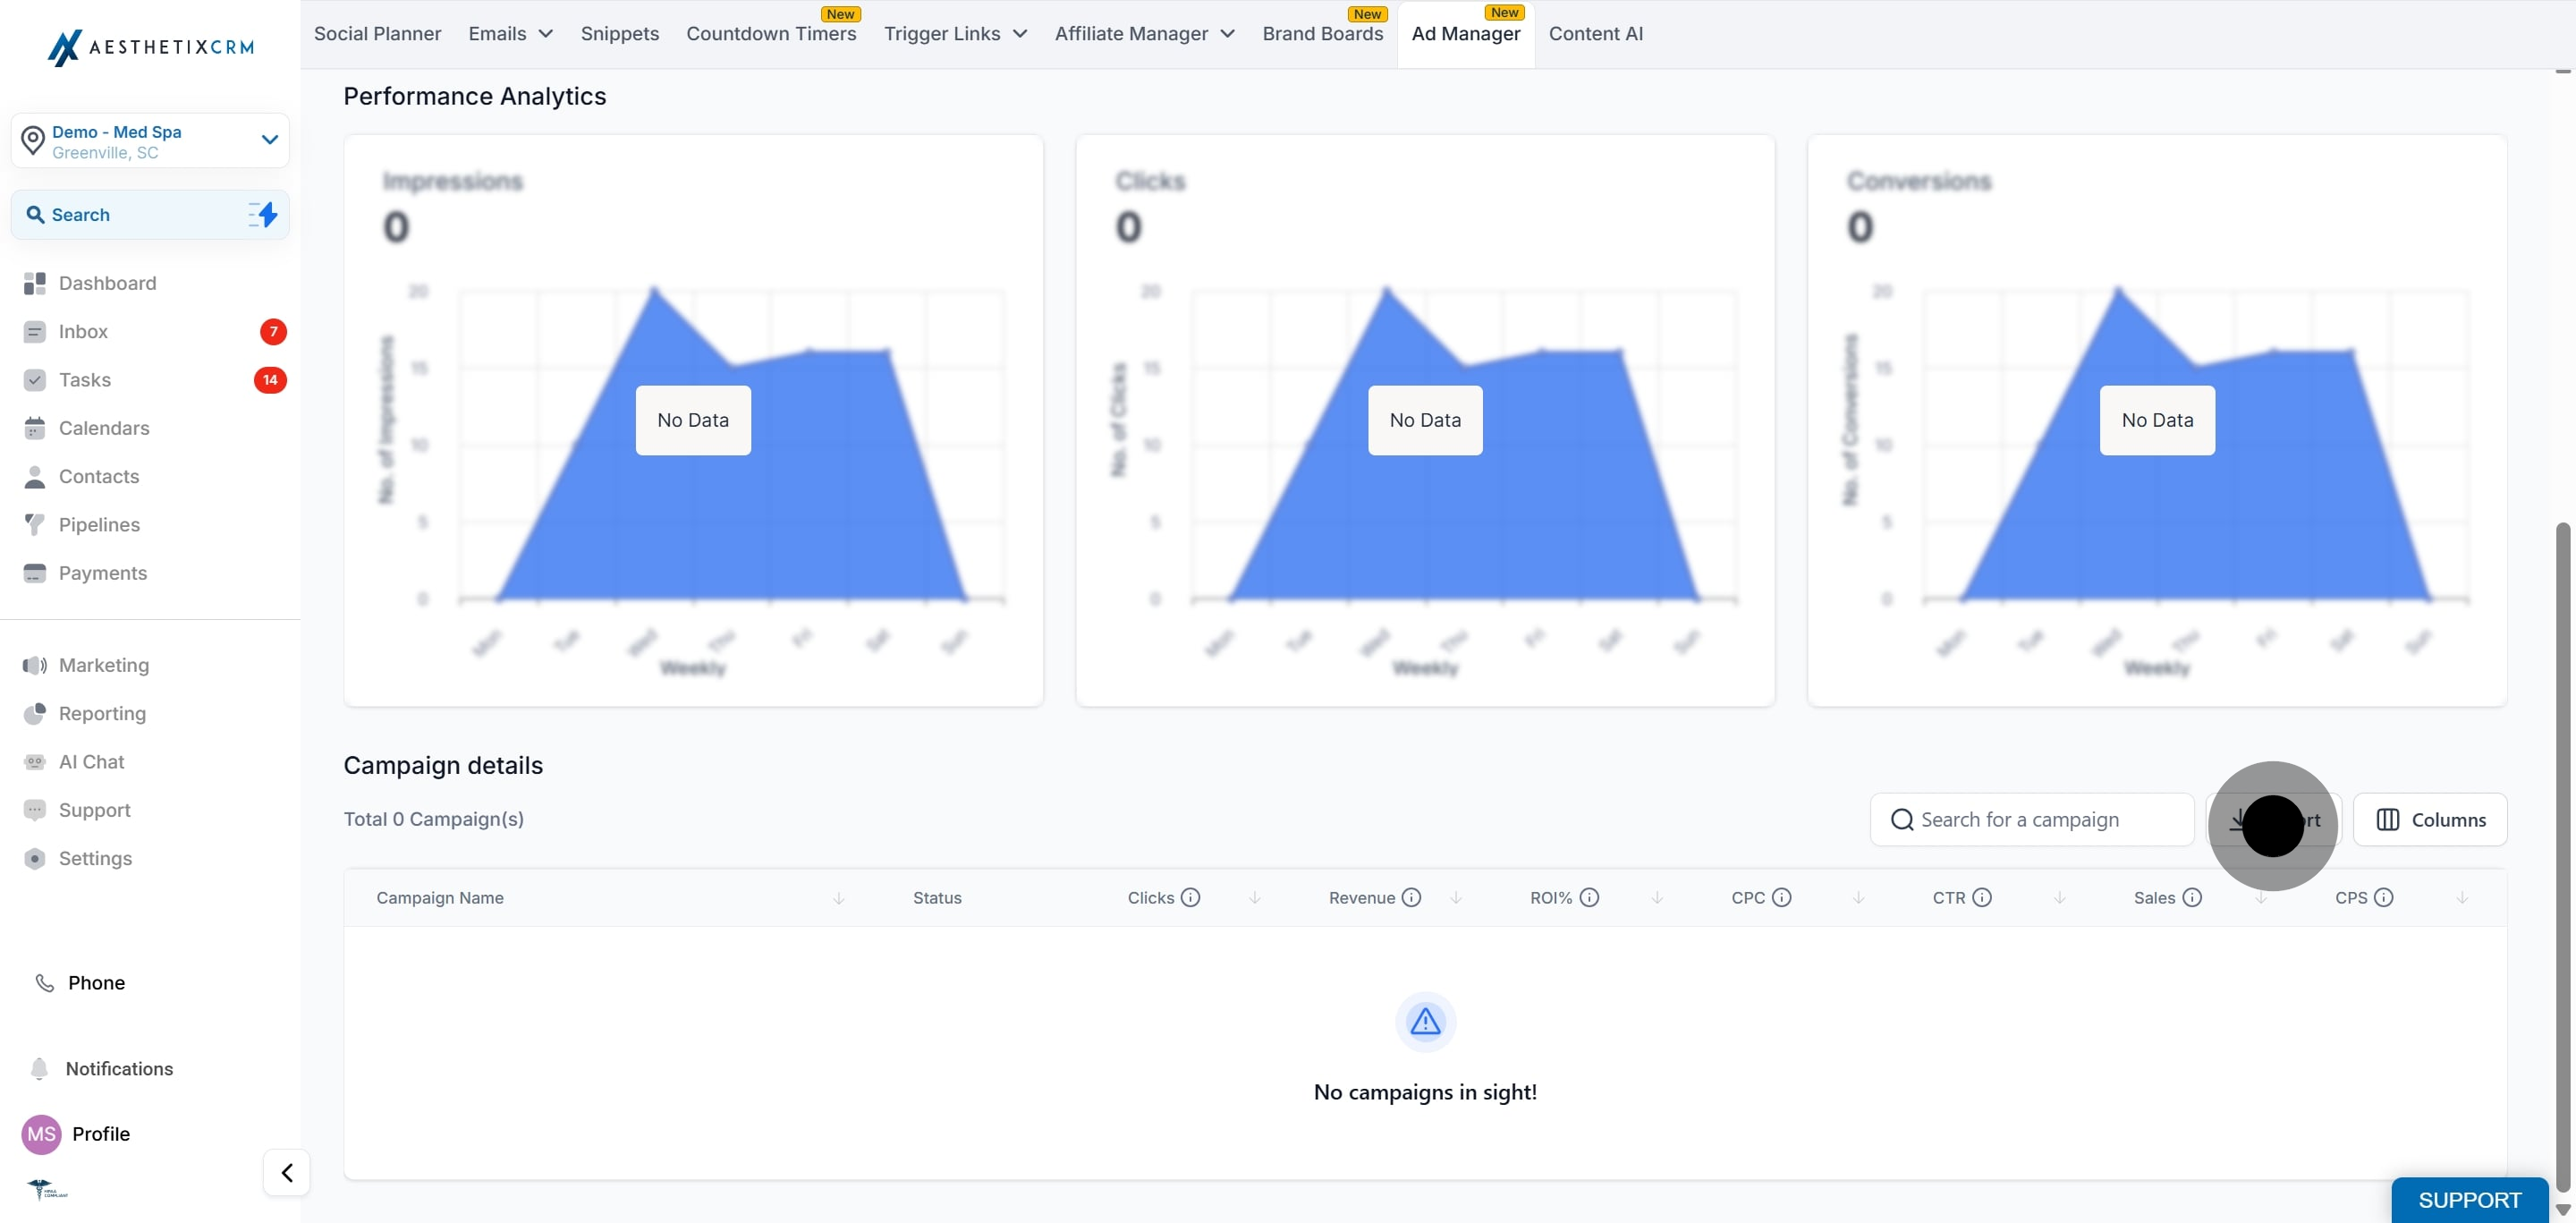
6. Is there a way to export the campaign statistics?
Yes, you can export your campaign statistics to a CSV file for further analysis or reporting purposes.
7. What do I do if I notice discrepancies in the data?
If you notice discrepancies in your data, first check the filtering settings. If issues persist, contact HighLevel support for assistance in troubleshooting.