Dive into the world of data-driven decision-making with our comprehensive guide on Social Planner Statistics! This article explores the key metrics and analytics available within Social Planner, helping you measure the effectiveness of your social media strategies. Learn how to interpret engagement rates, audience demographics, and content performance metrics to refine your approach and boost your online presence. Ideal for marketers, business owners, and content creators, this guide will empower you to harness the power of statistics to enhance your social media campaigns and achieve your marketing goals!
1. Click on "Marketing".
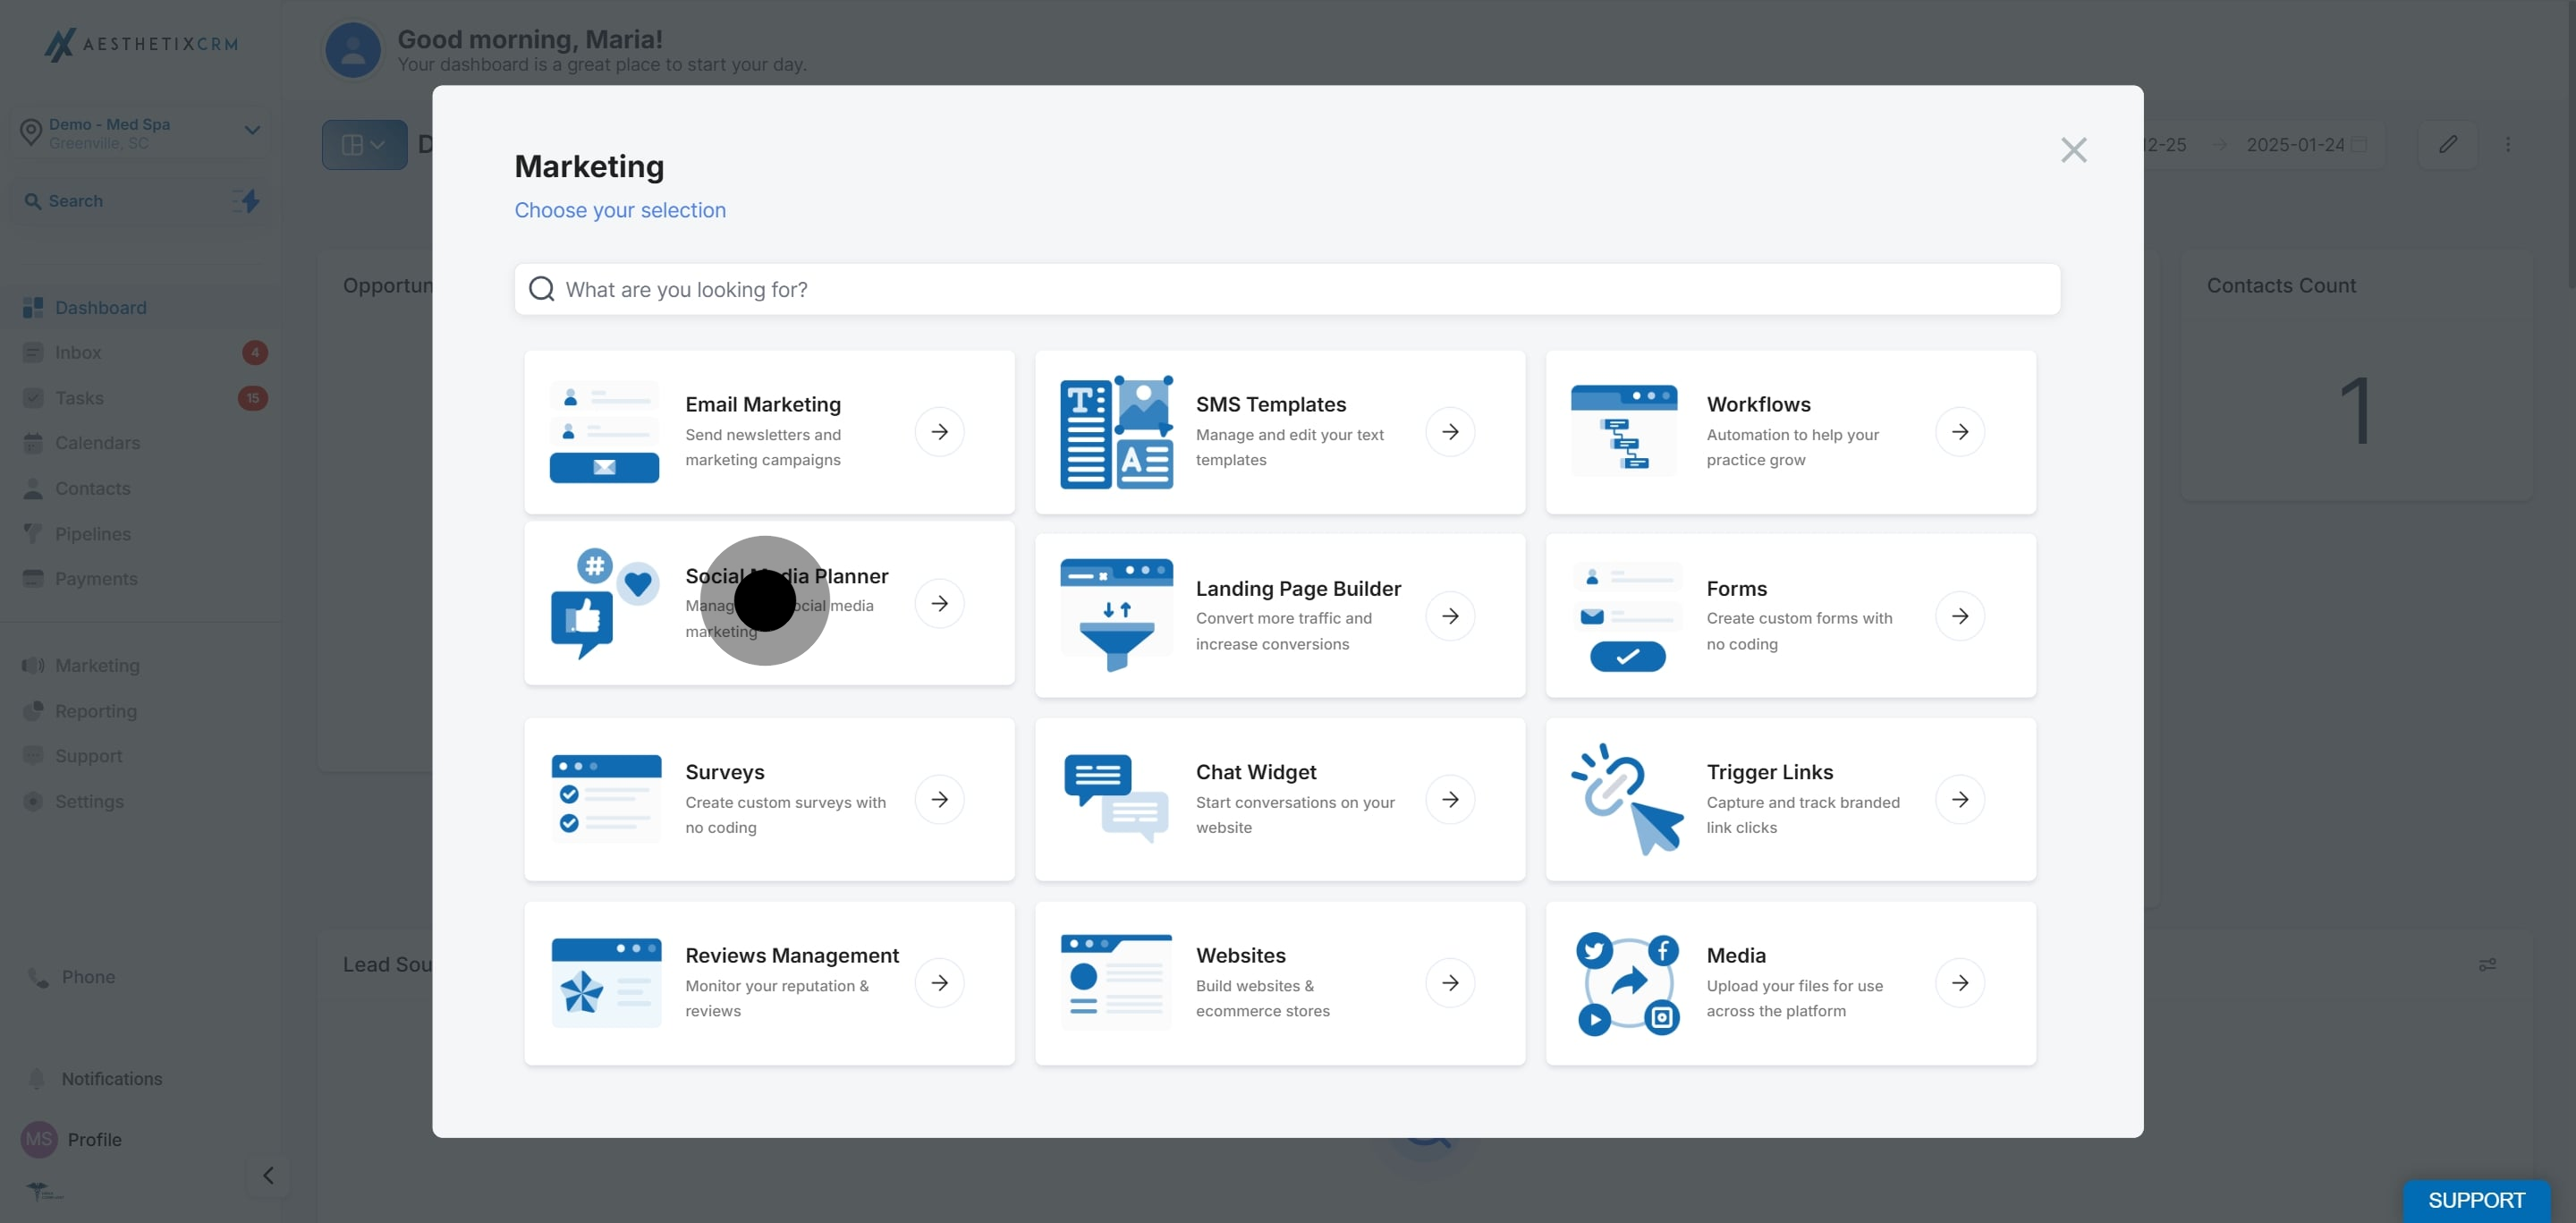
2. Click on "Social Media Planner".
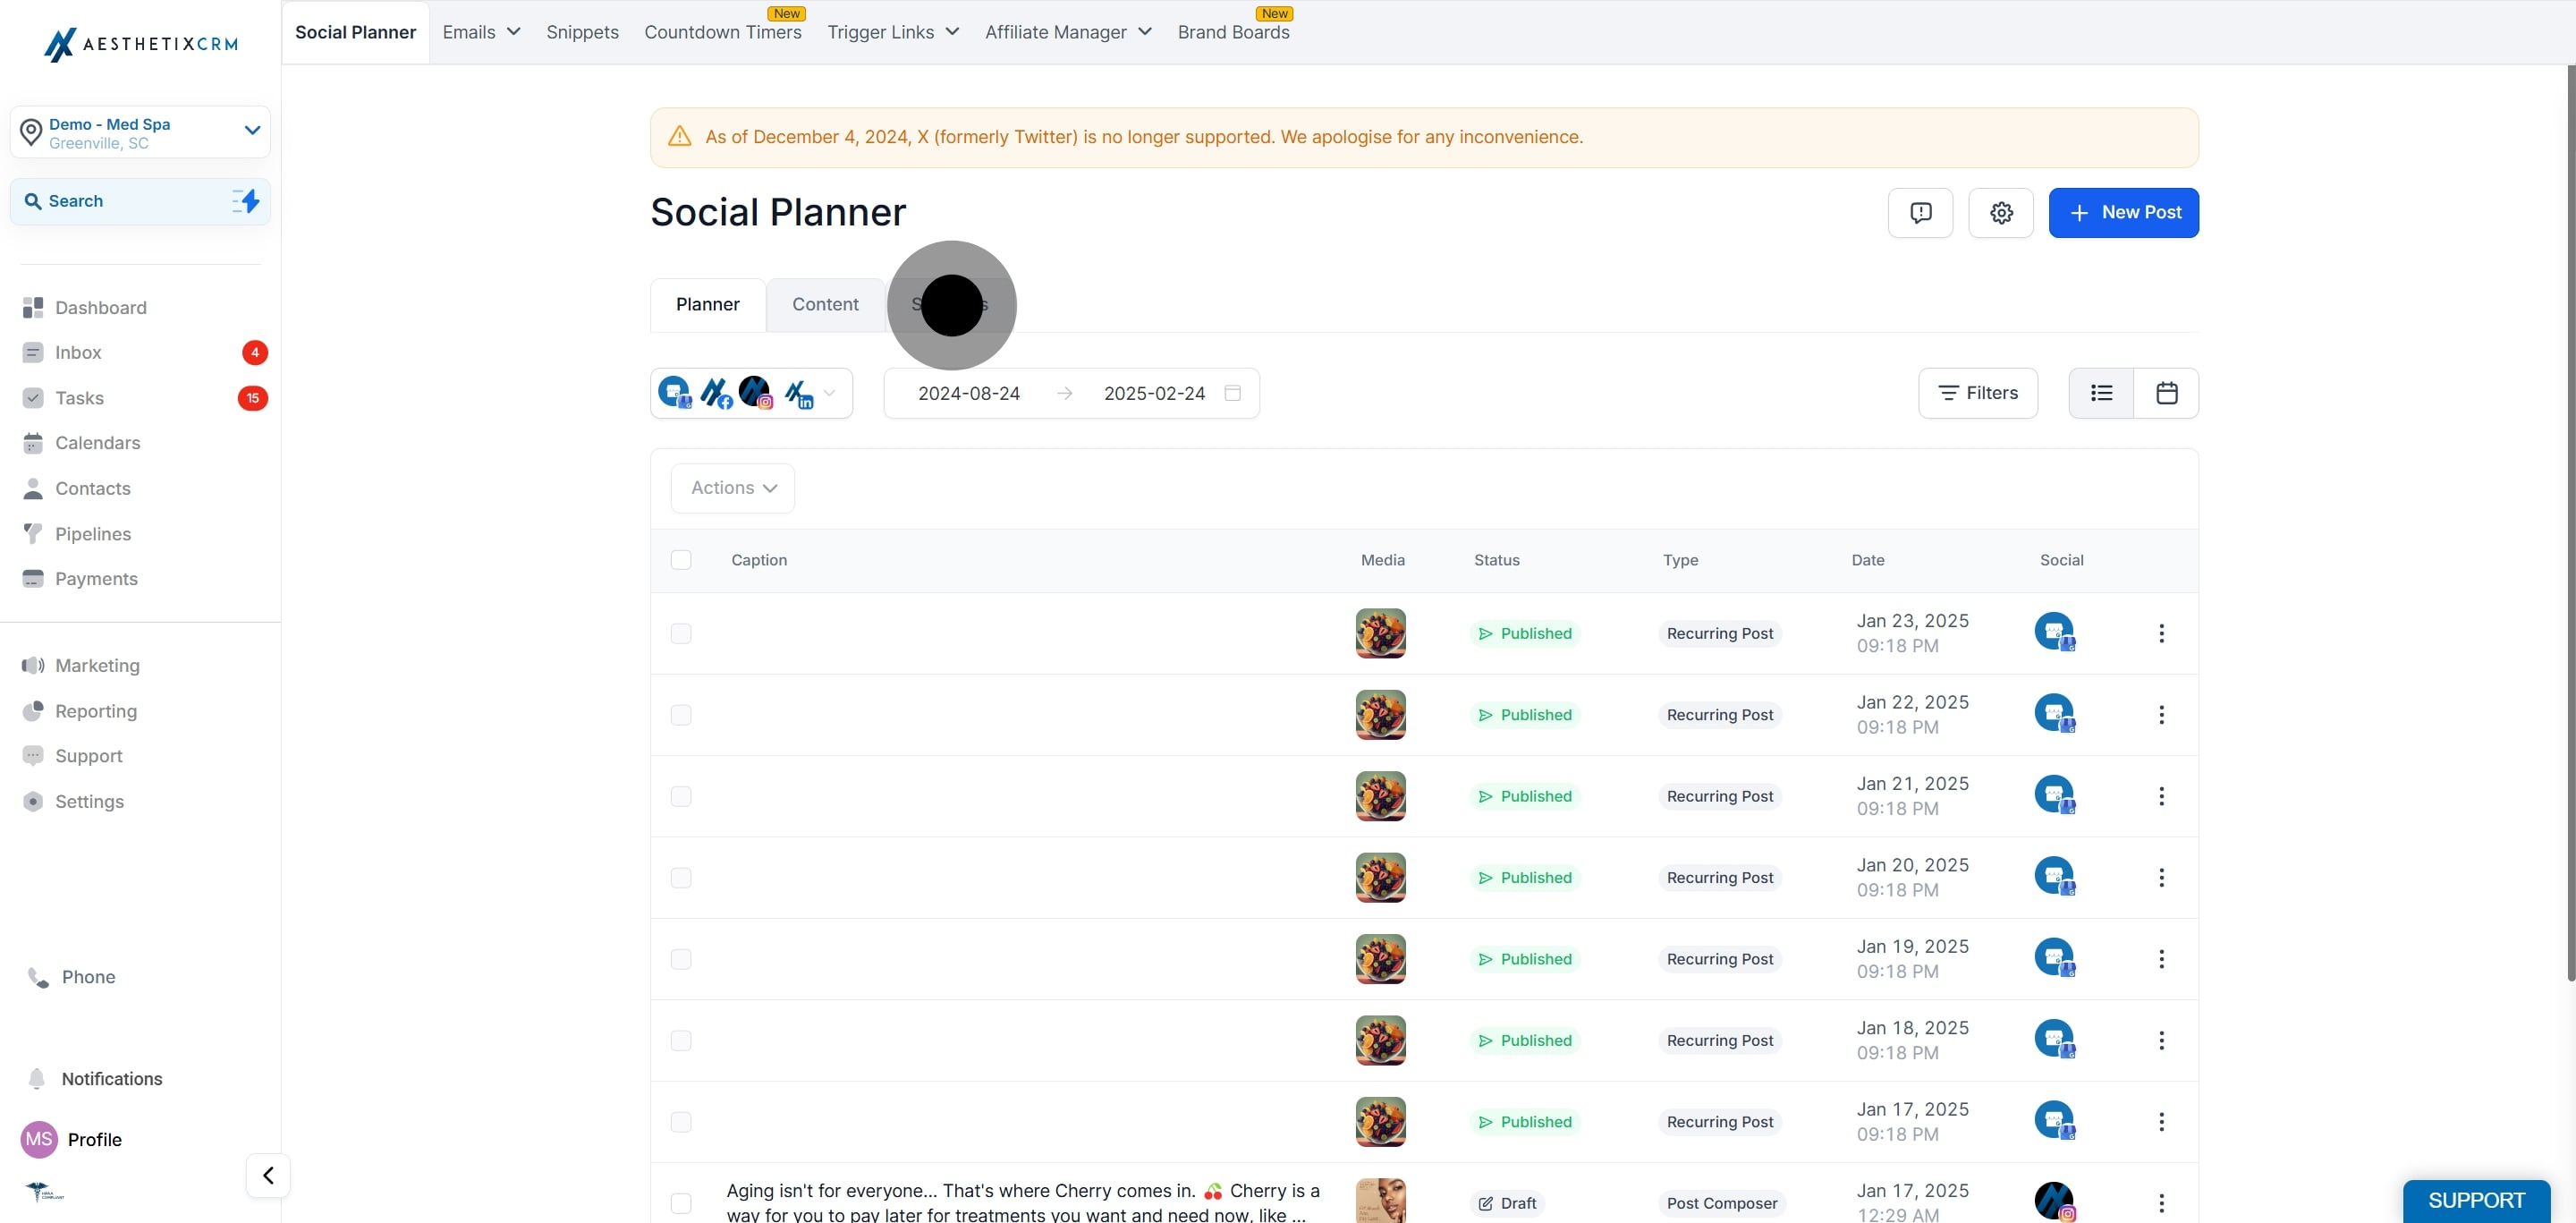
3. After, click on "Statistics".
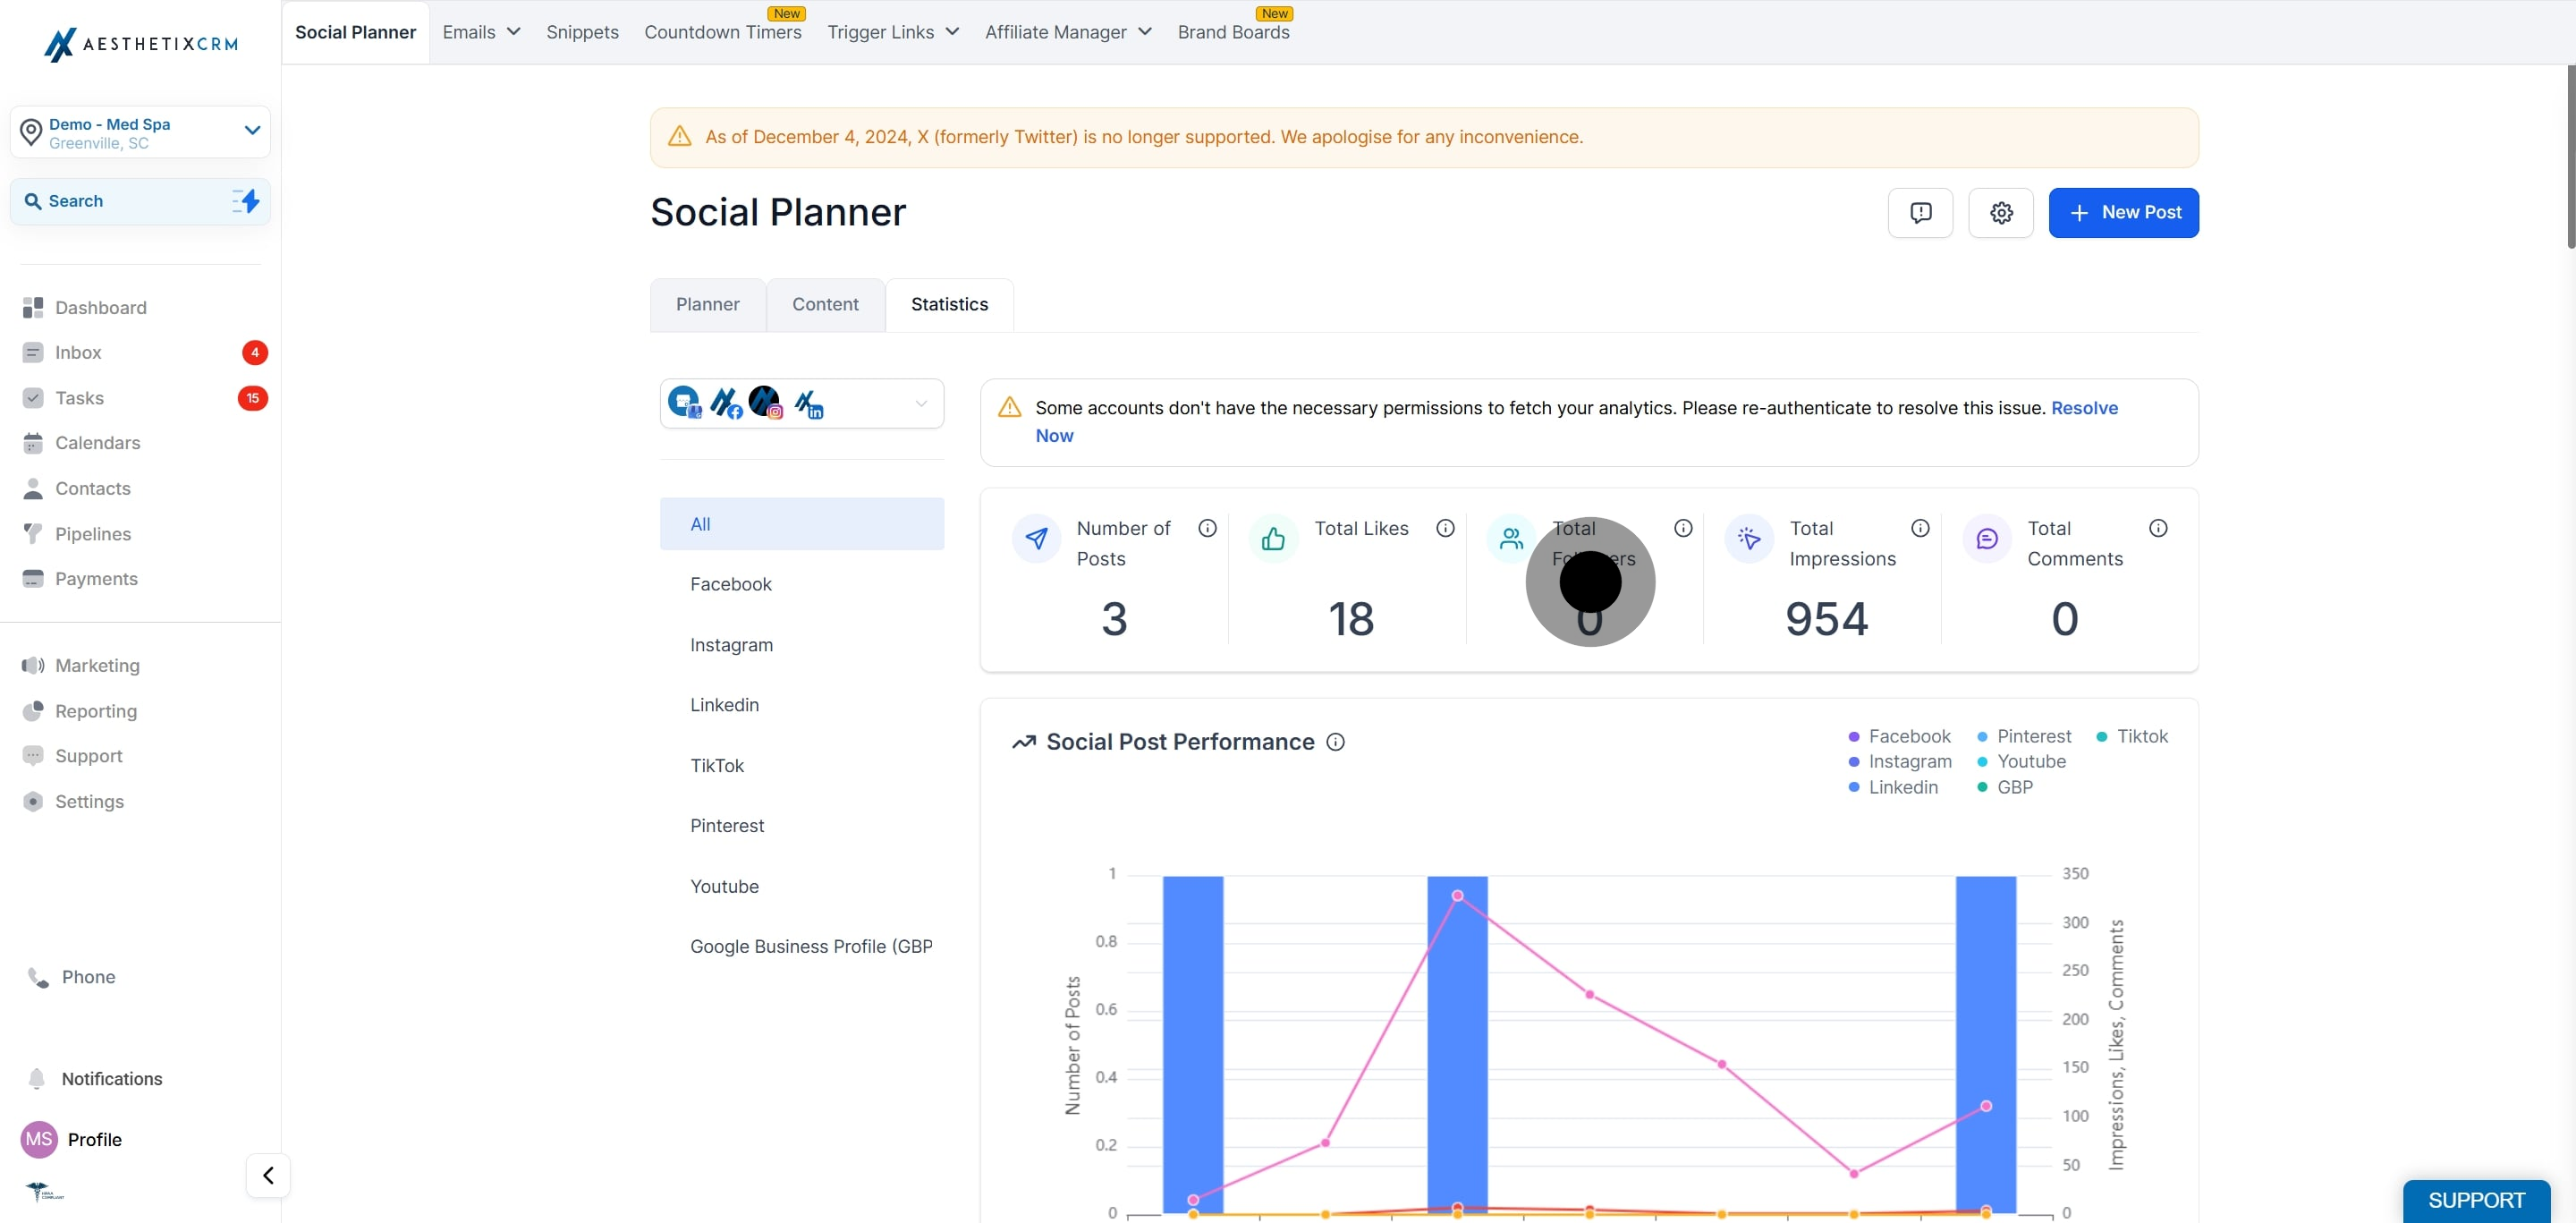
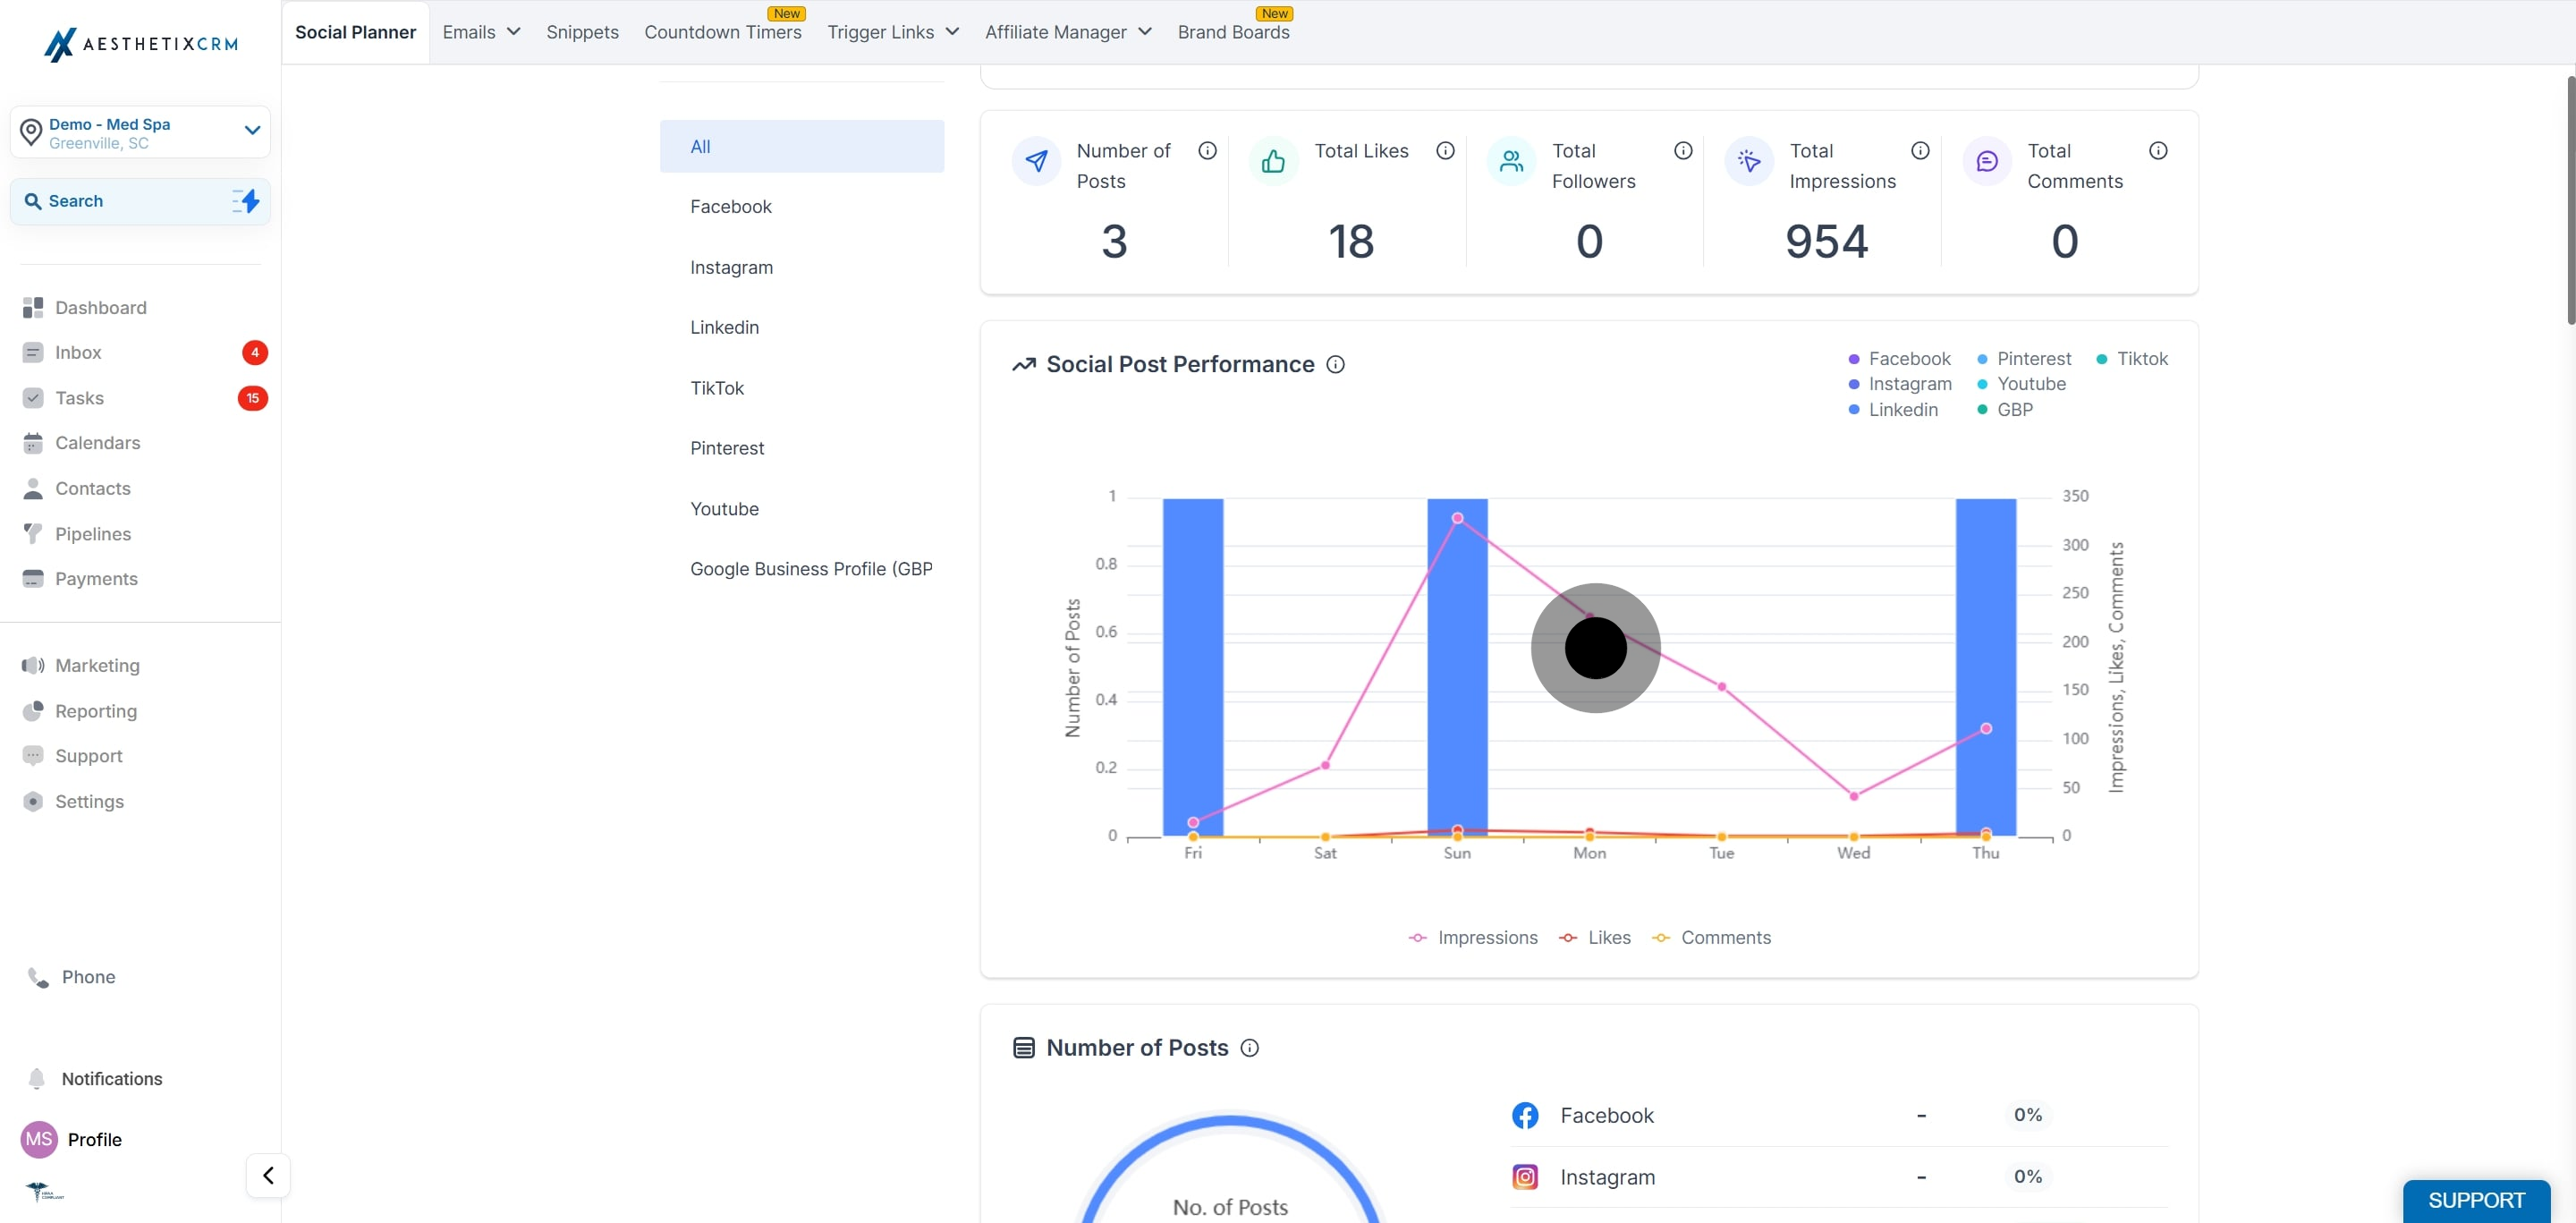
4. Check the numbers of published post, likes, comments, shares and followers.
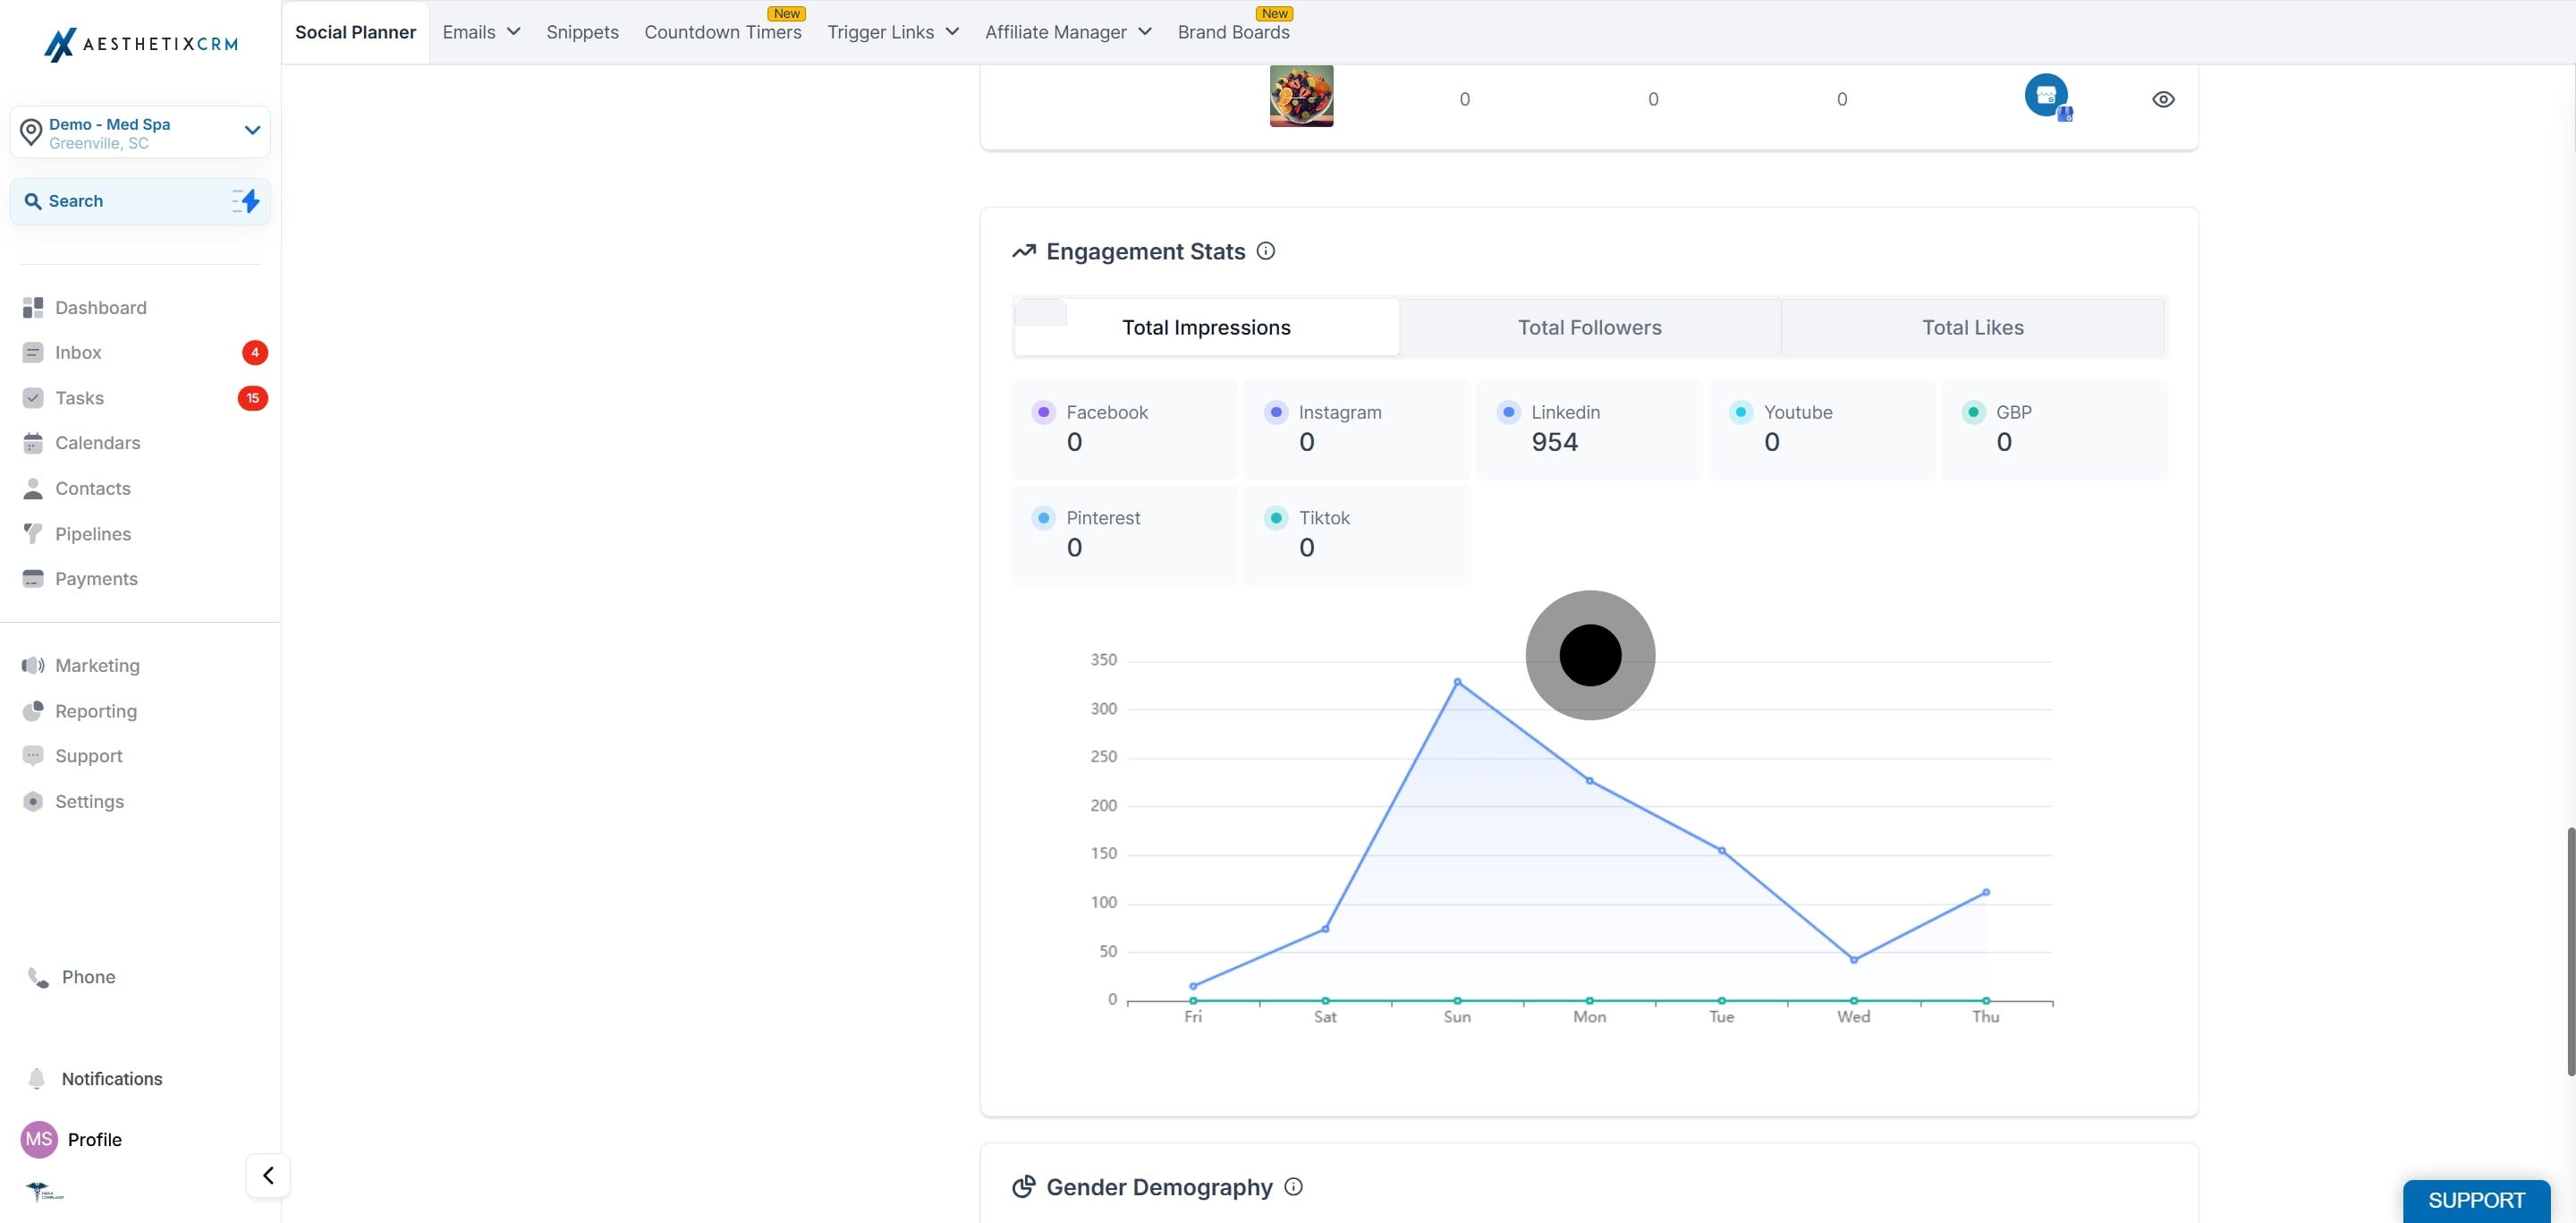
5. Analyze the bar graph with line giving stats on weekly published post across socials with line representing total impressions, likes and comments each day.
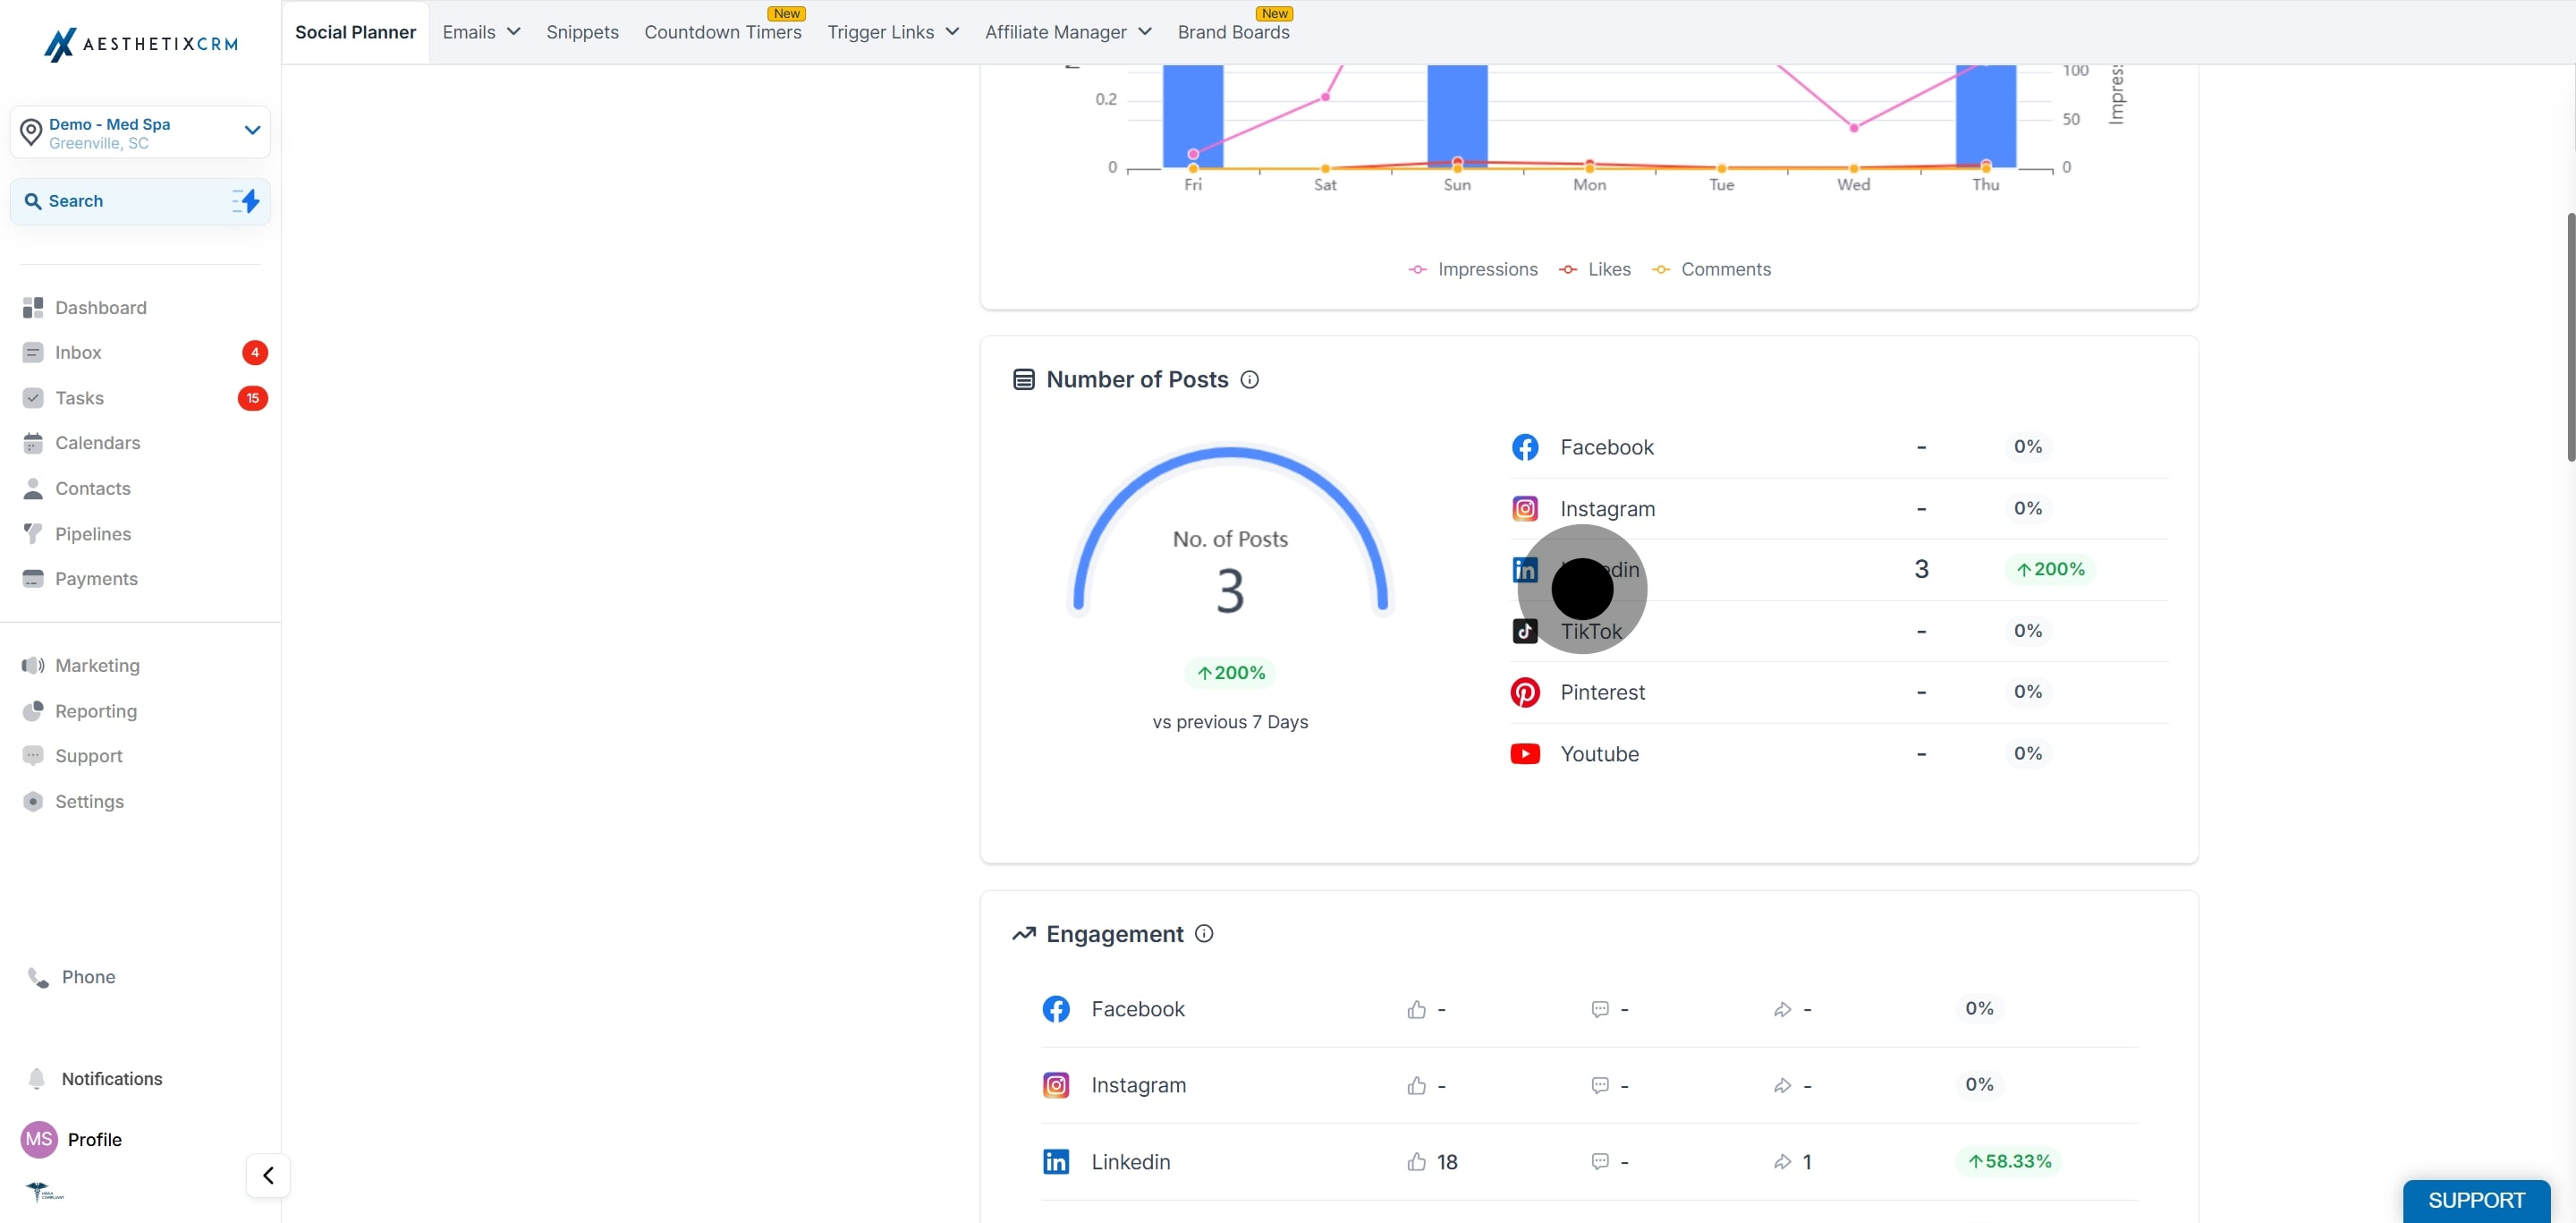
6. Data point representing the total published post across the socials with change(increase or decrease) percentage Vs precious percentage of published post.
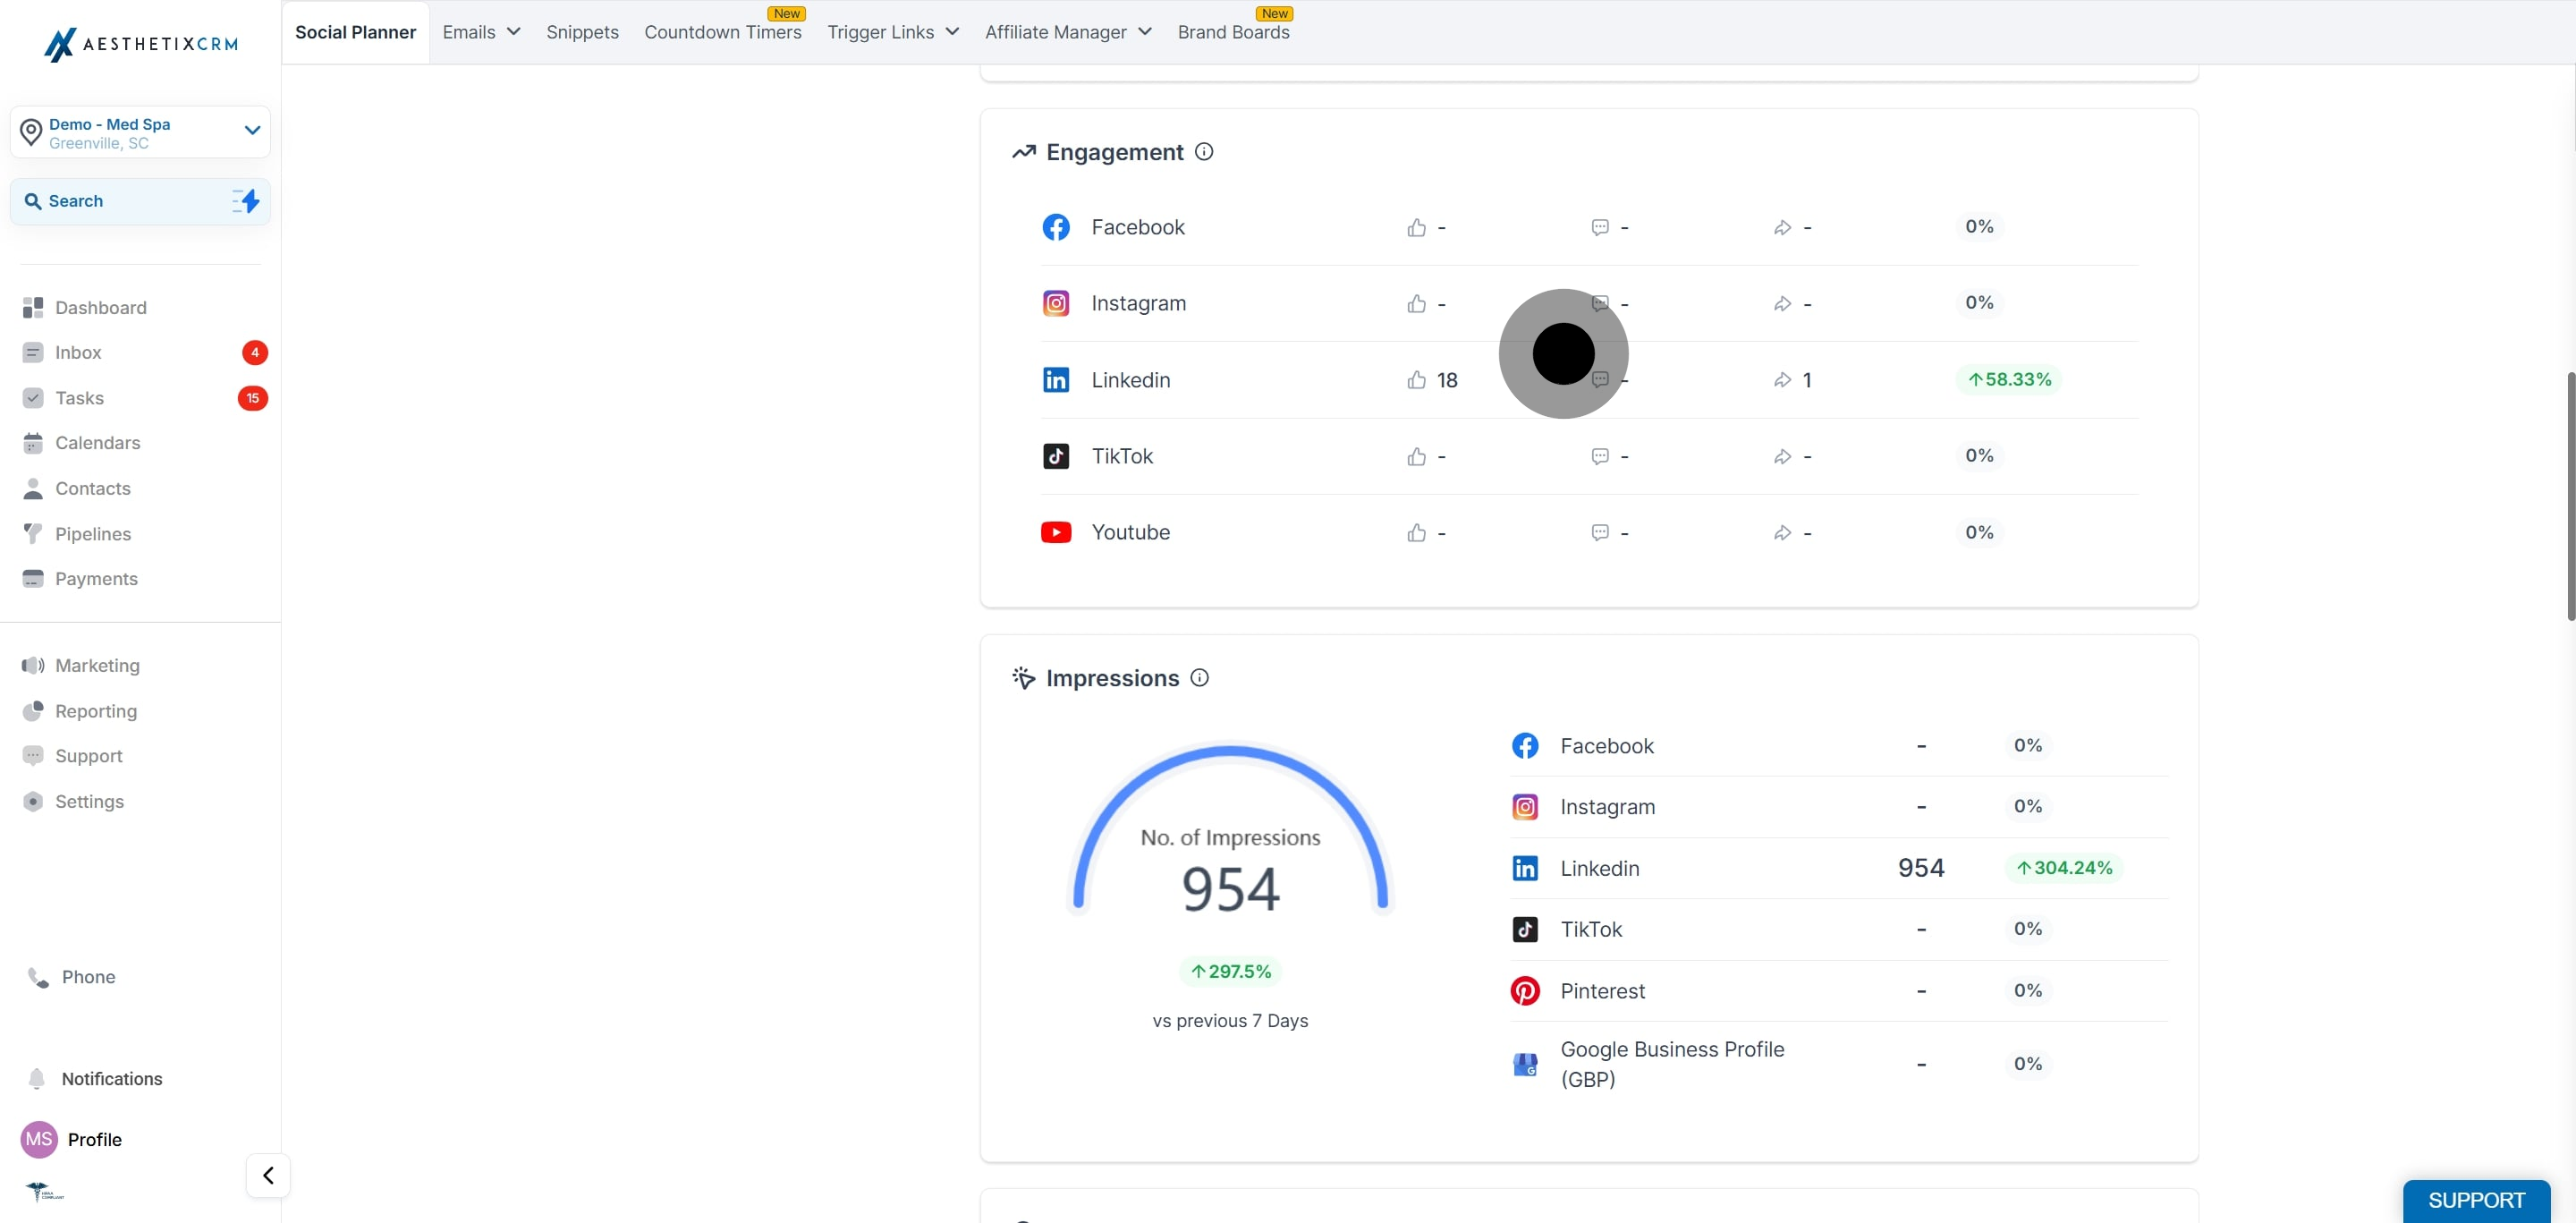
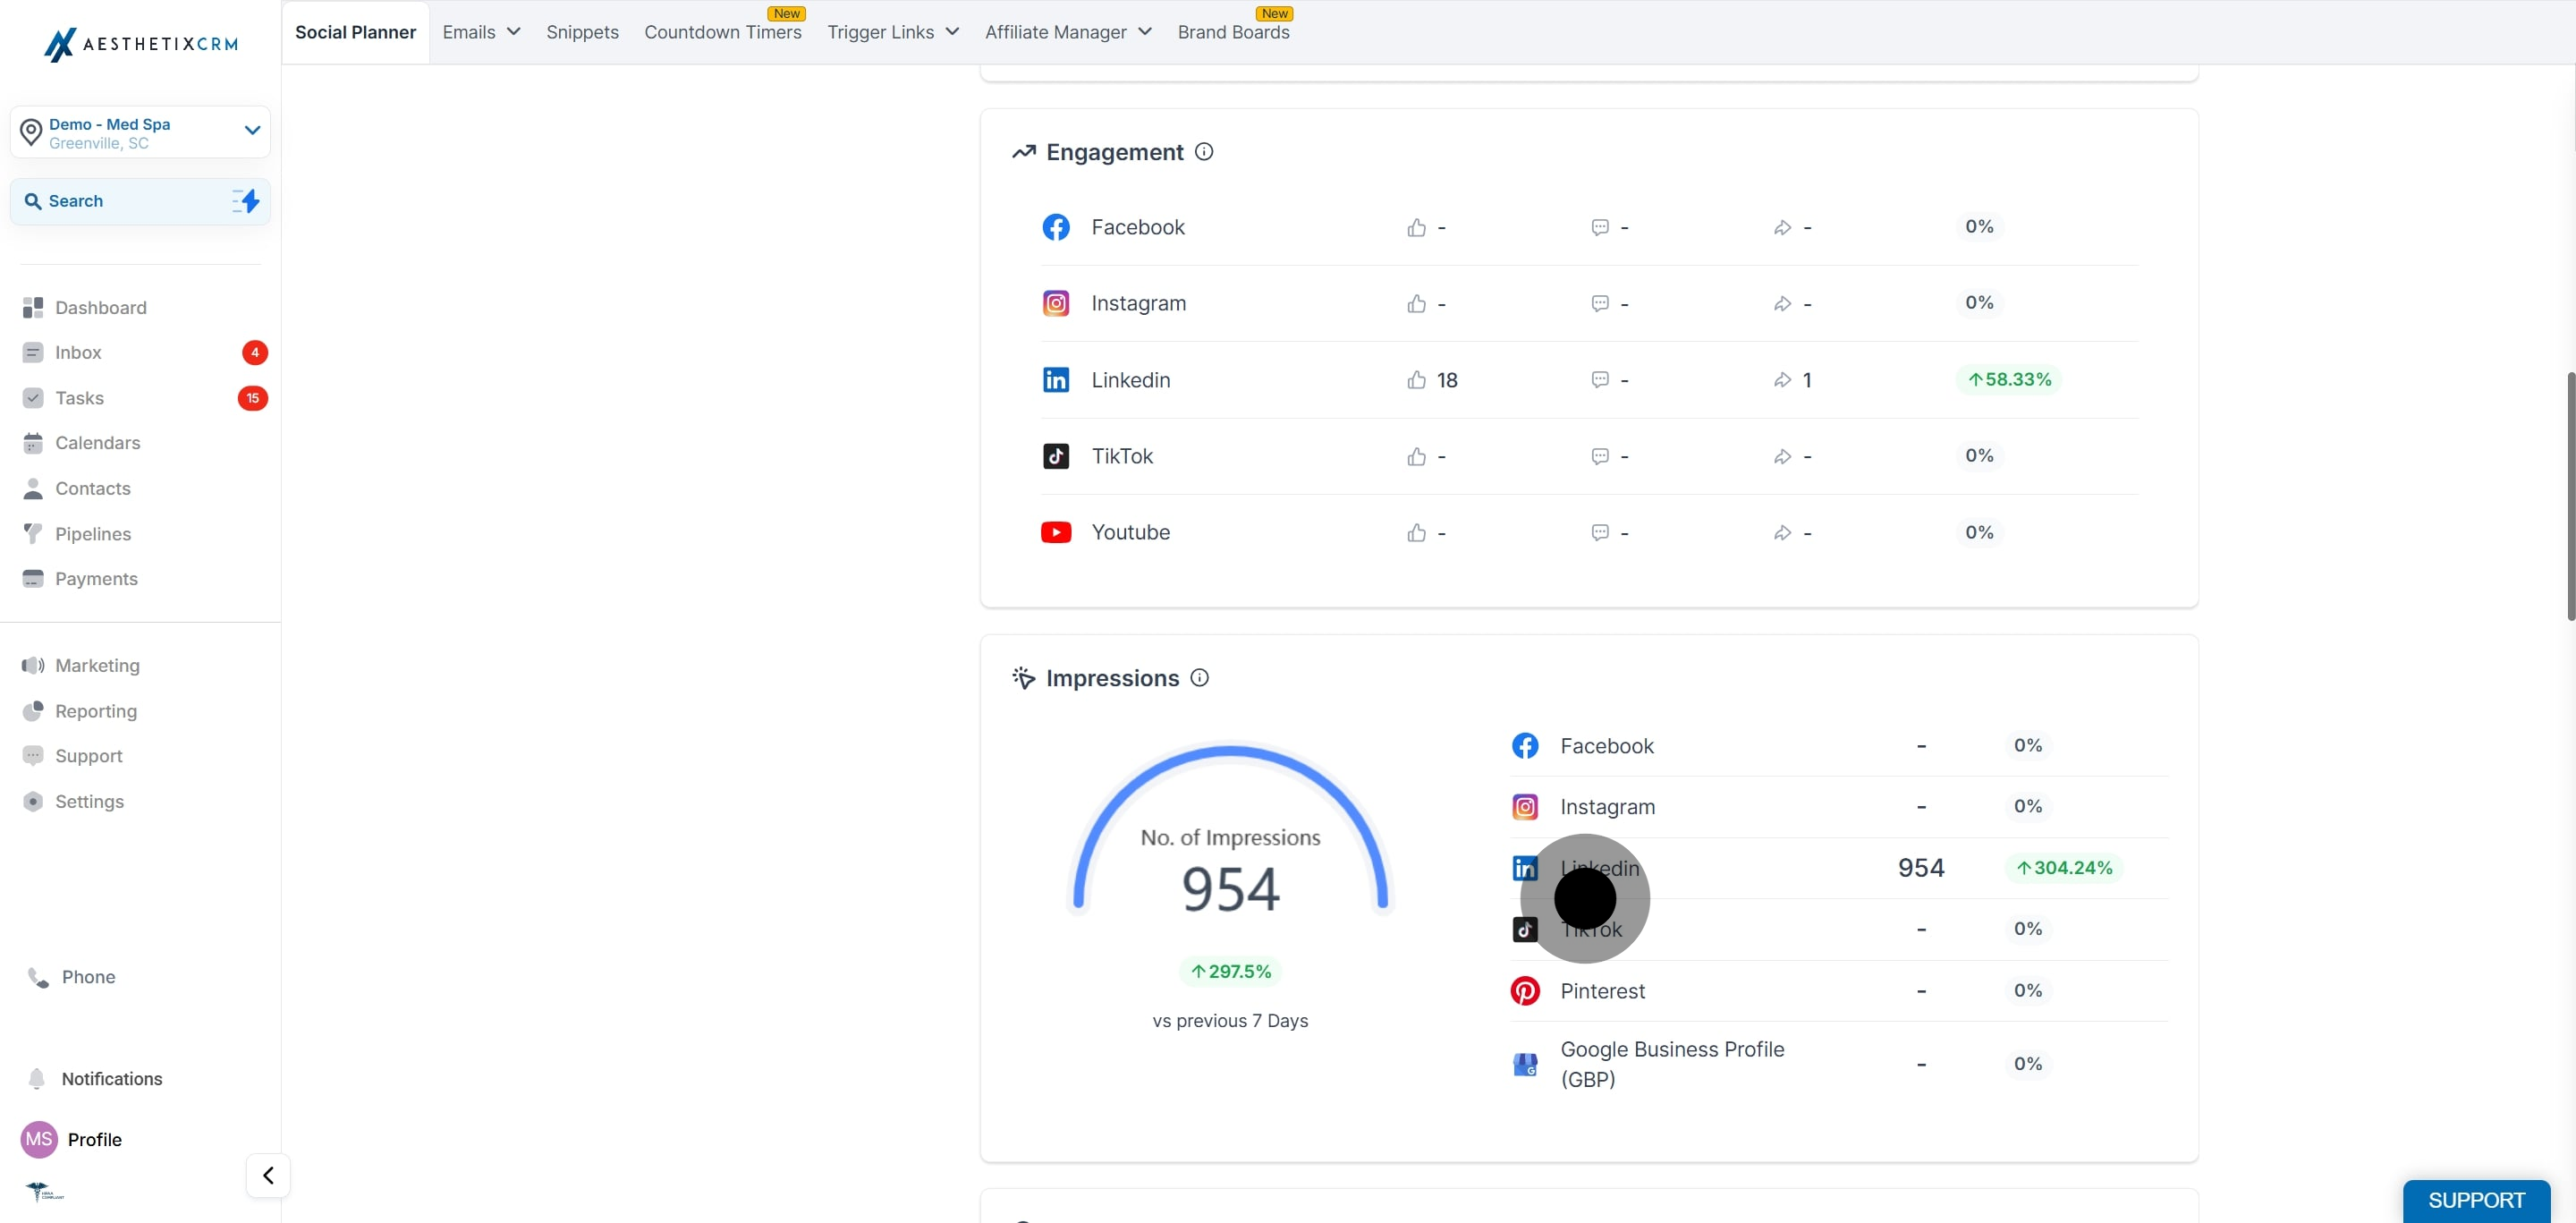
7. Showing Engagement details of like , comments and share as well as change in percentage previous week.
8. Impressions shows the number of times any published post was displayed on a person's screen. Impression percentage reflects change in this week's data compared to the previous week.
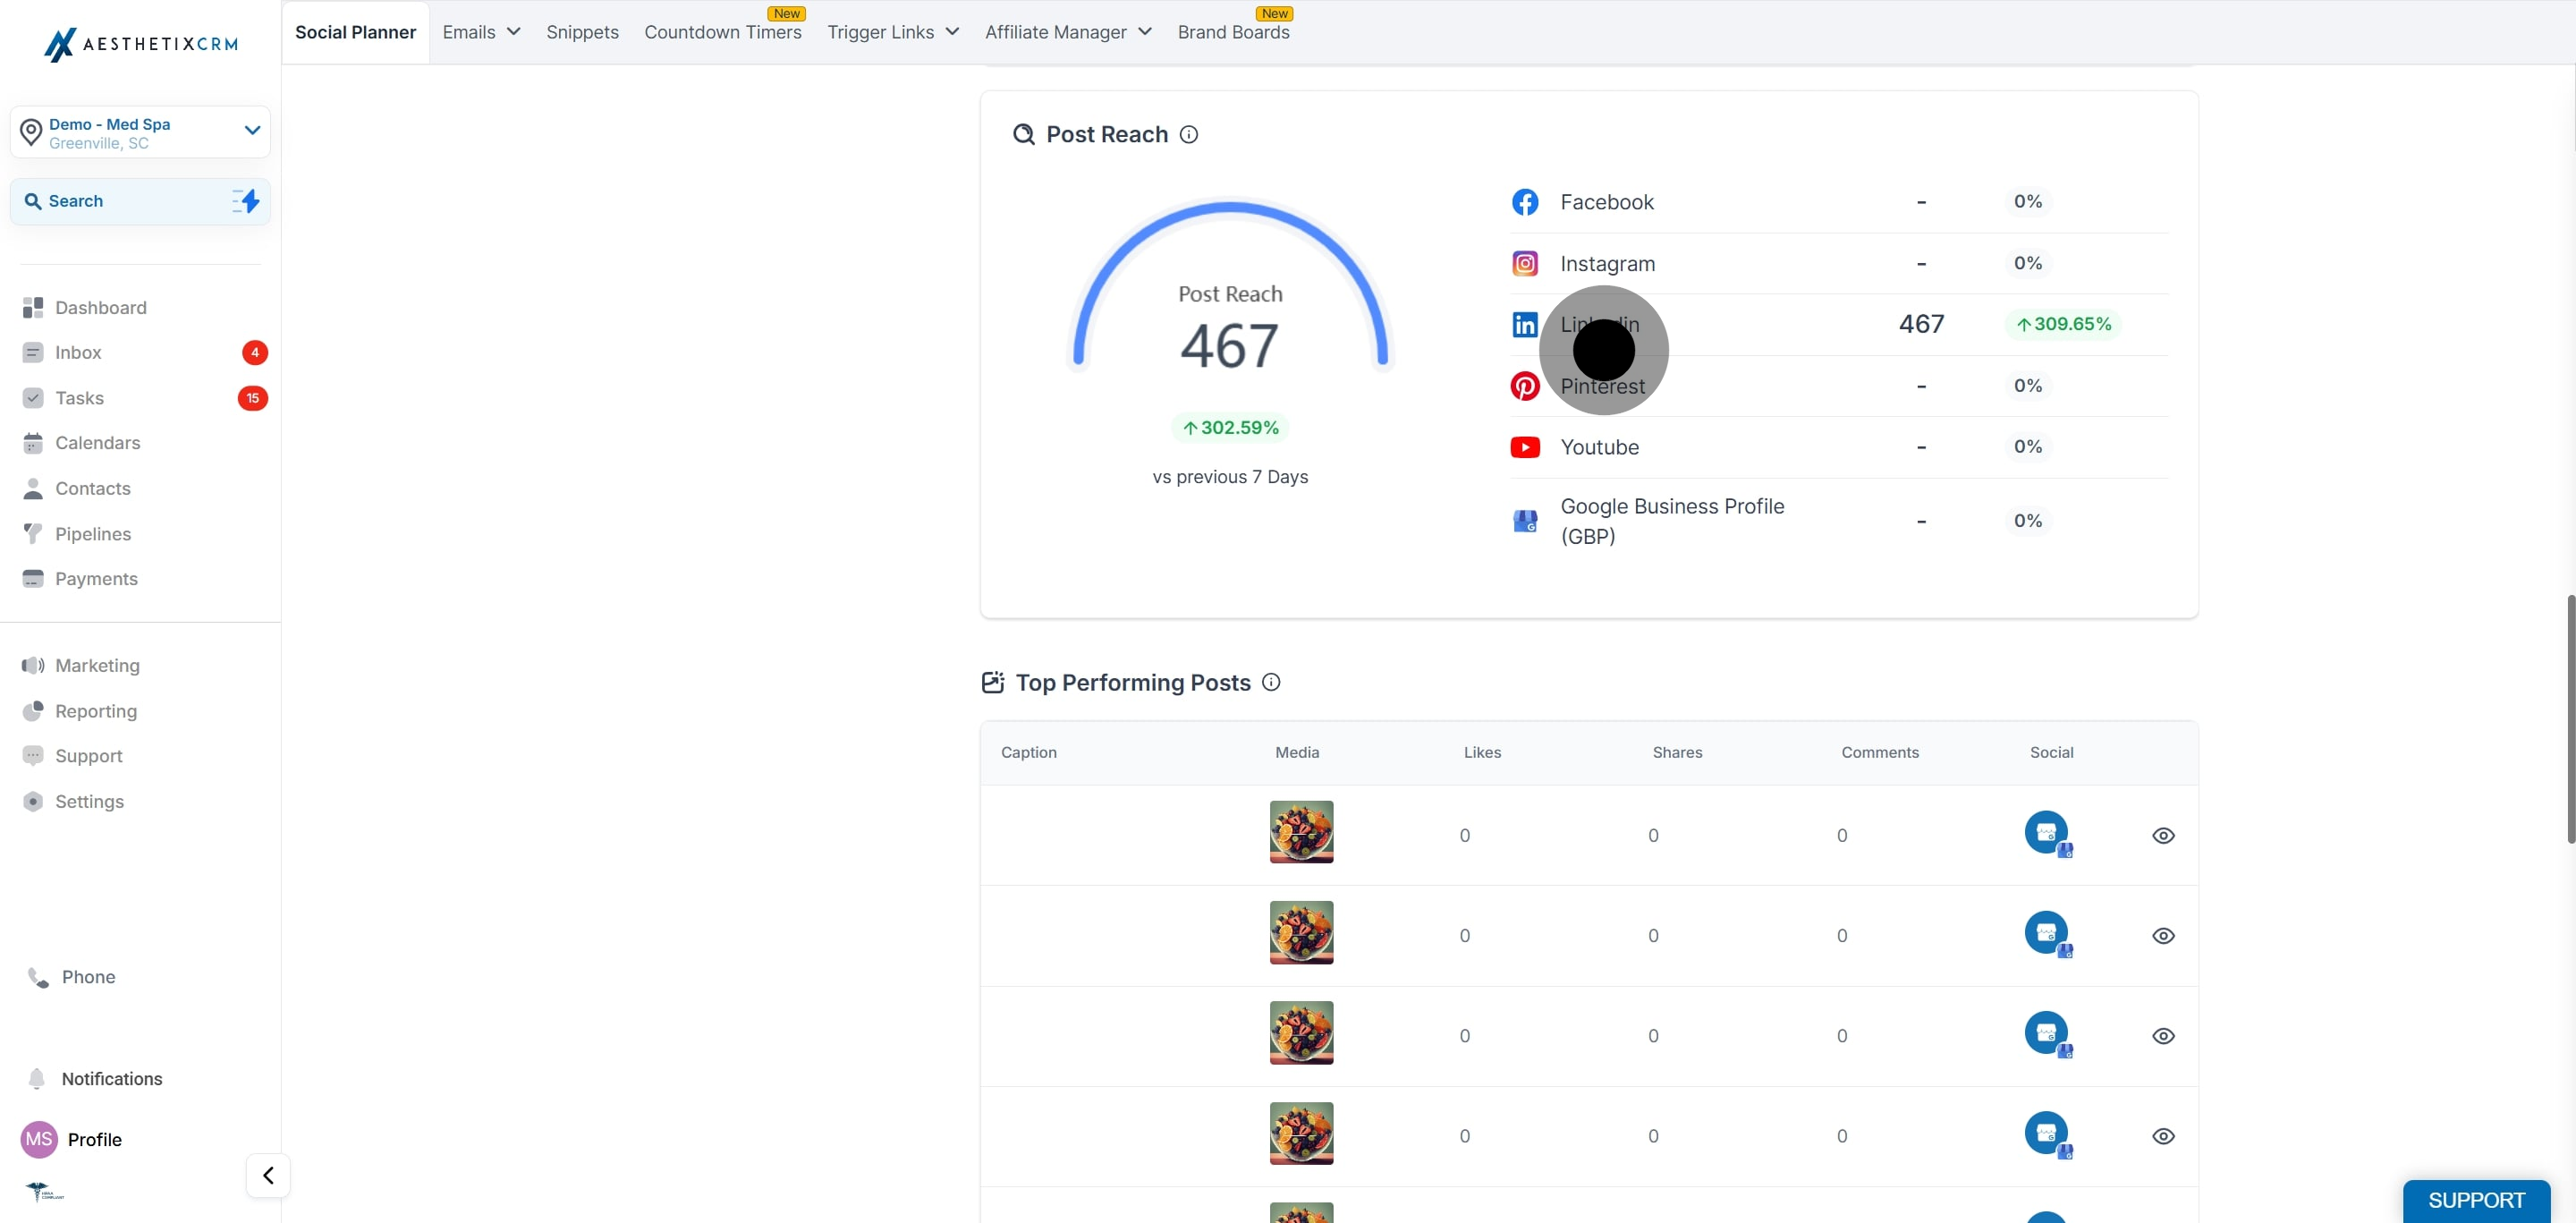
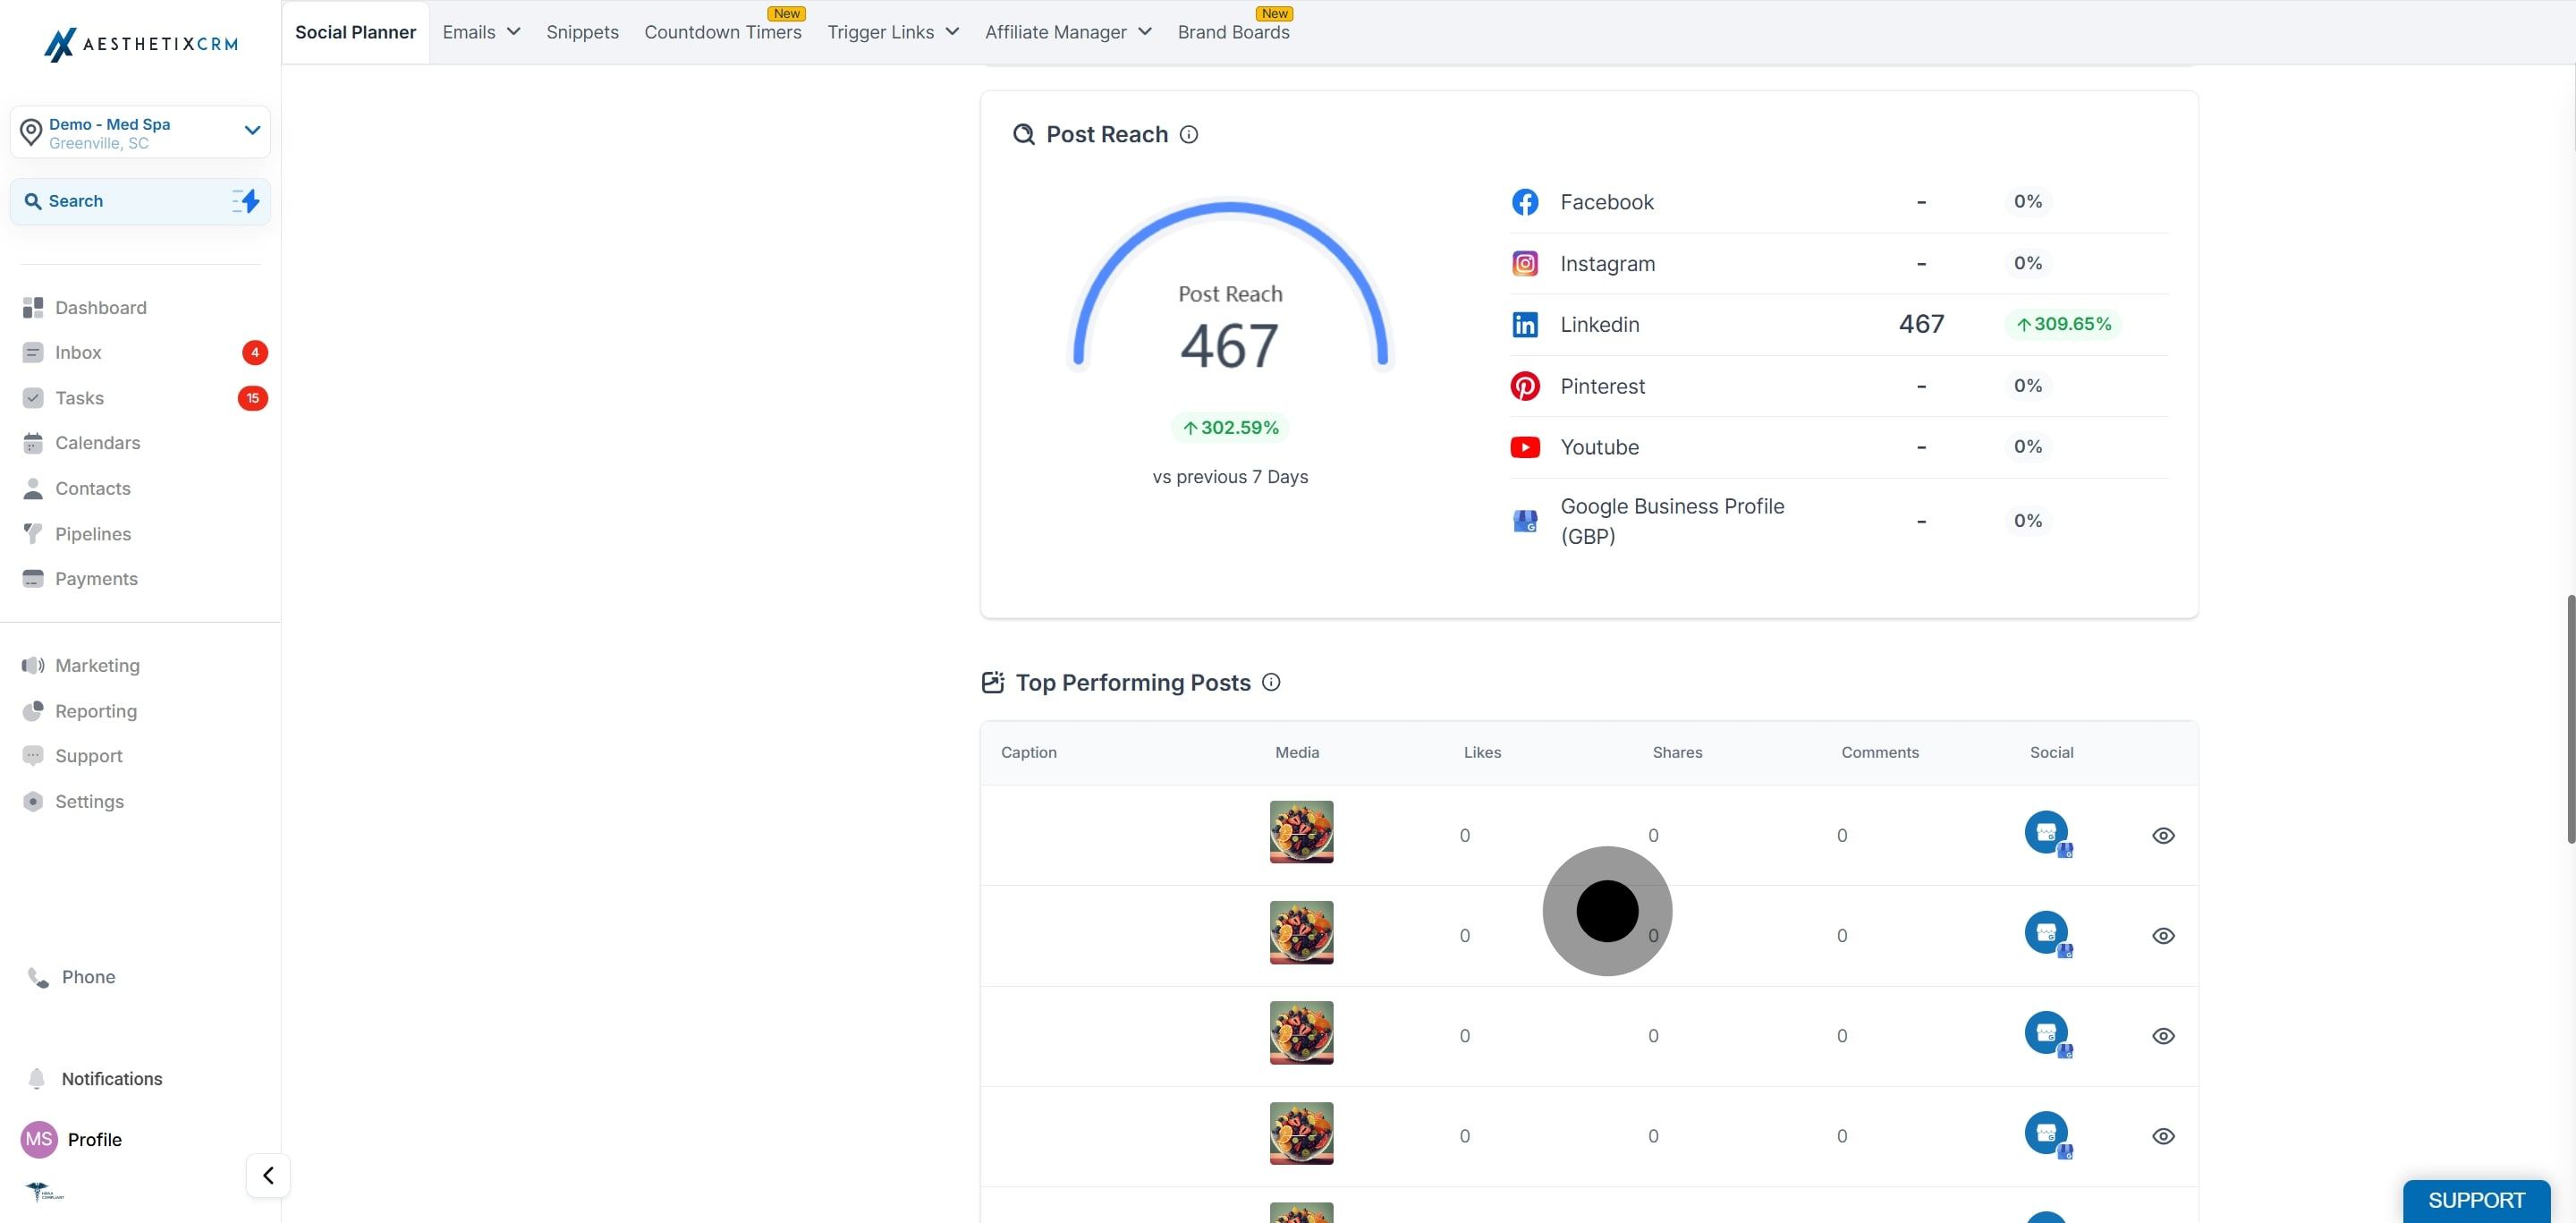
9. Post reach refers to The number of people who had any content from your Page/account or about your Page enter their screen. This includes posts, check-ins, ads, social information from people who interact with your Page and more. Post Reach percentage reflects change in this week's data compared to the previous week.
10. Adding Top Performing post table which is top performance on basis on likes for published social post from social planner.
11. Engagement Stats.
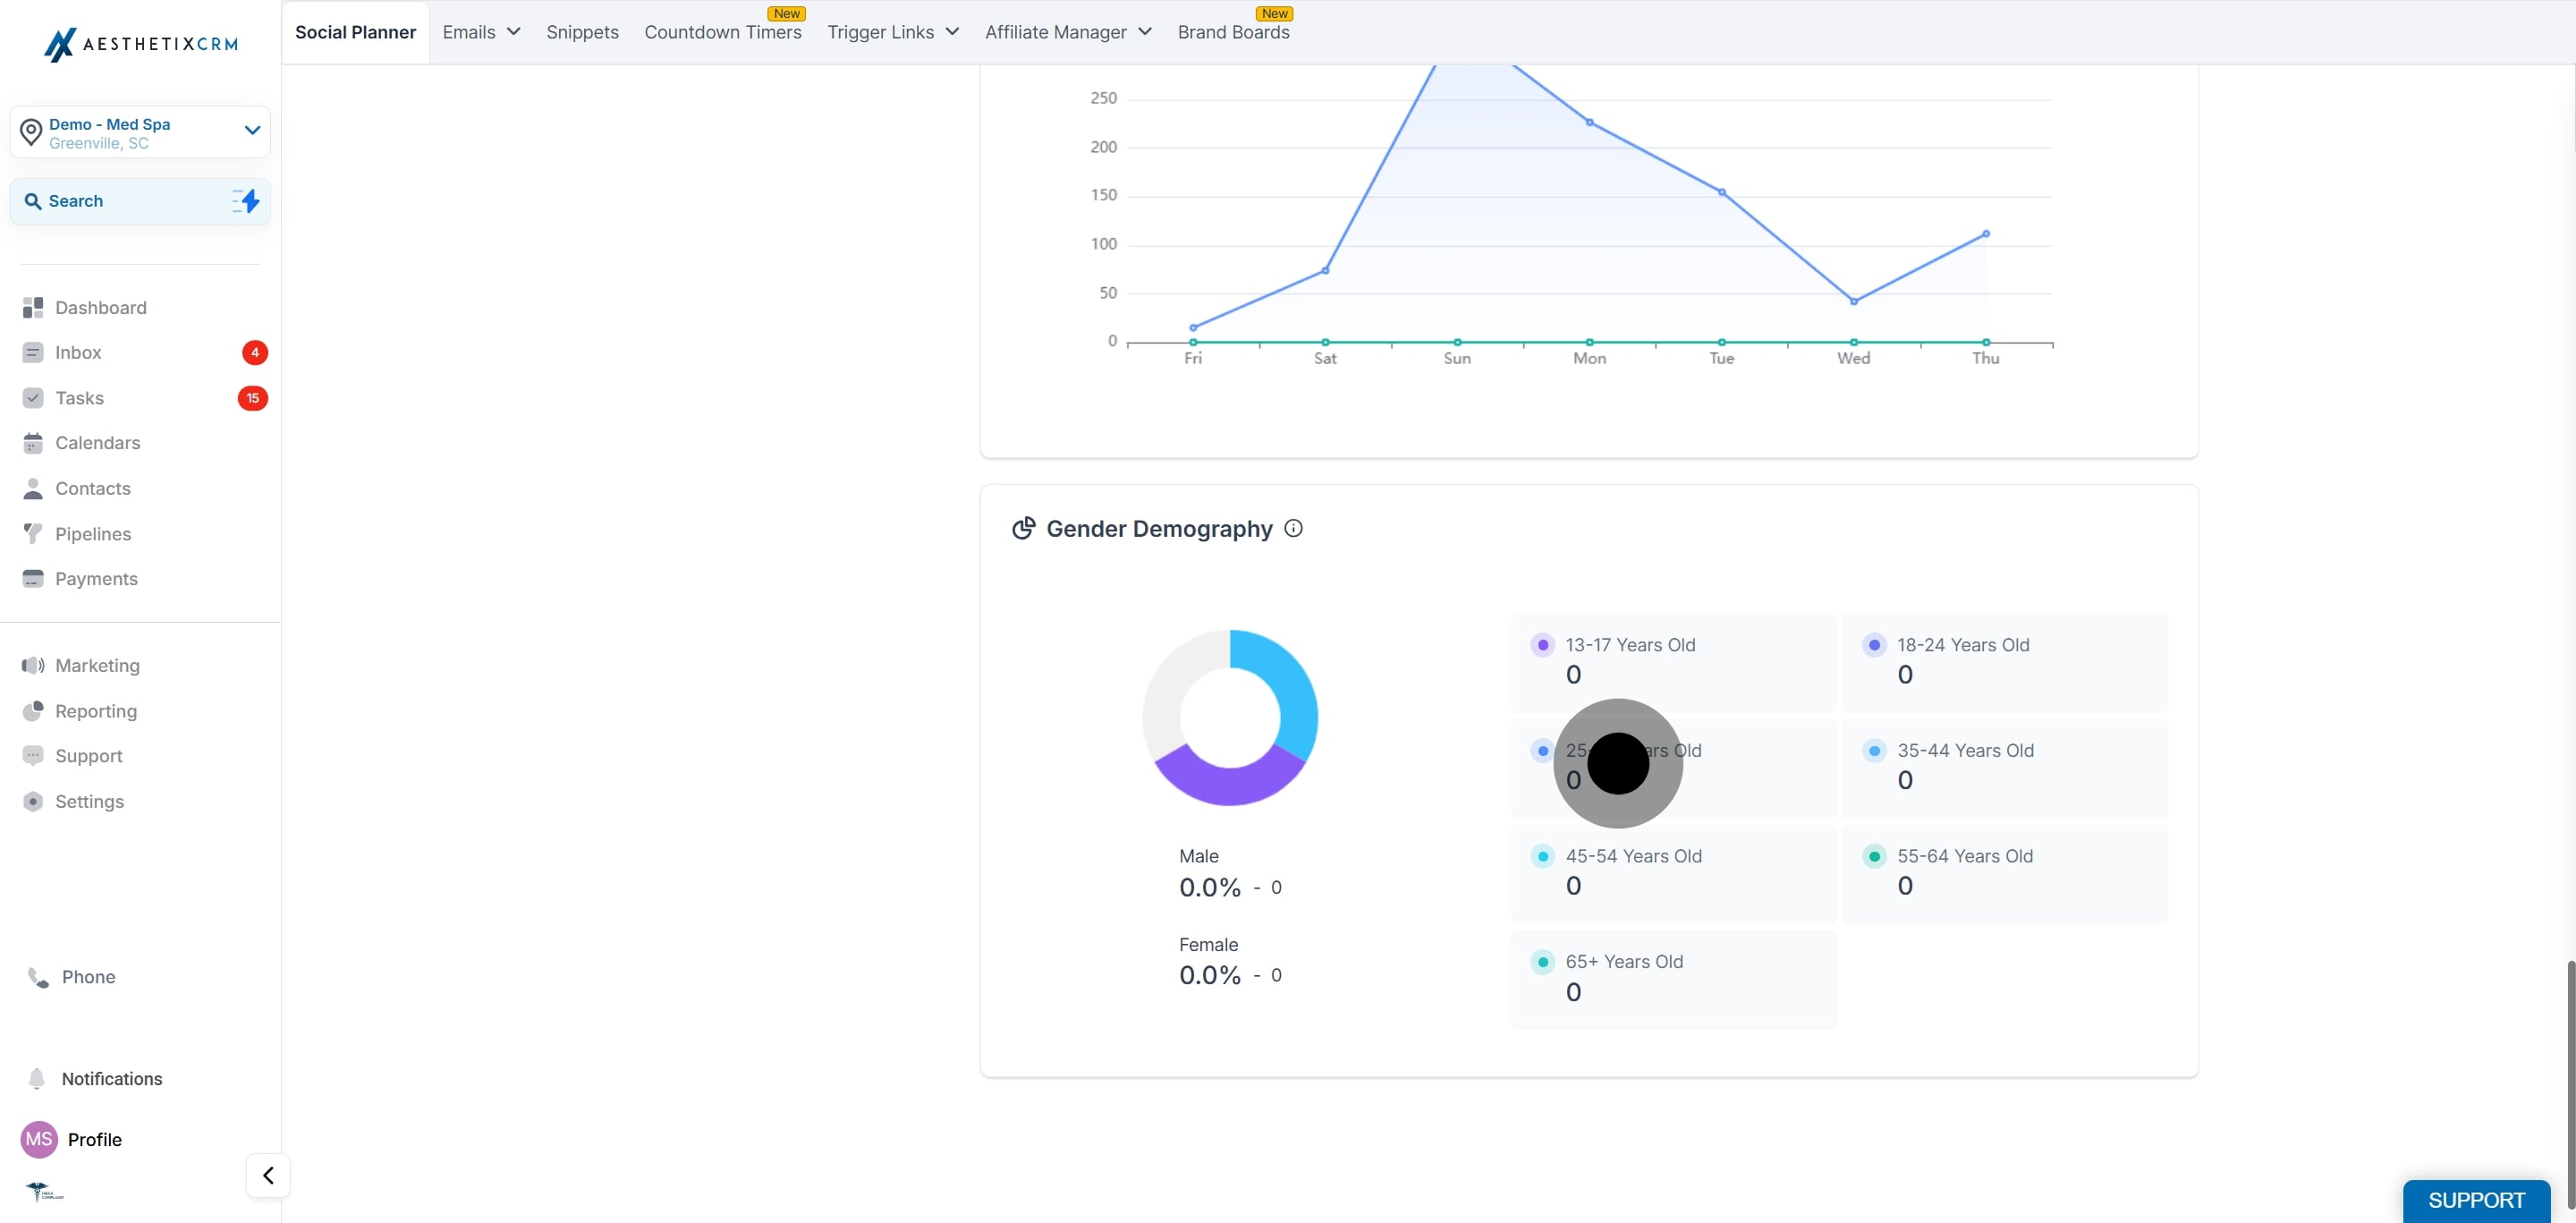
12. Gender demographic shows the distribution of gender - male and female ratio. For Facebook, Gender demographic is not available for Facebook. For Instagram, metric is not available for Instagram users with fewer than 100 followers. Demographic data is only available for those viewers who has shared the data for calculation.